Analysis and Design of Web-Geographic Information
System for Tropical Diseases-Prone Areas: A Case
Study of East Java Province, Indonesia
Anik Vega Vitianingsih, Dwi Cahyono, Achmad Choiron Informatics Department Universitas Dr. Soetomo Surabaya-Indonesia
[email protected], [email protected], [email protected]
Abstract— Analysis and design system in this paper is used to model Web-Geographical Information System (Web-GIS). The results can be used to create Web-GIS applications that are able to identify prone-areas to tropical diseases in East Java of Indonesia, using Multi-Attribute Utility Theory (MAUT). This Web-GIS information system includes the distribution of the affected areas, endemic areas, epidemiological inquiry and tropical diseases-free areas. Web-GIS analysis process consists of: describing requirements system, outlining the need of spatial data (layers) and attribute data tables, create a process model with tiered diagram and data flow diagram that describe the process flow of a Web-GIS system. System design process by making Conceptual Data Model (CDM) serves to describe the needs of spatial data and attribute data in a database system. CDM is generated and produces Physical Data Model (PDM). PDM contains the metadata structures of the spatial data and attribute data that will be processed and stored in the Web-GIS application program. Geoprocessing Layers are implementation of the analysis process and design system, processing layer by buffering, union, and intersection layer techniques. The layer is generated from geoprocessing and processed by entering parameters in MAUT method to result the identification of tropical diseases prone areas.
Keywords—Web-GIS, System Analysis, System Design,
Tropical Disease, MAUT Method.
I. INTRODUCTION
East Java Province is a tropical region with average temperature between 21 - 34oC and average annual rainfall of
1,900 mm [1]. With these climatic conditions, East Java Province is prone to tropical diseases such as Tuberculosis, Diphtheria, Pertussis, Tetanus neonatorum, Leprosy, Dengue Haemorrhagic Fever (DHF), Measles, HIV-AIDS, Malaria, Filariasis [2]. The society nowadays are still difficult to get information about the number of incidents of tropical diseases, because the information generated is still limited to annual data recorded in the form of data tables and analog maps. The data includes the number of cases of people with tropical diseases, death rates, cure rates, percentage of patients and extra-ordinary events [1]. In order to support health sector development through Dinas Kesehatan, there is a need of accurate data and information with digital mapping system to be used in the
decision-making process and program planning to reduce the spread of the diseases.
In East Java, which is one of Indonesia’s tropical regions, many emerging tropical climatic diseases arrive during transitional season. Tropical disease refers to infectious diseases caused by bacteria, viruses, and parasites that thrive in the tropics. Tropical disease is almost uncontrollable which is characterized by the number of extraordinary events in recent years. The disease caused by several factors of transmission such as parasitic factors (agent) and host factors. The long dry season and heavy precipitation events greatly influence the formation of breeding grounds for disease agents [1].
Regional susceptibility to tropical diseases in East Java is determined based on outbreak data on certain types of the diseases in 3 (three) consecutive years. Category of the Endemic area applied to a region if there are tropical disease events in 3 (three) consecutive years, category of a sporadic area in case of non-consecutive events in three years (annual data scale), and potential area for certain disease types if there is no occurrence in the last 3 years [1]. The classification ofendemic levels is not associated with the number of cases.
In recent times, the map of regional distribution based on the level of susceptibility to the tropical diseases already exists. However, the map is only based on the diseases occurrence in the last year, mapping by combining data intensity and diseases frequency has not been done. Information about the area distribution based on the level of susceptibility is necessary to determine priority areas for the implementation of anticipatory and prevention programs by the Public Health Services[3,4].
information system and cross-sector. Article 169 mentions that the government shall provide convenience to the public to gain access to health information in order to improve public health status [1].
Based on the research that the authors did, the use of Geographical Information System (GIS) and Web-GIS technology can perform spatial analysis and temporal analysis. It has the capability to produce an integrated analysis covering all aspects [3]. Map showing the regional distribution of the diseases is useful for the empirical study of the relationship between climate, weather and other diseases or other health problems that are useful to implement the intervention plan [5].
The purpose of this research is to develop the Geographic Information System Web-GIS which can map information about the distribution of tropical diseases affected areas in East Java. The result shows that tropical diseases-prone area can be identified based on the data intensity of tropical diseases such as the type of residential area, population density, puddle type, air temperature, average rainfall, air humidity, the number of health facilities and the diseases frequency[6,7]. Web-GIS modeling system uses Multi Attribute Utility Theory (MAUT) to display the mapping analysis by determining the weight value and priority value for each parameter [8].
Web-GIS GIS system is expected to help people to be aware and live a healthy lifestyle to avoid the danger of tropical diseases and also for East Java Provincial Health Office as the decision-maker to do the planning, prevention, and eradication of tropical diseases to some areas with extraordinary events.
II. RESEARCH METHODOLOGY
A. System Requirement Analysis
The analysis of system requirements explore the needs of spatial data (layer) and data attributes (database) that will be used as the basis of analysis and system design. Analysis of system requirements includes a real system, evaluation and the study of data feasibility by describing the form of Web-GIS to be created [9]. Analyzing the need for spatial data and attribute data that will be used to process the system and determine the data flow for database design by depicting it into a tiered Diagram and Data Flow Diagrams (DFD).
In this research, the output model of Web-GIS requirement analysis is data availability of tropical disease in East Java Province, multiplying the supporting parameters that will be used as a reference to determine tropical diseases-prone areas and perform the process of analysis and design of application system to a database system. As the results shows in Table 1 below,
Table I. Output Model of System Requirement Analysis
Type Output
Literature
Studies
-
Concept of Web-GIS-
GIS technology Field Studies-
User requirement-
Organizational initialization-
Observe the scope of the research InformationRequirements
-
Spatial data requirements (layer)-
Attribute data requirements (database table)Type Output
System Analysis
-
Description of GIS-
System process flow-
Analysis of spatial data and attribute data-
Parameter analysis of spatial data layer and attribute data by making a tiered Diagram of the DFD system process-
User Interface Design Database SystemDesign
- Spatial data and attribute data with CDM (Conceptual Data Modelling), PDM (Physical Data Modelling) and Star Schema
- Geoprocessing Layer (Buffer, Union, and Intersect Layer)
- Layer design with MAUT method - Database design is completed
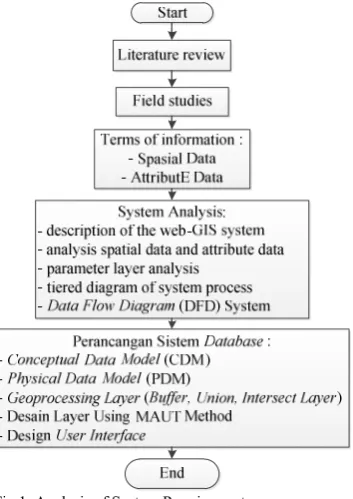
Database system design is performed by designing Conceptual Data Model (CDM), Physical Data Model (PDM), Geoprocessing Layer (Buffer, Union, and Intersect Layer), Layer Design with MAUT method and User Interface Design. As shown in Figure 1 and Table 1 below,
Fig.1. Analysis of System Requirements
B. Geoprocessing Layer With MAUT Method
Type of decision making in GIS involves several viable alternatives and interrelated evaluation criteria called multi-criteria decision making (MCDM). GIS-based multi-multi-criteria decision analysis is a process to combine and transform spatial data into a result decision, in which the ability of GIS are data acquisition, storage, search, manipulation and spatial analysis. The use of MCDM is to combine geographic data and preferences for the decision-maker to determine alternative values [10].
determines the relationship between input map and output map [11].
Multi-attribute utility theory (MAUT) method used to calculate the overall value of the choice alternative on a sub-criterion. The form of the representation theorem for some attribute value function is determined by the set of conditions for the decision-maker, with the formula as follows [8]:
( 1, 2, … ) = ∑ ( ) (1) In which vi (xi) is function value for attribute i, ki is the attribute parameter and i based on the uncertainty relation between the attributes.
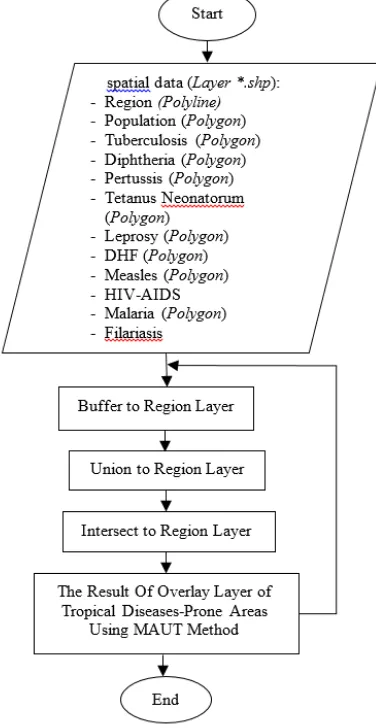
Geoprocessing layer processed by digitizing an analog map to insert all attribute data, parameters, and criteria stored in the form of a Shapefile (*.shp) which will become a layer. Then the buffer process will be performed to the layer to create polygons from the layer area, after the buffer layer is formed then the main layer data and the region layer will be merged. The layer generated from the merging process will produce some outer layer coverage beyond the actual layer range, remove it using intersect process to create overlay layer result. The process of geoprocessing layer is as shown in Figure 2 and Table II below,
Fig. 2. Geoprocessing Layer
Table II. Output Model of Geoprocessing Layer
Type Output
System
Implementation
-
Database connection application program (Microsoft SQL Server Management Studio)-
System framework implementation (Arc GIS API 3.2 for Silverlight dan Arc GIS Viewer for Silverlight)-
Implementation of GIS (ArcGIS Desktop 10.2 danArcGIS Server 10.2)
-
Coding programming-
Menu design of application program-
Coding application program with PHP EvaluationSystem
Prototype improvements to check the program that has been made based on the expected solution
Documentation
System
-
System reports-
Data reports-
Program file reportC. Building Prototype of GIS System
Prototype of Web-GIS system is formed from the results of geoprocessing layer, the layer then connected to the SQL Server database to form the attribute data table as a link between the spatial data and attribute data. In this research, GIS prototype is built in the form of Web-based GIS or referred to as Web-GIS system. Web servers are used to connect spatial database and attribute database in Web-GIS system using ArcGIS Desktop 10.2 and ArcGIS Server 10.2. The implementation of system prototype is using ArcGIS API 3.2 for Silverlight and ArcGIS Viewer for Silverlight with PHP/Hypertext Preprocessor programming.
System evaluation performed through trial and error process, and the final stage is performed by making the documentation system. The flowchart of GIS system prototyping shown in Figure 3 below,
The output model to build GIS prototype is the availability of spatial data analysis’ result and attribute data with MAUT method in the form of overlay layer produced from digitization process, buffer, union, and intersect layer. The results are shown in TableIII below,
Table III. The Output Model to Build GIS Prototype
Type Output
Implementation of
Spatial Data (Layer)
-
Digitization of all spatial data layers-
All layers have been digitized (*.shp) Implementation of LayerAnalysis
-
Process of buffer layer, union layer, and intersect layer Result of analysis usingMAUT method
-
The results of overlay layer of areas prone to tropical diseases-
The overlay layer is ready to use in Web map applicationIII. RESULT AND DISCUSSION
The design of this web-GIS application required analysis of spatial data and attribute data to be used in every process in the system. The correct analysis and process will result in a decision support system that capable of explaining logic and transforming from input data to output data.
A. Proses Model
Process model aims to clarify and demonstrate a process in the business flow on this web-GIS system, the system are expected to run in accordance with the procedures and processes described in the tiered diagram in Figure 4 below,
Fig. 4. The process model of Tropical Disease Web-GIS System
This research produce system analysis and system design for the process of designing prototype using data availability (1) Each district in East Java Province (2) Population per district (3) Affected areas, distribution and endemic areas on a case-by-year basis, case by age group and case by sex, (4) Epidemiological investigation of total patients with tropical diseases and (5) Parameters of areas prone to tropical disease; the intensity of the tropical disease, type of residential area, population density, puddle type, air temperature, average rainfall, air humidity, the number of health facilities and the frequency of tropical diseases in the area.
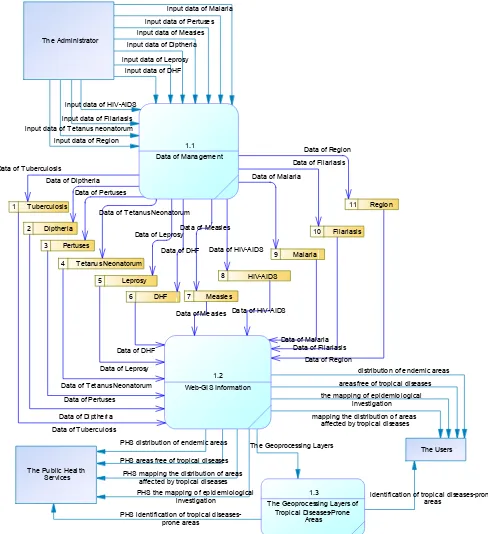
B. Data Flow Diagram (DFD)
DFD is used for the development of structured systems where the data flow and the data will be stored. It can describe the flow of data in the system with a structured. Besides, DFD is a good documentation system. The analyst process to describe the flow of DFD is using the device from the power designer that
allows users to present the process in the context diagram information system as shown in Figure 5 below,
Fig. 5. Context Diagram of Tropical Diseases Web-GIS system
The system process in Figure 4 is where the spatial data of the *.shp layer and spatial data table of Region, Population, Tuberculosis, Diphtheria, Pertussis, Tetanus neonatorum, Leprosy, Dengue Haemorrhagic Fever (DHF), Measles, HIV-AIDS, Malaria, and Filariasis are entered by admin to web-GIS system. The system then will be processed to produce information distribution of areas affected by tropical diseases, the process of distribution of areas free of tropical diseases, process of endemic areas of tropical diseases, epidemiological investigation process and information on tropical diseases prone areas for external entities users and health department as policymakers. The next process is to decompose the process to explain the next process of DFD level as shown in Figure 6 below,
Fig. 6. DFD Level of Tropical Diseases Web-GIS System
data of HIV-AIDS
data of Malaria
data of T uberculosis data of Measles
data of Tetanus Neonatorum data of DHF
data of Diptheria
data of Filariasis
data of Pertuses data of Leprosy
data of Region
mapping of the distribution areas affected by tropical diseases
PHS free areas of tropical diseases distribution of endemic areas
PHS mapping of the distribution areas affected by tropical diseases
PHS identification of tropical diseases-prone areas
PHS the mapping of epidemiological investigation PHS distribution of endemic areas identification of tropical diseases-prone
areas free areas of tropical diseases
the mapping of epidemiological investigation
1
Web-GIS Identification of T ropical Diseases-Prone Areas T he Administrator
T he Users
The Public Health Services
i nput data of Leprosy i nput data of DHF input data of Di ptheri a
i nput data of Mal aria input data of Measl es
i nput data of Tetanus neonatorum i nput data of Fil ariasis input data of Region
input data of Pertuses
i nput data of HIV-AIDS Data of Tuberculosi s
Data of Diptheria Data of Pertuses
Data of Tetanus Neonatorum Data of Leprosy
Data of DHF Data of Measles
Data of HIV-AIDS Data of Malari a
Data of Fi lariasi s Data of Region
Data of T uberculosis Data of Di ptheri a Data of Pertuses Data of T etanus Neonatorum
Data of Leprosy
Data of Measles Data of DHF
Data of HIV-AIDS Data of Mal aria
Data of Fi lariasis Data of Region
The Geoprocessi ng Layers
distribution of endemi c areas mapping the di stri buti on of areas
affected by tropical diseases the mapping of epi demiol ogical
i nvesti gati on areas free of tropi cal diseases
PHS identifi cati on of tropical diseases-prone areas PHS di stribution of endemic areas
PHS the mappi ng of epidemiological investigation PHS areas free of tropi cal diseases
PHS mapping the distribution of areas affected by tropical diseases
i dentification of tropi cal diseases-prone areas The Admi ni strator
The Users The Public Heal th
Services
1.1 Data of Management
1.2 Web-GIS Information
1.3 T he Geoprocessing Layers of
Tropical Diseases-Prone Areas 1 Tubercul osi s
2 Diptheria 3 Pertuses
4 Tetanus Neonatorum 5 Leprosy
6 DHF 7 Measles 8 HIV-AIDS
9 Mal aria 10 Fil ariasis
DFD Level in Figure 6 explains:
a. Process 1.1 data management is used to process spatial data of *.shp and attribute data table *.mdb, the data obtained from the East Java Provincial Health Office will be entered into the system web-GIS by admin, including the attributes that will be used in the system;
b. Process 1.2 web-GIS information. There are four information processes that will be delivered by the system to the public, and also to the policy makers of East Java Provincial Health Office. The system obtained from the process of data management 1.1, including the process of distribution of areas affected by tropical diseases, the process of distribution of areas free of tropical diseases, the process of endemic areas of tropical diseases and the process of epidemiological inquiry.
c. Process 1.3 geoprocessing layer processes to identify tropical disease prone areas based on the data of tropical disease intensity such as the type of residential area, population density, type of inundation, air temperature, average rainfall, air humidity, number of health facilities and the frequency of incidence of tropical disease using MAUT method.
C. Conceptual Data Model (CDM)
Each of these internal entities on web-GIS comes with attributes that presents all the facts of the built database. The entity on this CDM is the data processed in Figure 5.4. The entire spatial data and attribute data is automatically generated when creating a geodatabase in Arcmap software which then integrates with Microsoft SQL Server 2008 R2 as shown in Figure 7 below,
Fig.7. Conceptual Data Model of Tropical Diseases Web-GIS System
Figure 7 is a design of a CDM system that maps the needs of tables and attributes which will be used in database creation on the creation of spatial layer data. The data attributes of Web-GIS system tables are identify areas prone to tropical diseases, including:
1. Region, which includes the name of the region, region size, the number of the sub-districts, the number of the villages, total number of villages and urban community, year, number of puskesmas (community health center), number of the population, households, live births of men, stillbirths of men, number of women births, number of women stillbirths, total births of men, total deaths of men, total female births and total deaths of women.
2. Tuberculosis, which includes the number of new male cases, the percentage of new male cases, the number of new female cases, the percentage of new female cases, total number of new cases, total number of male cases, percentage of total men cases, total number of women cases, percentage of total women cases, number of cases on children aged 0-14, percentage of cases on children aged 0-14, BTA+ treated in men, BTA+ treated in women, total BTA+ treated, male healing rate, the percentage of male healing rate, female healing rate, the percentage of female healing rate, total number of healing rate, total percentage of healing rate, full medication rates in male, percentage of full medication rates in male, full medication rates in female, percentage of full medication rates in female, total of full medication rates, total percentage of full medication, number of medication success in male, number of medication success in female, total number of medication success, number of deaths during medication in male, number of deaths during medication in female and total deaths during medication. 3. Diphteria, which includes male suspects, female suspects,
total suspects and total deaths
4. Pertussis, which includes male suspects, female suspects and total suspects
5. Tetanus Neonatorum, which includes tetanus non neonatorum male suspects, tetanus non neonatorum female suspects, total suspects of tetanus non neonatorum, total deaths of tetanus non neonatorum, tetanus neonatorum male suspects, tetanus neonatorum female suspects, total number of tetanus neonatorum suspects and total deaths of tetanus neonatorum
6. Leprosy, which includes new cases of pausi basiler of men, new cases of pausi basiler of women, total new cases of pausi basiler, new cases of multi basiler of men, new cases of multi basiler of women, total new cases of multi basiler, total number of new cases of pausi basiler and multi basiler of men, total number of new cases of pausi basiler and multi basiler of women, total new cases of pausi basiler and multi basiler, total cases of leprosy on children aged 0-14 years, the percentage of new cases of lepers aged 0-14 years, the number of new cases of second-level disability, the percentage of new cases of second-level disability, the prevalence of pausi basiler on men, the prevalence of pausi basiler on women, the total prevalence of pausi basiler, the prevalence of multi basiler on men, the prevalence of multi basiler on women, total prevalence of multi basiler, total prevalence of pausi basiler and multi basiler on men, total prevalence of pausi basiler and multi basiler on women, total prevalence of pausi basiler and multi basiler, male patients of pausi basiler, female patients of pausi basiler, total number of pausi basiler patients, RFT number of pausi basiler on
wilayah
regi on_m easles region_malaria n_kem atian_selam a_pengobatan_L n_kem atian_selam a_pengobatan_P t_kematian_selama_pengobatan Identifi er_1 <pi> T etanus_Neonatorum Identi fier_1 <pi>
Leprosy n_kasus_baru_penderi ta_kusta_Usi a_0-14_tahun %_kasus_baru_penderita_kusta_Usia_0-14_tahun
Identifi er_1 <pi> DHF Identifi er_1 <pi> M easles t_%_bayi_im unisasi_cam pak %t_%_bayi_imunisasi_campak
<pi > Integer Integer Variable characters (100) Fl oat Variable characters (15) Variable characters (15) Variable characters (15) Variable characters (15) Integer Integer Integer
men, RFT percentage of pausi basiler on men, RFT number of pausi basiler on women, RFT percentage of pausi basiler on women, total RFT of pausi basiler, total RFT percentage of pausi basiler, male patients of multi basiler, female patients of multi basiler, total patients of multi basiler, RFT number of multi basiler on men, RFT percentage of multi basiler on men, total RFT of mulit basiler, RFT percentage of multi basiler on women, total RFT of multi basiler and total RFT percentage of multi basiler.
7. DHF, which includes cases of male DHF, female DHF cases, total cases of DHF, DHF cases of male deaths, DFH cases of female death, total death of DHF cases, percentage of CHF DHF on men, percentage of CFR DHF on women, and total percentage of CFR DHF.
8. Measles, which includes male suspected patients, female suspected patients, total suspected patients, number of measles immunization on male, percentage of infant immunization against measles on male, number of measles immunization on female, percentage of infant immunization against measles on female, total of baby measles immunization, total percentage of baby measles immunization.
9. AIDS, which includes positive male, HIV-positive female, total HIV, HIV proportion, AIDS on male, AIDS on female, total AIDS, AIDS proportion, number of AIDS deaths on male, number of HIV-AIDS deaths on female, total HIV-HIV-AIDS deaths.
10.Malaria which includes male suspects, females suspects, total malaria suspects, male deaths, female deaths, total deaths, percentage of male CFR, percentage of female CFR and total CFR percentage.
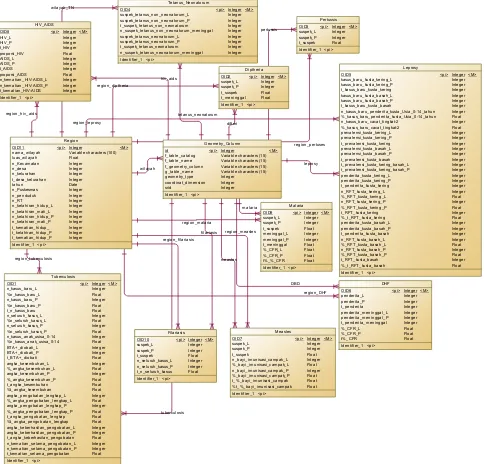
D. Physical Data Model (PDM)
PDM is a generated ERD from CDM that aims to analyze the tables needed on tropical disease web-GIS. All the layers are connected to the geometry entity column so that the OID appears to be the foreign key of each entity as shown in Figure 8 below,
Fig.8. Generate Data from CDM to PDM
IV. CONCLUSION
The result of database design formed from spatial data and attribute data that identified by doing the process of: (1) Geoprocessing layer, (2) Digitization of the layer which is then processed into buffer, union, and intersect process to generate overlay layer and (3) Overlay layer using MAUT method has formed with connection to database. After the layer of geoprocessing results has formed, the programming is given to the layer to generate a prototype of Web-GIS which is ready for use. The final stage is to make sure that Web-GIS system is perfect by evaluating the system through trial and error process.
ACKNOWLEDGMENT
This paper is the result of the first year of Competitive is an Applied Product Research funded by Kopertis Region VII, East Java, by Ministry of Education and Culture, in accordance with the Agreement on Research Grant Implementation of the Private University Faculty Members– Kopertis VII in 2017, Number 005/SP2H/K2/KM/2017, on Mei 4nd, 2017. The result
of the mapping will be a reference for further research in 2018 using web-GIS technology.
REFERENCES
[1] “Profil Kesehatan Jawa Timur 2011-2015”, Dinas Kesehatan Provinsi Jawa Timur 2013-2016
[2] Widoyo, “Penyakit tropis, epidemiologi, penularan, pencegahan dan pemberantasannya”, Penerbit Erlangga, 2005
[3] Anik Vega Vitianingsih, Dwi Cahyono, Achmad Choiron, “Web-Geographic Information System Modelling For Tropical Diseases-Prone Areas: A Case Study Of East Java Province”, Proceeding International Conference Enhancing Multidisciplinary Research And Innovation For Indonesia’s Future, ISBN 978-602-70736-8-6, pp.21, 2017
[4] Hui Luan, Jane Law, “Web GIS-Based Public Health Surveillence System Asystematic Review”, Journal Of Geo-Information, ISSN 2220-9960,3,pp481-506, 2014
[5] Tromp. S.W. Biometeorology, “The Impact of the Weather and Climate on Humans and their Environment (Animal and Plant)”, Heyden & Sons Ltd. London. 1980.
[6] Seng, S.B., Chong, A.K., and Moore, “A.Geostatistical Modelling, Analysis and Mapping of Epidemiology of Dengue Fever in Johor State, Malaysia”, The 17th Annual Colloquium of the Spatial Information Research Centre University of Otago, Dunedin, New Zealand, 2005 [7] Weber M, Borcherding K., “Behavioral influences on weight judgments in
multiple attribute decision making”. European Journal of Operational Research, 67:1–12, 1993
[8] M. Wang, S.-J. Lin, Y.-C. Lo, “The comparison between MAUT and PROMETHEE”, Industrial Engineering and Engineering Management (IEEM), 2010 IEEE International Conference, pp. 753-757, 2010. [9] Malczewski J., “GIS-based land-use suitability analysis: a critical
overview”, Progress in Planning, 62(1), pp. 3–65, 2004
[10]Nijkamp P. “Multidimensional spatial data and decision analysis”, Wiley, Chichester, West Sussex, 1979
[11]Chakhar S. and V. Mousseau, “Spatial multicriteria decision making”, In: Shehkar S. and H. Xiong, Eds.Encyclopedia of GIS, Springer-Verlag. New York, pp. 747–753, 2008.
FK_T BL_GEOM_WILAYAH_ TBL_ REGI FK_T BL _PERT _PERTUSSIS_T BL_GEOM FK_T BL_DIPT _DIFT ERI_T BL_GEOM FK_T BL_T UBE_T UBERCULO_ TBL_ GEOM
FK_T BL_HIV_ _HIV_AIDS_ TBL_ GEOM
FK_T BL _FILA_FILARIASI_ TBL_ GEOM FK_T BL _T ET A_T ETANUS_N_T BL _GEOM
FK_T BL_LEPR_LEPROSY_ TBL_ GEOM FK_T BL_DHF_DBD_ TBL_ GEOM
FK_T BL_MALA_MALARIA_T BL_GEOM
FK_T BL _MEAS_MEASL ES_T BL_ GEOM FK_ TBL_ TUBE_REGION_T U_ TBL_ REGI
FK_ TBL_ MEAS_REGION_ME_ TBL_ REGI
FK_T BL_MALA_REGION_MA_ T BL _REGI
FK_T BL_DHF_REGION_DH_ TBL_ REGI
FK_ TBL_ FILA_REGION_ FI_ TBL_ REGI FK_T BL_LEPR_REGION_ LE_T BL_REGI
FK_T BL _T ET A_WILAYAH_T _T BL_REGI
FK_ TBL _HIV__REGION_HI_T BL _REGI
FK_ TBL_ DIPT _REGION_ DI_T BL_REGI
FK_T BL _PERT _REGION_PE_T BL _REGI T ub ercul osi s
OID1 OID1 1 id n_ka sus_b aru _L %n_kasus_ba ru _L n_ka sus_b aru _P %n_kasus_ba ru _P t_ n_kasus_ba ru n_se luruh _kasu s_L %n_sel uruh_ kasus_L n_se luruh _kasu s_P %n_sel uruh_ kasus_P n_ka sus_a nak_u sisa_0-14 %n_kasus_an ak_u sisa _0-14 BT A+_ dio bati_ L BT A+_ dio bati_ P t_ BT A+_d iob ati angka_kesembuha n_L %_ang ka_ke sembuha n_L angka_kesembuha n_P %_ang ka_ke sembuha n_P t_ angka _kese mbuhan %t_a ngka _kese mb uhan angka_pe ngoba ta n_l engkap_L %_ang ka_pe ngob ata n_l engkap_L angka_pe ngoba ta n_l engkap_P %_ang ka_pe ngob ata n_l engkap_P t_ angka _pen goba tan _l engka p %t_a ngka _peng obatan _le ngkap angka_keb erhasi la n_pe ngob ata n_L angka_keb erhasi la n_pe ngob ata n_P t_ angka _keb erh asi lan _pen goba tan n_ke ma ti an_ sel ama_pe ngob ata n_L n_ke ma ti an_ sel ama_pe ngob ata n_P t_ kematia n_sel ama_ peng obatan
i nt t_meni ngga l
in t suspek_te ta nus_n on_n eona torum_L suspek_te ta nus_n on_n eona torum_P t_su spek_ te tan us_no n_ne onatorum n _susp ek_tetanus_non _neo natoru m_meni ngga l suspek_te ta nus_n eona torum_L suspek_te ta nus_n eona torum_P t_su spek_ te tan us_ne onatorum n _susp ek_tetanus_neo natorum_meni ngg al
in t kasu s_baru_kusta_keri ng_L kasu s_baru_kusta_keri ng_P t_ kasus_baru_ku sta _keri ng kasu s_baru_kusta_ba sah_L kasu s_baru_kusta_ba sah_P t_ kasus_baru_ku sta _basah n_ka sus_b aru _pen derita_kusta_Usi a_0-14_ ta hun %_kasu s_baru_ pende ri ta_kusta_ Usia_ 0-14_tahu n n_ka sus_b aru _cacat_ ti ngkat-2 %_kasu s_baru_ cacat_ti ngkat-2 prevale nsi _kusta_keri ng _L prevale nsi _kusta_keri ng _P t_ pre va len si_ kusta_ke ri ng prevale nsi _kusta_b asah _L prevale nsi _kusta_b asah _P t_ pre va len si_ kusta_b asah t_ pre va len si_ kusta_ke ri ng_ basa h_L t_ pre va len si_ kusta_ke ri ng_ basa h_P pend erita_ku sta _kerin g_L pend erita_ku sta _kerin g_P t_ pend eri ta_kusta_ kerin g n_RFT _ku sta _kerin g_L %_RFT _kusta_keri ng _L n_RFT _ku sta _kerin g_P %_RFT _kusta_keri ng _P t_ RFT_ kusta_ke ri ng %_t_ RFT_ kusta_ke ri ng pend erita_ku sta _basa h_L pend erita_ku sta _basa h_P t_ pend eri ta_kusta_ basa h n_RFT _ku sta _basa h_L %_RFT _kusta_b asah _L n_RFT _ku sta _basa h_P %_RFT _kusta_b asah _P t_ RFT_ kusta_ba sah %_t_ RFT_ kusta_b asah
i nt t_pe nderi ta p ende ri ta _meni ngg al_ L p ende ri ta _meni ngg al_ P t_pe nderi ta _meni ngga l %_CFR_ L n_ bayi_ imun isa si_ ca mp ak_L %_ba yi _i muni sasi _campak_L n_ bayi_ imun isa si_ ca mp ak_P %_ba yi _i muni sasi _campak_P t_%_ba yi _i muni sasi _campak %t_%_bayi _i mu ni sasi _campak in t n_ke ma ti an_ HIV-AIDS_ L n_ke ma ti an_ HIV-AIDS_ P t_ kematia n_HIV-AIDS
i nt t_meni ngga l %_CFR_L
<fk1 > Fil aria sis OID10 n _sel uruh_kasus_ L n _sel uruh_kasus_ P t_n_ sel uruh_ka sus in t nama_wi la ya h lua s_wil ayah n_Kecamatan n_de sa n_kel uraha n t_d esa_ kel ura han tah un n_Puske smas n_pe ndudu k n_RT n_kel ah iran_h id up_L n_kel ah iran_ma ti _L n_kel ah iran_h id up_P n_kel ah iran_ma ti _P t_kematian _hi dup_ t_kela hi ran _hi dup_ P t_kematian _hi dup_ P i nt