Greenhouse Gas Emissions from Cattle Production Sector in South Korea
Febrisiantosa A1,2, Lee JH1, Choi HL1,2
1Department of Agricultural Biotechnology and Research Institute for Agricultural and Life
Science, Seoul National University, Seoul, Republic of Korea, 151-742.
2Research Unit for Natural Product Technology, Indonesian Institute of Sciences,
Jl. Jogja Wonosari km 32, Gading Playen, Gunungkidul, Yogyakarta, Indonesia
2Resourcification Research Center for Crop-Animal Farming (ReCAF), Gwanak-gu, Seoul. S. Korea
E-mail: [email protected]
(received 22-04-2016; revised 10-05-2016; accepted 29-06-2016)
ABSTRAK
Febrisiantosa A, Lee JH, Choi HL. 2016.Emisi gas rumah kaca dari sektor produksi ternak di Korea Selatan. JITV 21(2): 112-123. DOI: http://dx.doi.org/10.14334/jitv.v21i2.1359
Negara Korea Selatan menyatakan akan mengurangi emisi gas rumah kaca sebanyak 30% dari level emisi saat ini pada tahun 2020. Penelitian ini dilakukan untuk mengevaluasi emisi gas rumah kaca dari sektor produksi sapi potong di Korea Selatan. Emisi gas rumah kaca dari aktivitas produksi sapi perah, sapi lokal Non-Korea dan sapi lokal Korea (Hanwoo) di 16 provinsi Korea Selatan selama sepuluh tahun (2005-2014) diestimasikan menggunakan metode khusus berdasarkan Guidelines for National Greenhouse Gas Inventory of the IPCC (2006). Emisi yang dievaluasi dalam penelitian ini meliputi gas metan dari fermentasi enterik, gas metan dari pengelolaan kotoran, oksida nitrat dari pengelolaan kotoran dan karbon dioksida dari penggunaan energi secara langsung. Lebih dari 10 tahun terakhir, aktivitas produksi sapi Hanwoo merupakan penyumbang utama (83.52% dari total emisi sektor produksi ternak sapi) CH4 dari fermentasi enteric, CH4 dari pengelolaan kotoran, NO2 dari pengelolaan kotoran dan NO2 dari penggunaan energi secara langsung pada sektor peternakan sapi di Korea Selatan.
Kata Kunci: Metan, Oksida Nitrat, Karbondioksida, Sapi, Pemanasan Global
ABSTRACT
Febrisiantosa A, Lee JH, Choi HL. 2016.Greenhouse gas emissions from cattle production sector in South Korea. JITV 21(2): 112-123. DOI: http://dx.doi.org/10.14334/jitv.v21i2.1359
South Korea has declared to reduce greenhouse gas emissions by 30% compared to the current level by the year 2020. The greenhouse gas emissions from the cattle production sector in South Korea were evaluated in this study. The greenhouse gas emissions of dairy cattle, Non-Korean native cattle and Korean native (Hanwoo) cattle production activities in 16 local administrative provinces of South Korea over a ten-year period (2005–2014) were estimated using the methodology specified by the Guidelines for National Greenhouse Gas Inventory of the IPCC (2006). The emissions studied herein included methane from enteric fermentation, methane from manure management, nitrous oxide from manure management and carbon dioxide from direct on-farm energy use. Over the last ten years, Hanwoo cattle production activities were the primary contributor of CH4 from enteric fermentation, CH4 from manure management, NO2 from manure management and CO2 from on-farm energy use in the cattle livestock sector of South Korea, which comprised to 83.52% of total emissions from cattle production sector.
Key Words: Methane, Nitrous Oxide, Carbon Dioxide, Cattle, Global Warming
INTRODUCTION
Greenhouse gas (GHG) emissions from human activities become a focus of worldwide attention because of global warming issues. With global warming, the equilibrium of ecosystems is threatened by climate change. The agricultural sector contributes 18% (7.1 billion tonnes CO2 equivalent) to the total global greenhouse gas emissions (FAO 2006). Although agricultural activity contributes only 9% to global CO2 emissions, agriculture generates 65% of human-related nitrous oxide (N2O) and 35% of methane (CH4) with global warming potentials (GWPs) of 298-fold and
Production of cattle is an important part of economic growth of the livestock industry as it meets the increasing demand of meat and milk products. However, along the production, greenhouse gases are emitted. Few studies have estimated GHG emissions from livestock sector that follow the IPCC guidelines. Merino et al. (2011) inventoried the regional methane and nitrous oxide emissions from ruminant livestock in Basque country, and Patra (2014) studied the trends and projected estimation of GHG emissions from Indian livestock in comparison with the global GHG emissions and those from developing countries. In South Korea, Ji & Park (2012) found that the annual growth rates of enteric CH4 emissions and CH4 and N2O emissions from manure management from 1990 to 2009 were 1.7%, 2.6% and 3.2%, respectively. Lee & Lee (2003) investigated national methane emissions from the enteric fermentation of livestock, and Jo et al. (2015) estimated methane emissions factor from enteric fermentation of Hanwoo steers. Amon et al. (2006) estimated GHG emissions from different management system of dairy cattle. In South Korea, Korean native (Hanwoo) cattle population is already be distinguished from the other beef producing cattle breed population. Other source of beef production is the dairy cattle steers which is categorized as Non-Korean native cattle. However, the information has not been obtained for recent GHG emissions from cattle production activities in South Korea. Therefore, the aim of this study was to estimate the emissions of greenhouse gases from the cattle production sector, including estimates for on-farm energy use, in South Korea.
MATERIALS AND METHODS
Scope and activity data
This study focused on three primary emission sources in cattle production activities: Emissions from
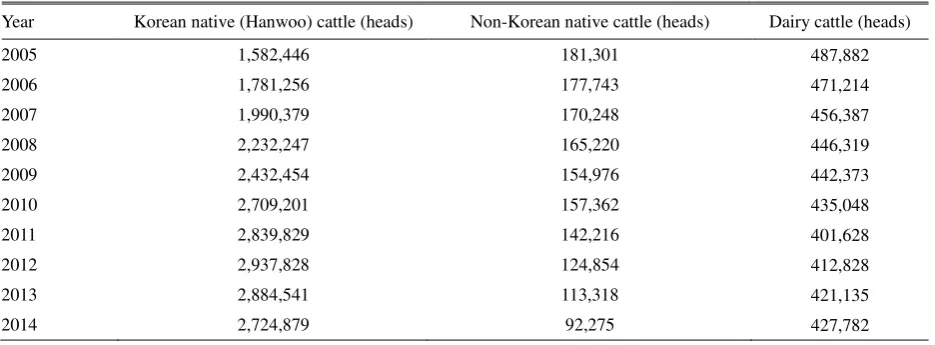
enteric fermentation, emissions from manure management, and emissions from direct on-farm energy use. Methane was emitted from enteric fermentation and manure management, nitrous oxide from manure management and carbon dioxide from on-farm energy use. Data of livestock populations in South Korea were adopted from the Korean Statistical Information Services. Populations of cattle were based on the average of each annual quartile. Cattle population data between 2005 and 2014 are shown in Table 1. The cattle were divided into three categories (breed, age and sex). The breed category was divided into three subcategories (Hanwoo, beef, and dairy cattle), the age category was divided into three subcategories (under 1 y, 1-2 y, and over 2 y), and the sex was divided into two subcategories (male and female), except for the dairy cattle. The population estimates are presented for 16 local administrative provinces in South Korea.
Estimation of greenhouse gas emissions
Current assessment used a methodology specified in the Guidelines for National Greenhouse Gas Inventory (IPCC 2006) and the Greenhouse gas emissions from ruminant supply chains (Opio et al. 2013). The emissions were assessed in 16 local administrative provinces of South Korea. Global Warming Potentials (GWPs), based on the 4th Assessment Report of the IPCC (IPCC 2006), were used to convert N2O and CH4 values to CO2-eq values. Consequently, the GWPs of 25 and 298 were used for CH4 and N2O, respectively.
Approaches used to estimate the emissions from cattle production were Tier-1 and Tier-2 methods in the IPCC guidelines. In this study, the different value of enteric fermentation factor was used for Hanwoo and Non-Korean native cattle since Korea has different category of beef production cattle. Default emission factors for the Tier-1 method were provided by the IPCC (2006). For some approaches using Tier-2
Table 1. Cattle population in South Korea (2005-2014)
Year Korean native (Hanwoo) cattle (heads) Non-Korean native cattle (heads) Dairy cattle (heads)
Table 2. Approaches to estimate GHG emissions from cattle production in South Korea (2005-2014)
Emission sector Korean native
(Hanwoo) cattle
Non-Korean native cattle
Dairy cattle
CH4 emissions from enteric fermentation Tier-2 Tier-2 Tier-2
CH4 emissions from manure management Tier-2 Tier-2 Tier-1
N2O emissions from manure management Tier-1 Tier-1 Tier-1
CO2 emissions from direct on-farm energy use for livestock Tier-1 Tier-1 Tier-1
method, country-specific information was required. The estimations of emission factors for the Tier-2 method were adopted from the IPCC guidelines. Characteristics of the approaches used to estimate GHG emissions for cattle production are shown in Table 2. The estimation was conducted in 3 steps. In step 1, cattle population was classified into subgroups and each subgroup was characterized. In step 2, emission factor was estimated for each subgroup in kilograms of gas emission per animal per year.
In step 3, to estimate the emissions for the different subgroups, the emission factors of each subgroup were multiplied by the population size of that subgroup; the emissions of the subgroups were then summed to estimate total emission.
RESULTS AND DISCUSSION
CH4 emission from enteric fermentation
Cattle consume organic matter that is degraded by rumen microbes with the production of CH4 as a final product of metabolism; thus, enteric fermentation in cattle is a source of CH4 emission. Tier-2 method was used in this estimation. Tier-2 methodology is more appropriate than the Tier-1 (Höglund-Isaksson 2012).
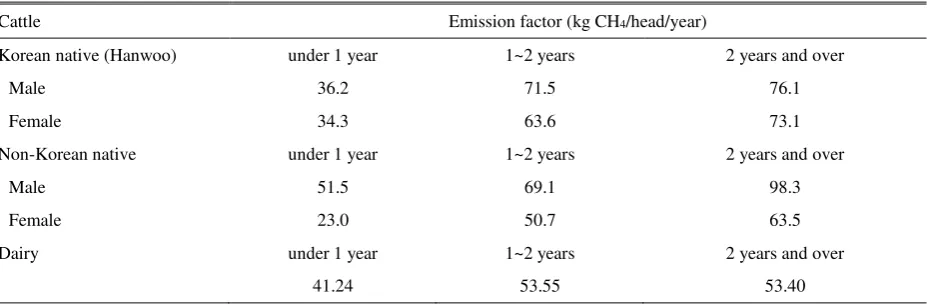
Emission factors for methane enteric fermentation from cattle in South Korea are provided in Table 3, which was used to estimate enteric methane emission.
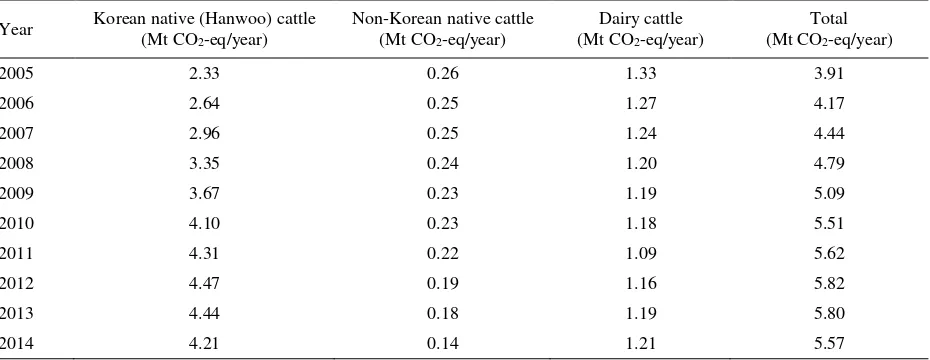
CH4 emissions from cattle enteric fermentation of South Korea are shown in Table 4. Annual CH4 emissions from the enteric fermentation of dairy cattle in the 16 provinces of South Korea between 2005 and 2014 decreased about 17.41%. However, it starts to increase after 2011. The highest CH4 emissions from dairy cattle enteric fermentation was recorded in Gyeonggi. In seven of the provinces, the CH4 emissions from dairy cattle enteric fermentation decreased in 2011 but then increased in 2014, compared to the emission in 2011. The local administrative provinces with decreased emission from dairy cattle enteric fermentation in 2014 compared to that in 2005 was Daegu (-56%), Daejeon (-100%) and Jeju (-18%).
The local administrative province with increased CH4 emissions from dairy cattle enteric fermentation in 2014 compared to that in 2005 was Chungcheongnam (+8%). From enteric fermentation, dairy cattle emitted 1.19 Mt CO2-eq in 2001 (Lee & Lee 2003), whereas in this study, dairy cattle emitted 1.21 Mt CO2-eq in 2014. The total methane emissions from enteric fermentation did not increase significantly because the population remained constant during the last ten years.
Table 3. Emission factors to estimate methane emissions from enteric fermentation of cattle in South Korea
Cattle Emission factor (kg CH4/head/year)
Korean native (Hanwoo) under 1 year 1~2 years 2 years and over
Male 36.2 71.5 76.1
Female 34.3 63.6 73.1
Non-Korean native under 1 year 1~2 years 2 years and over
Male 51.5 69.1 98.3
Female 23.0 50.7 63.5
Dairy under 1 year 1~2 years 2 years and over
Table 4. CH4 emissions from the enteric fermentation of cattle in South Korea (2005-2014)
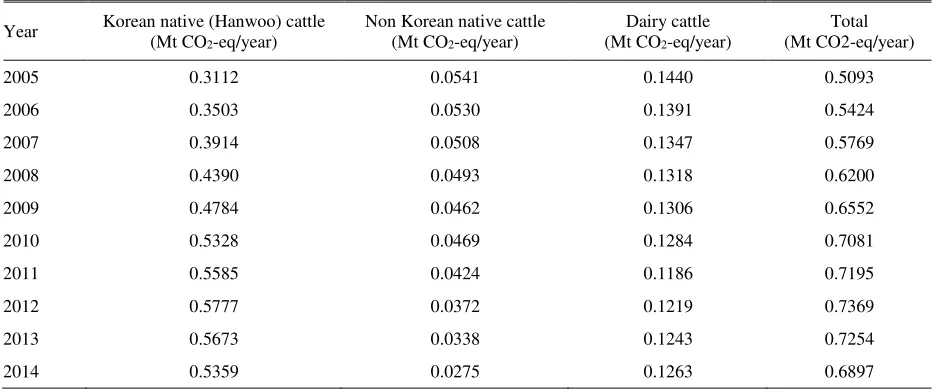
Year Korean native (Hanwoo) cattle (Mt CO2-eq/year) enteric fermentation of Non-Korean native cattle in South Korea decreased only about 0.46% or about 0.12 Mt CO2-eq. In all 16 provinces except for Busan, less CH4 was emitted from Non-Korean native cattle enteric fermentation in 2005 compared to that in 2014. The largest CH4 emissions decreasing between 2005 to 2014 was from Non-Korean native cattle in Chungcheongbuk with a decrease of 0.019 CO2-eq or about 52% compare to the initial. Local province with an increase of CH4 emissions from Non-Korean native cattle enteric fermentation was Busan that increased the emission by about 10% during the last ten years. From the enteric fermentation of Hanwoo cattle in South Korea, annual CH4 emissions increased by about 91.6% between 2005 and 2012 then decreased by about 5.8% in 2014. Compared to the emissions in 2005, all 16 local administrative provinces showed higher CH4 emissions from the enteric fermentation of Hanwoo cattle in 2014. Among the 16 local administrativeprovinces in 2014, Gyeongsangbuk recorded as a province with highest CH4 emissions from Hanwoo cattle enteric fermentation approximately by 0.91 Mt CO2-eq. For the enteric fermentation of Hanwoo cattle between 2005 and 2014, local administrative provinces with an increase in the rate of CH4 emissions above 100% were Incheon (+22,560.75 Mt CO2-eq, +258%), Gyeonggi (+190.125 Mt CO2-eq, +119%), and Jeollabuk (+272,742.75 Mt CO2-eq, +117%). Lee & Lee (2003) reported that methane emission from the enteric fermentation of Hanwoo cattle was 1.54 Mt in 2001, whereas we found that methane emissions were 4.21 Mt CO2-eq in 2014 from the enteric fermentation of Hanwoo. The largest contribution of methane from enteric fermentation was from Hanwoo cattle because of the highest population growth rate during ten-year period. Johnson & Johnson (1995) reported that many factors influence methane
emissions from cattle, including the level of feed intake, type of carbohydrate in the diet, feed processing, addition of lipids or ionophores to the diet, and alterations in the ruminal microflora. Furthermore, the results of this study (4.21 Mt CO2-eq from 2,724,879 head of Hanwoo cattle in a year) were consistent with those reported by Basarab et al. (2005), who reported that 8.34 Mt CO2-eq were emitted from the enteric fermentation of 6,474,350 head of Non-Korean native cattle in a year (using a Tier-2 method).
CH4 emission from manure management
Emissions of nitrous oxide from the management of Non-Korean native cattle manure were direct and indirect. Because the available data were limited for each variable, this assessment used Tier-1 method to estimate nitrous oxide emission. Annual average N excretion per head per year (Nex) value were used to estimate direct N2O emission. The fraction of total annual nitrogen excretion for livestock and the emission factor value that were used in this assessment were 1 and 0.006 N2O-N/kg N, respectively. These values were from the default values of the IPCC (2006). Methane emission factor is provided in Table 5 for the estimation of emission from the manure management of Non-Korean native cattle in South Korea. To evaluate the contribution of cattle production sector in South Korea to global warming, the global warming potentials of the GHG emissions were converted into units of Mt CO2 -eq.
Table 5. Emission factors to estimate methane emissions from manure management of Non-Korean native cattle in South Korea
Cattle Emission factor (kg CH4/head/year)
Hanwoo under 1 year 1~2 years Over 2 years
Male 0.60 1.01 0.94
Female 0.57 0.90 0.91
Beef under 1 year 1~2 years Over 2 years
Male 0.86 0.97 1.22
Female 1.10 1.32 1.62
Dairy under 1 year 1~2 years Over 2 years
0.99 1.16 2.53
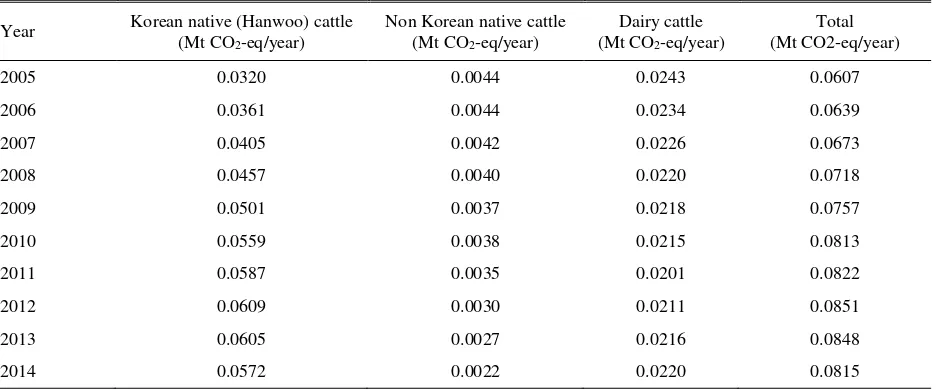
thereafter. Gyeonggi was the local administrative province with the highest CH4 emissions (8.176 kt CO2 -eq) from manure management in 2014. About 15 local administrative provinces showed a slight decrease in CH4 emissions from dairy cattle manure management with an annual growth rate of -1.02%, and one local administrative province (Chungcheongnam) showed an increase from 3.76 kt CO2-eq in 2005 to 4.05 kt CO2-eq in 2014.
Similarly, CH4 emission from manure management of Non-Korean native cattle in South Korea between 2005 and 2014 decreased approximately 49% with an annual growth rate of -7.16% (Table 6). All the 16 local administrative provinces showed a decrease in CH4 emission from Non-Korean native cattle manure management between 2005 and 2014. Gyeonggi was the local administrative province with the highest emissions of approximately 0.872 kt CO2-eq fromcattle manure management in 2014 among the 16 local administrative provinces.
CH4 emission from manure management of Hanwoo cattle in South Korea increased between 2005 and 2014
by about 0.0252 MtCO2-eq or 78%. Compared to the other local administrative districts, Gyeongsangbuk showed the highest CH4 emissions from the manure management of Hanwoo cattle between 2005 and 2014 (12.32 kt CO2-eq). The local administrative provinces with increased emissions of CH4 above 100% from the manure management of Hanwoo cattle between 2005 and 2014 were Incheon (+39 kt CO2-eq, +283.89%), Gyeonggi (+322.51 kt CO2-eq +127.74%), Jeollabuk (+458.99 ktCO2-eq, +122.92%), and Jeju (+39.80 ktCO2-eq, +122.92%). Annual growth rate for CH4 emission was 8.33% from manure management of Hanwoo cattle in South Korea between 2005 and 2014. Among the three types of cattle production in South Korea, methane emission increased only from the manure management of Hanwoo cattle.
N2O emission from manure management
N2O emissions from manure management of cattle are shown in Table 7. Emission of N2O during manure
Table 6. CH4 emission from the manure management of cattle in South Korea (2005-2014)
Year Korean native (Hanwoo) cattle (Mt CO2-eq/year)
Non Korean native cattle (Mt CO2-eq/year)
Dairy cattle (Mt CO2-eq/year)
Total (Mt CO2-eq/year)
2005 0.0320 0.0044 0.0243 0.0607
2006 0.0361 0.0044 0.0234 0.0639
2007 0.0405 0.0042 0.0226 0.0673
2008 0.0457 0.0040 0.0220 0.0718
2009 0.0501 0.0037 0.0218 0.0757
2010 0.0559 0.0038 0.0215 0.0813
2011 0.0587 0.0035 0.0201 0.0822
2012 0.0609 0.0030 0.0211 0.0851
2013 0.0605 0.0027 0.0216 0.0848
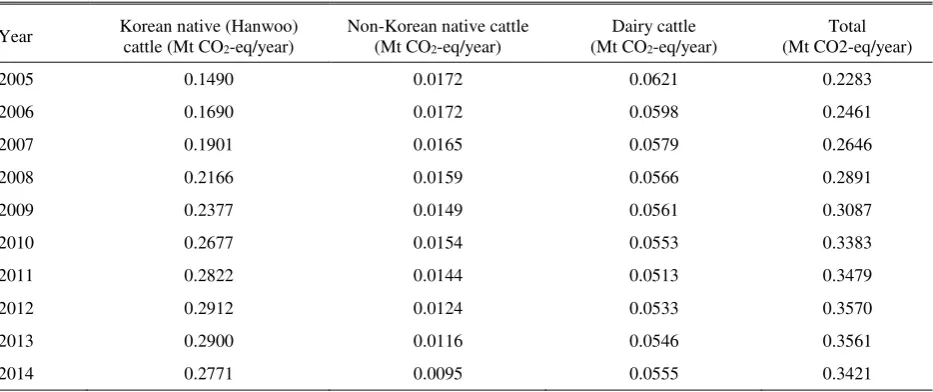
Table 7. N2O emissions from the manure management of cattle in South Korea (2005-2014)
Year Korean native (Hanwoo) cattle (Mt CO2-eq/year)
treatment occurs in two forms, direct and indirect. Total N2O emission from manure management of dairy cattle between 2005 and 2014 decreased by about 14%. The lowest N2O emission from dairy cattle manure management occurred in 2011, which increased thereafter. The largest decrease in percent emission was in Daejeon (-100%), followed by Daegu (-13.93%), whereas Chungcheongnam was the local administrative district with the largest increase in N2O emission from manure management of dairy cattle by approximately 114.9% in 2014 compared to that in 2005. Total N2O emission from manure management of Non-Korean native cattle between 2005 and 2014 decreased by approximately 49.10%. Local administrative district with the highest emission in 2014 was Gyeonggi (11,033 kt CO2-eq), whereas the lowest emissions was in Daejeon (0 kt CO2-eq). Those all local administrative districts showed a decrease in N2O emission from non-Korean native cattle manure management. Daejeon showed the largest decrease of about 100% and Seoul with the smallest decrease of about 6.36%. Local administrative provinces that had decreases in emission above 30% during last ten years were Incheon, Gwangju, Daejeon, Ulsan, Gyeonggi, Gangwon, Chungcheongbuk, Chungcheongnam, Jeollabuk, Jeollanam, Gyeongsangbuk, Gyeongsangnam, and Jeju, with decreases rate of approximately 83.79, 92.27, 100,00, 79.99, 32.02, 46.18, 57.52, 37.63, 67.67, 44.19, 51.14, 78.20, and 78.56%, respectively. Local administrative provinces with decrease rate below 30% were Seoul (6.36%), Busan (6.86%) and Daegu (25.39%).
In contrast, total N2O emission from manure management of Hanwoo cattle increased. Compared to emission in 2005, N2O emissions from Hanwoo cattle manure management in 2014 increased by
approximately 72.2%, although the emission decreased from 2012 by approximately (7.2%). Those 16 local administrative provinces had increased emission from manure management of Hanwoo cattle. Local administrative province with the highest N2O emission in 2014 was Gyeongsangbuk (0.11 Mt CO2-eq).
CO2 emissions from direct on-farm energy use for cattle production
Table 8. CO2 emissions from the direct on-farm energy use for cattle production in South Korea (2005-2014)
The emissions from direct on-farm energy use of Non-Korean native cattle production in South Korea decreased by about 0.44% during last ten years. All the 16 local administrative provinces showed decreases in the emissions from direct on-farm energy use for Non-Korean native cattle production. The local administrative district showed the highest emissions from direct on-farm energy use in Non-Korean native cattle production in 2014 was Gyeonggi (3,559.52 kt CO2-eq), and the lowest emissions was in Daejeon (0 t CO2-eq) since Non-Korean native cattle population has not been growth in Daejeon on 2012. CO2 emission decreased by more than 50% during the last ten-year period in 7 local administrative provinces, which were Incheon 81.94%), Gwangju 91.87%), Daejeon (-100%), Ulsan (-80.52%), Chungcheongbuk (-51.96%) Jeollabuk (-63.28%), Gyeongsangnam (-75.11%), and Jeju (-79.89%). The decreases in CO2 emission were production between 2005 and 2014 in South Korea was approximately 54.01%.
In contrast to that of Non-Korean native cattle production, CO2 emission from the on-farm energy use in Hanwoo cattle production increased from 2005 to 2012, then thereafter start to decrease. CO2 emission from direct on-farm energy use in the production of Hanwoo cattle in 2014 increased by approximately 85%
compared to that in 2005. Local administrative district with the highest CO2 emission from direct on-farm energy use in the production of Hanwoo cattle in 2014 was Gyeongsangbuk (59,820.40 kt CO2-eq). Seoul was the district with the lowest CO2 emission of approximately 8.23 kt CO2-eq. Four local administrative provinces that increase in CO2 emission from direct on-farm energy use in Hanwoo cattle production above 100% during the last ten years were Incheon (283.89%), Gyeonggi (127.74%), Jeollabuk (122.92%) and Jeju (102.78%). Development of Hanwoo cattle industry has been focused in these areas during last ten years, and therefore, the energy used for operating farm facilities increased as the increase of Hanwoo cattle population.
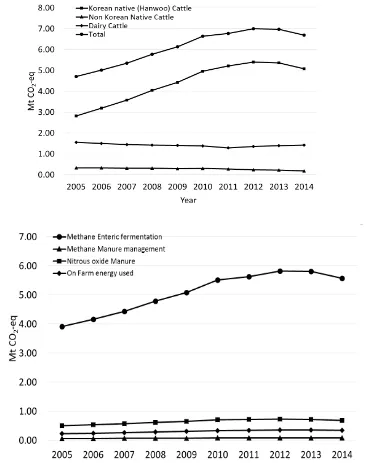
Global warming potential of GHG emission from cattle production
emissions) and methane from manure management was 0.754 Mt CO2-eq (1.2% of total emissions).
During the ten-year period (2005-2014), total emission from enteric fermentation from production of cattle in South Korea increased by approximately 42%. For comparison, GIR (2013) reported that total emission from enteric fermentation in a 10-year period in South Korea increased by approximately 9.7%. The estimation was lower than that of this study. High
increase in emission from enteric fermentation of cattle in the ten years of this study might represent the increase in the contribution of cattle production to total methane emission. The differences between the two estimates were primarily because the IPCC Tier-2 model significantly overpredicts cattle GE intake at higher level intake. This over predict was also reported by Jo et al. (2015) with Hanwoo steers study.
Furthermore, it is consensused that the enteric fermentation of cattle is the largest source of CH4 emission in the livestock sector (FAO 2006).
The highest emission of greenhouse gases during the ten-year period (2005-2014) of approximately 44.081 Mt CO2-eq was generated in the production of Hanwoo cattle, which was followed by dairy cattle production (13.84 Mt CO2-eq) and Non-Korean native production (2.80 kt CO2-eq). Compared with the level in 2005, the greenhouse gas emission from production of Hanwoo cattle have not reached the declared target level of a 30% reduction by 2020 (4% lower than the 2005 level) with 5.08 Mt CO2-eq produced in 2014, which was 80% higher than that in 2005 (2.82 Mt CO2-eq). However, target levels for the reduction in greenhouse gas emission from the production of both Non-Korean native beef and dairy cattle were reached. Emissions from production of Non-Korean native cattle were 0.18 Mt CO2-eq in 2014, which was 45% lower than that in 2005 (0.33 Mt CO2-eq).
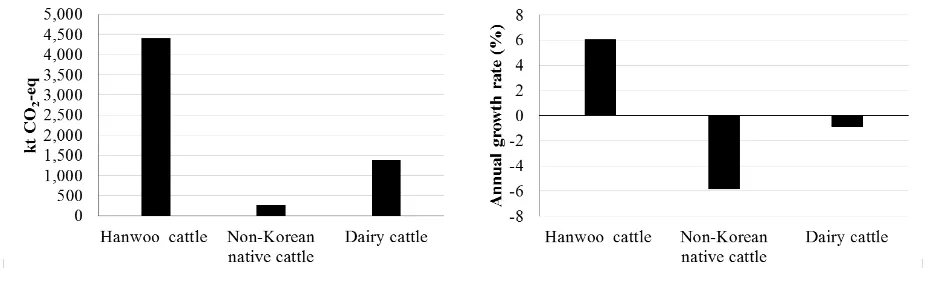
Annual average and annual growth rate of GHG emission from cattle production in South Korea between 2005 and 2014 are shown in Figure 2. Annual average GHG emission from Hanwoo cattle production was 4,408.13 kt CO2-eq/y, which was higher than that Non-Korean native cattle production (280.46 kt CO2-eq/y) and dairy cattle production (1,384.17 kt CO2- from production of Hanwoo cattle was 6.06% between 2005 and 2014. By contrast, average annual growth rate of GHG emission from beef and dairy cattle production was -5.83% and -0.92%, respectively (eq/y). Average annual growth rate of GHG emission
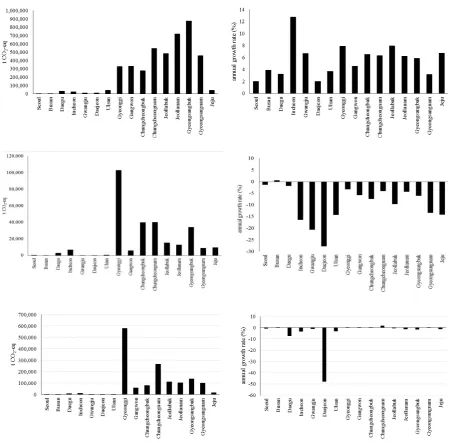
Annual average GHG emission from the production of Hanwoo beef and dairy cattle by province in South
Korea between 2005 and 2014 are shown in Figure 3. Local administrative district with the highest annual average GHG emission from the production of Hanwoo cattle was Gyeongsangbuk (874,088.35 t CO2-eq/y), whereas Seoul had the lowest emissions (309.28 t CO2-eq/y). In 8 local administrative provinces, annual average GHG emission from the production of Hanwoo cattle was above 200,000 t CO2-eq/y, which included Gyeonggi (329,236.88 t CO2-eq/y), Gangwon (333,708.28 t CO2-eq/y), Chungcheongbuk (276,040.47 t eq/y), Chungcheongnam (545,616.62 t CO2-eq/y), Jeollabuk (483,579.63 t CO2-CO2-eq/y), Jeollanam (717,474.71 t CO2-eq/y), Gyeongsangbuk (874,088.35 t eq/y), and Gyeongsangnam (459,675.92 t CO2-eq/y). The highest annual growth rate in GHG emissions from the production of Hanwoo cattle was in Incheon (12.73% per year), and the lowest annual growth rate was in Seoul (1.99% per year). In contrast to the emission from production of Hanwoo cattle, the highest annual average of GHG emission from beef and dairy cattle production was in Gyeonggi Province, with 102,811.80 and 579,239.60 t CO2-eq/y, respectively. Daejeon was the local administrative province with the lowest annual growth rates for the emissions from beef and dairy cattle production, with approximately -27.72% and -47.81% per year, respectively. From this study, the local towns primarily produced the GHG emission from the production of Hanwoo cattle compared with the metropolitan areas. The annual growth rate of GHG emissions from production of Hanwoo cattle was considerably higher than that of beef and dairy cattle production.
Figure 3. Annual average and annual growth rate of GHG emission from the production of Hanwoo cattle (A), Non-Korean native cattle (B) and Dairy cattle (C) by province in South Korea (2005-2014).
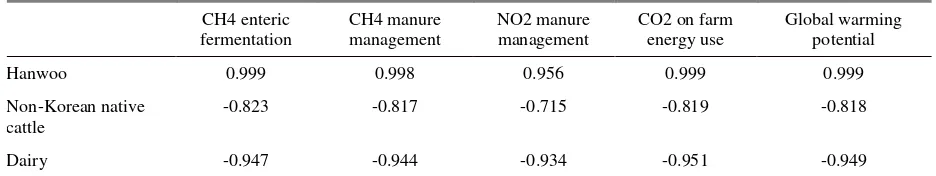
Results of correlation analyses between the cattle type and GHG emission in South Korea from 2005 to 2014 are provided in Table 9. Correlation coefficient of CH4 emission from the enteric fermentation of Hanwoo cattle and the total CH4 emission was 0.999, which was higher than that Non-Korean native cattle (-0.823) or dairy cattle (-0.947). Correlation coefficient of CH4 emission from the manure management of Hanwoo cattle and total CH4 emission was 0.998, which was higher than that Non-Korean native cattle (-0.817) or dairy cattle (-0.944). Correlation coefficient of NO2 emission from manure management of Hanwoo cattle and total NO2 emission was 0.956, which was higher
Table 9. Correlation analysis between cattle type and GHG emission in South Korea from 2005 to 2014
manure management, NO2 emission from manure management, CO2 emission from on-farm energy use, and total global warming potential of GHG emission from cattle production sector in South Korea.
However, both overestimates and underestimates of emissions were possible in this study. Kebreab et al. (2008) reported that the IPCC values result in an overestimate of emissions by approximately 12.5% and an underestimate by approximately 9.8% for dairy and feedlot cattle, respectively. In this study, about 31.18% overestimates of enteric fermentation occurred which was higher than the one reported by GIR (2013).
CONCLUSION
Emissions of greenhouse gases from the cattle production sector in South Korea increased year to year and failed to reach the target pledge of a 30% reduction compared with current levels. Production of Hanwoo cattle was the primary contributor to CH4 emission from enteric fermentation, CH4 emission from manure management, NO2 emission from manure management and CO2 emissions from on farm energy use in the cattle production sector of South Korea during the ten-year period of this study. Proper mitigation is required in the cattle production sector to meet the target pledge for emission in 2020. Mitigation options for reductionsin emission should focus on the production of Hanwoo cattle because of the significant contributions to greenhouse gas emission in South Korea.
ACKNOWLEDGEMENTS
This work was supported by the Animal Environmental and Bioengineering Laboratory, Department of Agricultural Biotechnology, Seoul National University (SNU), Seoul, South Korea. The authors would like to thank the Korean Institute of Planning & Evaluation for Technology in Food, Agriculture, Forestry & Fisheries (IPET) and the Korean Energy Technology Evaluation and Planning (KETEP) for financial support during this study.
REFERENCES
[AAFCCT] Agriculture and Agri-Food Climate Change Table. 2000. Options report: Reducing greenhouse gas emissions from Canadian Agriculture. Publication No. 2028/E.
Amon B, Kryvoruchko V, Amon T, Zechmeister-Boltenstern S. 2006. Methane, nitrous oxide and ammonia emissions during storage and after application of dairy cattle slurry and influence of slurry treatment. Agric Ecosyst Environ. 112:153-162. doi: 10.1016/j.agee.2005.08.030.
Basarab JA, Okine EK, Baron VS, Marx T, Ramsey P, Ziegler K, Lyle K. 2005. Methane emissions from enteric
fermentation in Alberta’s Non-Korean native cattle population. Can J Anim Sci. 501:2-13. doi: 10.4141/A04-069.
[FAO] Food and Agriculture Organization. 2006. Livestock’s long shadow: Environmental issues and options. Rome (Italy): Food and Agriculture Organization of the United Nations.
Gerber PJ, Steinfeld H, Henderson B, Mottet A, Opio C, Dijkman J, Falcucci A, Tempio G. 2013. Tackling climate change through livestock: a global assessment of emissions and mitigation opportunities. Rome (Italy): Food and Agriculture Organization, United Nations.
[GIR] Gas Inventory and Research. 2013. National greenhouse gas inventory report of Korea. Seoul (Korea): Greenhouse Gas Inventory and Research Center of Korea.
Höglund-Isaksson L. 2012. Global anthropogenic methane emissions 2005-2030: Technical mitigation potentials and costs. Atmosph Chemist Phys. 12:9079-9096. doi: 10.5194/acp-12-9079-2012.
[IPCC] Intergovernmental Panel on Climate Change. 2006 IPCC Guidelines for National Greenhouse Gas Inventories, Prepared by the National Greenhouse Gas Inventories Programme. Eggleston HS, Buendia L, Miwa K, Ngara T, Tanabe K, editors. Kanalawa (Jpn): Institute for Global Environmental Strategies.
Jo N, Kim J, Seo S. 2015. Estimation of methane emission factor for enteric fermentation of growing-finishing Hanwoo steers using the IPCC Tier 2 approach. Peer J Pre Prints 3:e1578. doi: 10.7287/peerj.preprints. 1285v1.
Johnson KA, Johnson DE. 1995. Methane emissions from cattle. J Anim Sci. 73:2483-2492. doi: 10.2527/1995. 7382483x.
Kebreab E, Johnson KA, Archibeque SL, Pape D, Wirth T. 2008. Model for estimating enteric methane emissions from United States dairy and feedlot cattle. J Anim Sci. 86:2738-2748. doi: 10.2527/jas.2008-0960.
Lee HJ, Lee SC. 2003. National methane inventory relevant to livestock enteric fermentation. Korean J Anim Sci Technol. 45:997-1006. doi: 10.5187/JAST.2003. 45.6.997.
Merino P, Ramirez-Fanlo E, Arriaga H, del Hierro O, Artetxe A, Viguria M. 2011. Regional inventory of methane and nitrous oxide emission from ruminant livestock in the Basque country. Anim Feed Sci Technol. 166-167:628-640.
Opio C, Gerber P, Mottet A, Falcucci A, Tempio G, MacLeod M, Vellinga T, Henderson B, Steinfeld H. 2013.
Greenhouse gas emissions from ruminant supply chains-A global life cycle assessment. Rome (Italy): Food and Agriculture Organization, United Nations.
Patra AK. 2014. Trends and projected estimates of GHG emissions from Indian livestock in comparisons with GHG emissions from world and developing countries. Asian Australas J Anim Sci. 27:592-599. doi: 10.5713/ajas.2013.13342.
Smith P, Martino D, Cai Z, Gwary D, Janzen H, Kumar P,
McCarl B, Ogle S, O’Mara F, Rice C, Scholes B, Sirotenko O. 2007. Agriculture. In: Metz, B, Davidson OR, Bosch PR, Dave R, Meyer LA, editors. Climate change 2007: Mitigation. Contribution of Working Group III to the Fourth Assessment Report of the Intergovernmental Panel on Climate Change. Cambridge (UK): Cambridge University Press.
[UNFCCC] United Nations Framework Convention on Climate Change. 2011. FCCC/AWGLCA/2011/INF.1. United Nations.