food from Bali
By
A.A. Made Semariyani, I. Wayan Sudiarta, Luh Suriati,
Ni Made Ayu Suardani Singapurwa and I Nyoman Rudianta
ISSN 2319-3077 Online/Electronic
ISSN 0970-4973 Print
UGC Approved Journal No. 62923
MCI Validated Journal
Index Copernicus International Value
IC Value of Journal 82.43 Poland, Europe (2016)
Journal Impact Factor: 4.275
Global Impact factor of Journal: 0.876
Scientific Journals Impact Factor: 3.285
InfoBase Impact Factor: 3.66
J. Biol. Chem. Research
Volume 35 (2) 2018 Pages No. 469-475
Journal of
Biological and
Chemical Research
An International Peer Reviewed / Referred Journal of Life Sciences and Chemistry
Indexed, Abstracted and Cited in various International and
National Scientific Databases
J. Biol. Chem. Research. Vol. 35, No. 2: 469-475, 2018
(An International Peer Reviewed / Refereed Journal of Life Sciences and Chemistry)
Ms 35/02/1191/2018
All rights reserved
ISSN 2319-3077 (Online/Electronic)
ISSN 0970-4973 (Print)
A.A.M. Semariyani
http://
www.sasjournals.com
http://
www.jbcr.co.in
[email protected]
RESEARCH PAPER
Received: 22/04/2018
Revised: 01/07/2018 Accepted: 02/07/2018
Flavor of Urutan, a Traditional Chicken-based
food from Bali
A.A. Made Semariyani, I. Wayan Sudiarta, Luh Suriati,
Ni Made Ayu Suardani Singapurwa and I Nyoman Rudianta
Department of Food Science and Technology, Warmadewa University,
Denpasar, Bali, Indonesia
ABSTRACT
Rresearch has been carried out to get a proper formulation in the production of Urutan, in order to get a product with good characteristics that is well-received by consumers. The research was performed in August-November 2017 at Faculty of Agriculture, Warmadewa University, whle protein analysis was performed at Food Analysis Laboratory, Udayana University. The chicken was obtained from Ketapian market, East Denpasar district, while the synthetic casing was collected from UD Dwi Boga Utama at 89 Buana Raya Street, Padangsambian, West Denpasar. The research used completely Randomized Block Design, with 2 x 4 factorial and 2 replications. The first independent factor was addition of fat (0, 10, 20, and 30 %) and the second factor was treatment (with fermentation and without fermentation); thus, there were a total of 16 treatments. Parameters observed were objective parameters (moisture content, ash content, pH, fat content, and protein content) and subjective parameters with sensory analysis on color, texture, taste, aroma, and overall acceptance from panelists on the product. The results showed that treatment/formulation that could produce the Urutan chicken with good characteristics (based on the standard SNI 01-3820-1995) and well-accepted by panelists was the treatment with 10 % addition of fat with no fermentation process. The product resulted had moisture content 51.010 % (w/w), fat content 15.10 % (w/w), protein content 33.06 % (w/w) and pH 6.20. In sensory evaluation, the product was rated 5.31
(slightly like – like) for color, 5.69 for taste (slightly like-like), 4.81 for aroma (neutral – slightly like), 5.56 for
texture (slightly like-like), and 5.50 for overall acceptance (slightly like-like). Keywords: Fermentation, Characteristics, Fat Addition and Urutan Chicken.
INTRODUCTION
Urutan is a traditional sausage from Bali that is produced with or without fermentation. Urutan is usually produced for religious holidays such as Galungan, where there is excess pork available from the religious ceremony. There are usually two ways of meat processing done by the Balinese: drying to produce jerky and fermentation to produce Urutan, Bebontot, Brengkes, Buntilan and Takilan Celeng (Antara et al., 2002, Partama et al., 2005; Nocianitri, 2009).
fermentation to start naturally (Aryanta, 2000). However, Urutan has now been produced commercially and it
is sold in traditional markets as well as in supermarkets. To fulfill consumers’ requests, market demands, and
as product diversification, there has been Urutan made from chicken that is produced for those who do not consume pork or are allergic to pork. The casing used has also been replaced with synthetic edible film
As a famous traditional food in Bali, it has started to be popular among tourists, both locals and internationals. Thus, its quality and safety need to be well taken care of, but unfortunately, these aspects have not been studied much. Therefore, a research was needed to get the best formulation in order to produce Urutan
chicken with good characteristics and well accepted by consumers. This research was important to ensure that the product produced is safe and has good quality. It was expected that research results could provide with its low quality texture, since it is hard and less preferred by the consumers. It is most probably be caused by the lack of addition of fat in the processing, since marbling (fat distribution) in chicken is different with pork, thus the texture of Urutan chicken tends to be tough and hard. Since there is a high interest for traditional food, both locally and internationally, thus it is necessary to find the best formulation for Urutan chicken, in order to get a product with good characteristics and well-received by consumers. Moreover, it is important to
know the complete product’s nutrition content and benefits, especially since it is a fermented product, which is often expected to bring the benefit of functional food. Furthermore, it is also important to know the safety of this traditional food as demanded by the consumers, so that it can penetrate the global market. When a food producer cannot fulfill the requirement of food safety, it can hinder them from expanding their market and exporting their products to other countries.
It is also important to avoid mistakes in production of Urutan chicken by using quality standard as guideline to control the production process. Quality standard is also useful to avoid complains from the regular consumers of Urutan chicken. Confidence in the quality of the product will indirectly protect the consumers in consuming the product, thus triggering the increase of the production of this traditional food. Economically, safe product can lead to increased purchase, thus bringing positive effect on the business and help the marketing of the product. In the future, it is expected that traditional culinary product such as Urutan chicken, could be a part of the local entrepreneurship that can help to reduce the number of unemployment.
Based on the background explained above, it was necessary to conduct a research on the flavor
The research was set as Randomized Complete Block Design with factorial design. Data collected was analyzed with analysis of variance (ANOVA) and continued with post-hoc Duncan test with 95 % confidence interval. Factor I: addition of fat (L) with 4 levels:
L1 = without addition of fat (0 %)
Combinations of treatment were replicated twice, thus there were 16 units of experiments (sample).
Conducting the research
The research was conducted in three steps: preliminary, experiment, and observation.In the observation step, biochemical analysis and sensory test were performed on Urutan chicken samples. The biochemical analysis included moisture content (gravimetric method with drying oven), carbohydrate content (by difference), protein content (Kjehldahl method), fat content (Soxhlet method), ash content (gravimetric method with furnace), and pH (AOAC method). For sensory analysis, the samples were observed by the panelists for their aroma, taste, color, texture, and overall acceptance.
Data analysis
Data collected was analyzed descriptively and displayed as tables and charts. Next, it was analyzed with ANOVA using SPSS v.18 as the statistical software. For the results of sensory analysis, when there was significant difference in the ANOVA, the data was further analyzed with Duncan test (Steel and Torrie, 1989).
RESULTS AND DISCUSSION
Moisture contentBased on the result of ANOVA test, addition of fat as well as interaction between addition of fat and fermentation did not significantly affect the moisture content of samples (P≥0.05) Meanwhile, fermentation was found to give significant effect (P < 0.05) on moisture content of Urutan chicken. Average moisture content values of Urutan chicken are displayed in Table 1.
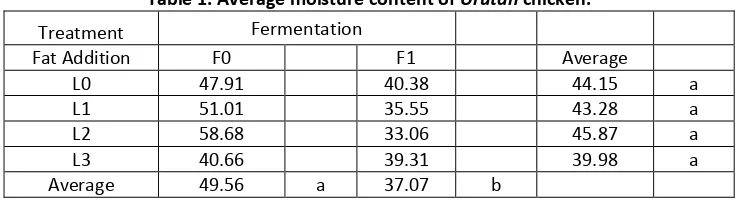
Table 1. Average moisture content of Urutan chicken.
Treatment Fermentation
Fat Addition F0 F1 Average
L0 47.91 40.38 44.15 a L1 51.01 35.55 43.28 a L2 58.68 33.06 45.87 a L3 40.66 39.31 39.98 a Average 49.56 a 37.07 b
Notes:
Average values followed by similar letters in the same line or column show no significant difference.
Table 1 shows that the average moisture content of unfermented Urutan chicken was 49.56 %, which was significantly different (P < 0.05) with the moisture content of fermented Urutan chicken (37.07 %). The fermented sample had lower moisture content due to the loss of moisture. The results showed that the average values of all Urutan chicken samples were in accordance to the standard for chemical composition of meat sausage (SNI 01-3820-1995), which was 67 % (w/w).
Ash content
Results of the current study showed that addition of fat, fermentation, and interaction between fat addition and fermentation did not significantly affect (P ≥ 0.05) the ash content of Urutan chicken. The average ash content of the samples was between 1.6990 – 3.905 % (w/w). If compared with the standard for chemical composition of meat sausage (SNI 01-3820-1995) that was set at maximum of 3 %, thus only the unfermented
Urutan chicken with 30 % addition of fat that could not fulfill the requirement since its ash content was 3.905 % (w/w) while other treatments had ash content lower than the limit. The average ash content of Urutan
chicken was as follows.
Table 2. Average values of ash content of Urutan chicken.
Treatment Fermentation
Chicken Fat Addition F0 F1 Average
L0 2.520 2.24 2.38 a L1 1.690 2.64 2.17 a L2 2.165 2.73 2.45 a L3 3.905 2.01 2.96 a Average 2.570 a 2.41 a
Notes: Average values followed by similar letters within the same line or column show no significant difference.
Degree of Acidity (pH)
Results showed that addition of fat and interaction between addition of fat and fermentation did not significantly affect (P ≥ 0.05) pH of the Urutan chicken samples. Meanwhile, fermentation significantly affected (P < 0.05) pH of the samples. The average pH value of unfermented samples was 6.11, which was significantly different with the pH of the fermented sample (4.29). The fermented sample had lower pH value since during fermentation, there was breakdown of glycogen contained in the chicken meat that formed lactic acid due to the activity of the lactic acid bacteria (Bifidobakterium Bifidum and Lactobacillus casei). Enzymes produced by the bacteria worked on the sugar available in the chicken meat and turned it into lactic acid, which eventually lowered the pH of the fermented sausage. The average pH values of the Urutan chicken samples are as follow:
Table 3. Average pH values of Urutan chicken.
Treatment Fermentation
Chicken Fat Addition F0 F1 Average L0 6.04 5.15 5.60 a L1 6.20 4.73 5.47 a L2 5.95 5.01 5.48 a L3 6.22 4.81 5.52 a Averaga 6.11 a 4.92 b
Notes :
Average values followed by similar letters within the same line or column show no significant difference.
Fat content
This study showed that fermentation and interaction between addition of fat and fermentation significantly affected (P > 0.05) on the fat content of Urutan chicken. However, there was no significant effect (P ≥ 0.05) given by addition of fat.
The highest average value of fat content of Urutan chicken was from the unfermented sample without addition of fat with 15.34 %, while the lowest value was given by the fermented sample with addition of 10 % fat where it had 12.03 % ash content. This phenomenon was probably due to the breakdown of fat by lactic acid bacteria during fermentation, after other sources of energy were fully utilized. If compared to the standard of chemical composition of meat sausage (SNI 01-3820-1995), all samples fulfill the requirement since their fat content was lower the maximum limit of 25 % (w/w). The average values of fat content of
Urutan chicken are displayed below.
Table 4. Average values of fat content of Urutan chicken.
Treatment Fermentation
Fat Addition F0 F1 L0 15.34 a 12.57 b
(a) (b) L1 15.10 a 12.03 b
(a) (b) L2 14.14 a 14.83 a
(a) (a) L3 14.43 a 13.83 a
(a) (ab) BNT (0.05) 1.99
Notes:
1. Average values with different letters within the same line show significant difference (P < 0.05). 2. Average values with different letters within the same column show significant different (P < 0.05).
Protein content
Results showed that addition of fat, fermentation, and interaction between addition of fat and fermentation significantly affected (P < 0.05) the protein content of Urutan chicken. The highest average protein content was contained in the fermented sample with 0 % of fat addition, which was 37.62 %; while the lowest value was contained in the unfermented sample with 30 % of addition of fat with protein content of 26.99 %. The high protein content in fermented Urutan chicken was due to the breakdown of complex protein to simpler forms. The average protein content of all treatments fulfilled the standard requirement for chemical composition of meat sausage (SNI 01-3820-1995), which was minimal protein content of 13 %. The average values of protein content of the samples are as follow:
Table 5. Average protein content of Urutan chicken.
Treatment Fermentation Fat Addition F0 F1
L0 35.81 a 37.62 b (a) (a)
L1 33.06 a 36.66 b (b) (ab)
L2 28.68 a 35.69 b (c) (b)
L3 26.99 a 33.75 b (d) (c)
BNT (0.05) 1.31 Notes:
1 Average values followed with different letters within the same line show highly significant difference (P < 0.01).
2 Average values with different letters underneath show highly significant difference (P < 0.01).
Subjective variables
Based on statistical analysis, there was no significant effect of the treatments on the samples’ color, texture, and overall acceptance. However, there were significant and highly significant effects given by the treatments
on the samples’ taste and aroma, respectively. Average acceptance values of the samples are shown in Table
6.
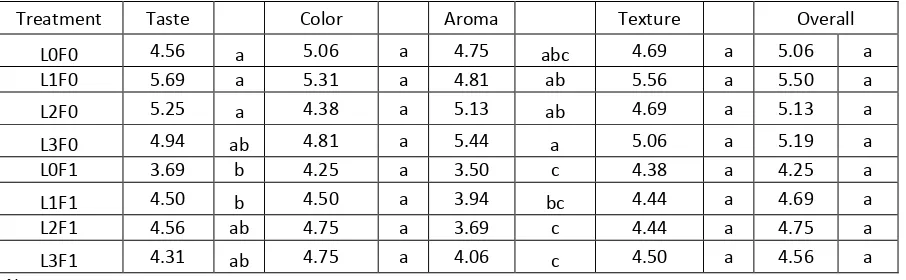
Table 6. Average values of subjective observation for panelists’ acceptance.
Treatment Taste Color Aroma Texture Overall L0F0 4.56 a 5.06 a 4.75 abc 4.69 a 5.06 a L1F0 5.69 a 5.31 a 4.81 ab 5.56 a 5.50 a L2F0 5.25 a 4.38 a 5.13 ab 4.69 a 5.13 a L3F0 4.94 ab 4.81 a 5.44 a 5.06 a 5.19 a L0F1 3.69 b 4.25 a 3.50 c 4.38 a 4.25 a L1F1 4.50 b 4.50 a 3.94 bc 4.44 a 4.69 a L2F1 4.56 ab 4.75 a 3.69 c 4.44 a 4.75 a L3F1 4.31 ab 4.75 a 4.06 c 4.50 a 4.56 a Notes:
Average values followed by similar letters within the same line or column show no significant difference.
Taste
Analysis on sensory test data showed that addition of fat and fermentation had significant effect on the taste of Urutanchicken. The highest score was given to unfermented sample with 10 % of addition of fat, which was 5.69 (rather like – like), while the lowest score of 3.69 (rather dislike – neutral) was given to fermented sample without addition of fat. Fermented samples had slightly sour taste due to the breakdown of glycogen during fermentation to form lactic acid as a result of the activity of lactic acid bacteria.
Color
From the sensory analysis, it was found that addition of fat and fermentation did not significantly affect the color of Urutan chicken. Acceptance scores given by the panelists were in the range of 4.25 – 5.31 (neutral – like). All treatments gave light brown to dark brown color on sample after frying.
Flavor
Addition of fat and fermentation were found not to significantly affect the aroma of Urutan chicken. The highest score was given to unfermented sample with 30 % of fat addition, which was 5.44 (slightly like – like). Meanwhile, fermented sample without addition of fat got the lowest score of 3.50 (slightly dislike – like). Fermented sample had stronger flavor (slightly sour) compared to the unfermented sample.
Texture
Sensory analysis showed that addition of fat and fermentation did not significantly affect the texture of
Urutanchicken. The average score given by the panelists to the texture of samples were in the range of 4.38 – 5.56 (neutral –slightly like). The samples’ texture ranged from not chewy to slightly chewy.
Overall acceptance
Addition of fat and fermentation did not significantly affect the overall acceptance of Urutanchicken. Average scores given by the panelists on overall acceptance of the samples ranged between 4.25 – 5.50 (neutral – like). The panelists liked samples with brownish color, no sour taste, characteristic aroma of Urutan, slightly chewy texture (not hard/tough), smooth surface, compact, dense, and not brittle or crumbling into pieces when cut.
CONCLUSION
Based on the study, there were several conclusions drawn
1. Addition of fat did not significantly affect moisture content, ash content, and pH of Urutan chicken, while fermentation significantly affected moisture content and pH of the samples.
2. Urutan chicken with good characteristics was observed to come from the unfermented treatment with 10 % of addition of fat, which had 51.010 % (w/w) moisture content, 1.690 % (w/w) ash content, 15.105 % fat content (w/w), 33.06 % protein content (w/w), and pH 6.20. This sample was rated by the sensory panelists who gave the scores of 5.31 (slightly like – like) for color, 5.69 (slightly like – like) for taste, 4.81 (neutral – slightly like) for aroma, 5.56 (slightly like – like) for texture, and 5.50 (slightly like – like) for overall acceptance. This treatment gave product that fulfilled the standards required for meat sausage (SNI 01-3820-1995).
Suggestions
There were several suggestions for future study based on the results of the current study :
1. To produce Urutanchicken with good characteristics, it is suggested to add 10 % fat in the formulation, without fermentation process.
2. Further study is necessary in production of fermented Urutan chicken in order to produce a product with less sour taste and aroma, since these characteristics are not preferred by the panelists, thus it needs a controlled fermentation process.
ACKNOWLEDGEMENTS
The authors would like to appreciate the financial support provided by Warmadewa University for conducting the research in 2017.
REFERENCES
AOAC (1984). Official Methods of Analysis of the Association of Official Analytical Chemist. Washington DC. Antara, N.S., I.N. Sujaya, A.Yokota, K. Asano, W.R. Aryanta, and F. Tomita. 2002. Identification and Succession
of Lactic Acid Bacteria During Fermentation of ‘urutan’, a Balinese Indigenous Fermented Sausage.
Word J. of Microbiology & Biotechnology 18: 255-262.
Aryanta, W.R. (1995). Peranan Bakteri Asam Laktat dalam Industri Pengolahan Pangan. Pidato Pengesahan Jabatan Guru Besar Tetap Bidang Mikrobiologi Pangan pada Program Studi Teknologi Pertanian Universitas Udayana. Tgl 27 Oktober 1995 di Denpasar
Aryanta, W.R. (2000). Utilization of Lactic Acid Bacteria to Improve the Quality of Balinese Traditional Fermented Sausage. Characteristics of Balinese Traditional Fermented Sausage.International Center of Biotechnology Osaka University. Osaka. Japan. P. 610 - 616
Nocianitri, K.A. (2009). Urutan. Pusat Kajian Makanan Tradisional. Universitas Udayana. Denpasar.
Partama, I W.S., N. S. Antara, dan L.P. Wrasiati (2005). Pengaruh Penambahan Bawang Putihdan Lama Fermentasi Terhadap Mutu Mikrobiologis Dan Organoleptik Bebontot. Seminar Nasional Pengembangan Teknologi Pertanian Berbasis Penggunaan (User Based Oriented), 13 September 2005. Universitas Udayana. Denpasar.
Steel, R.G. dan and J.H. Torrie (1989). Principles and Procedur of Statistic, McGraw-Hill Book Company, New York Standar Nasional Indonesia (SNI) 01-3820-1996 tentang persyaratan mutu sossis daging.