Simulation and Feasibility Studies of Rooftop PV
System for University Campus Buildings in
Surabaya, Indonesia
Elieser Tarigan*‡
*Department of Electrical Engineering, Faculty of Engineering, and Center for Renewable Energy Studies, University of Surabaya
‡Corresponding Author ; Dr. Elieser Tarigan, University of Surabaya, Jl. Raya Kalirungkut, Surabaya 60292, Indonesia
Tel: +62 31 298 1358, Fax: +62 31 298 1341, [email protected]
Received: 03.02.2018 Accepted:18.03.2018
Abstract- Present work simulates and analyzes the rooftop photovoltaic (PV) system on buildings roofs of the University of Surabaya, Indonesia for electricity power generation. The work also to calculate greenhouse gas (GHG) emission reduction that can be obtained by PV system mounted on the building roofs. The surface area of the roofs was determined using Polygon feature of Google Earth TM. The energy output of the system was simulated with SolarGIS pvPlanner software program. The grid-connected PV system type was chosen in the simulation. Greenhouse gas (GHG) emission reduction analysis was carried out using RETScreen program simulation. It was found that about 10,353 m2 of the rooftop of the university buildings could be used for panel installation. The total capacity of the panels is found about 2,070 kWp with total electricity production is about 3,180 MWh per year and could supply up to 80% of the campus energy demand. The system would serve as a means of reducing 3,367.6; 2,477.2, or 1,195.7 tons of CO2 to the atmosphere in comparison to the same amount of electricity produced by burning coal, oil, or natural gas respectively. The unit cost of PV electricity was found ranging from 0.10 – 0.20 USD/kWh. From economic aspects, the rooftops PV system has the potential to provide power at a competitive cost in comparison to other alternative options of power generation.
Keywords Rooftop; PV system, campus building, University of Surabaya, BIPV
1. Introduction
Higher education institutions have an important role in developing and promoting renewable and sustainability. Institutions have the role and responsibility to integrate sustainable development into all their campus operations[1], [2]. University of Surabaya is one of the prestigious universities in Eastern part of Indonesia. The university has a highly concerned on sustainability issues. The Center for Renewable Energy Studies of University of Surabaya, established in June 2011, has been contributing on teaching, research, and community engagement related to energy conservation and renewable energy applications.
Solar energy is one of the most common and inexhaustible renewable energies recently that plays an increasingly essential role. Solar energy in the form of radiation can be directly converted into electricity using
photovoltaic (PV) system. The rapid development of PV technology has been attracted more attention and interest in solar energy [3]–[5].
The assessment of solar energy potential in a location where a PV system is planned to be installed is necessary and would affect the successfulness of the system. The potential of solar energy in a location much depends directly on the local exposure to sunlight. For a roof mounted PV system, the architectonic building is one of the most important aspects to be considered in evaluating solar energy potential [4], [6][7]. The architectonic aspect includes identification of the roof shapes; identification of building roof surfaces (flat and slanted); and estimation of the number of floors for each building.
[9]. Modeling and simulation of solar energy yield, however, requires large numbers of input data of solar irradiation, on-site weather conditions, and technical parameters of system components [10].
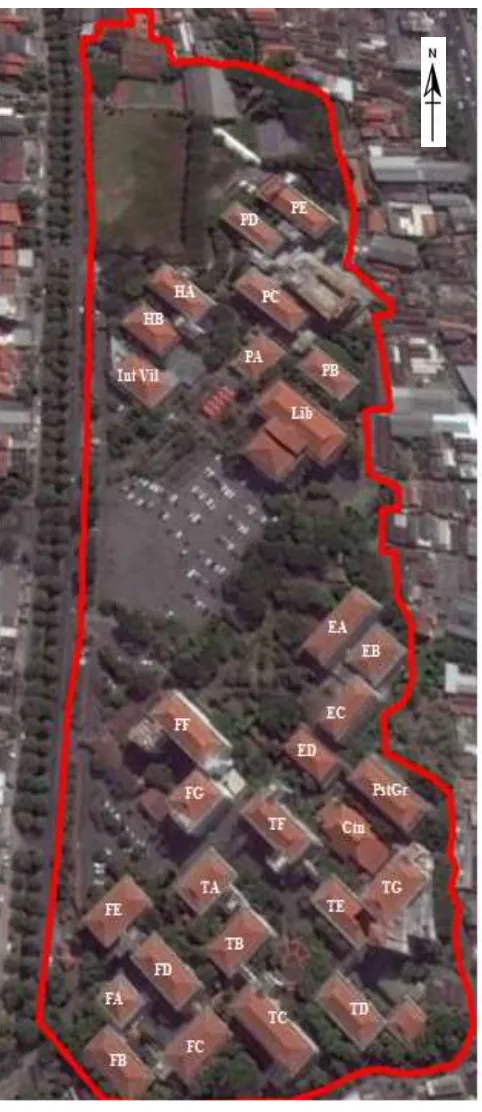
Fig. 1. Map of buildings of University of Surabaya generated from Google Earth TM
The installation of a solar PV system requires an open space for mounting of PV modules to optimize capturing of solar irradiation. In an urban area like Surabaya and the other cities, the limitation of appropriate space has been a challenge for PV application and therefore utilizing of the
roof area of a building (rooftop PV system) considerably a good option.
A number of research has been conducted on the topic of building rooftop PV installation potential in many countries [3], [11]–[14]. However, less studies have been reported for Indonesian urban situations. Quantified the rooftop PV power generation potentials in Southeastern Ontario was reported by Wiginton et.al.[15]. Five steps were inroduced and applied to determine the available rooftop surface area, i.e., sampling; geographical division of the region; deducing of relationship between rooftop area and population; reduction of shading and other uses; and conversion to power and energy outputs. Vardimon [16] reported a study of the useful area of rooftops in Israel. The work was carried out using orthoimages to extract building layer images. The available rooftop area was calculated by using GIS data. It was reported that 32% of annual Israel national consumption was equivalent to the annual rooftop PV electricity production. Bergamasco and Asinari [13] studied the assessment of the PV energy potential together with its application at the Piedmont Region (North-Western Italy). The useful roof area for solar PV system applications was calculated through the analysis of available GIS data.
There is quite number of simulation softwares commonly used in the design of PV systems to predict output energy. Several works on PV system design using software applications like TRNSYS, PVFORM, INSEL, PHANTASM, P-Spice, PVsyst, SolarPro, PV-DesinPro, PVcad, and SolarGIS PV Planner were reported [17]–[20]. SolarGis PV Planner and RETScreen are among of the softwares that have the capability of Modeling Solar PV system[21], [22]. The two softwares were used in present work to predict the performance of PV system planned on rooftop of the University of Surabaya buildings.
The implementation of solar PV electricity at a university would be beneficial for many parties. University of Surabaya campus has the potential for very high output gains due to the amount of rooftop space available for the modules. The main goal of present work is to simulate and analyze the feasibility of rooftop photovoltaic (PV) system on buildings roofs of the University of Surabaya, Indonesia for electricity power generation. The work also to calculate the energy yield, performance ratio, and green gas house (GHG) emission reduction that can be obtained by PV system mounted on building roofs. The study would provide information on the capability of rooftop PV system to supply energy, in particular for a campus situated in a similar climate and astronomical condition with Surabaya. In addition, the study would provide information about the estimation of the unit cost electricity of the rooftop PV system at the present time.
2. University of Surabaya Campus Buildings
first letter of the faculty name, for example, E for economic faculty, F for pharmacy (farmasi in bahasa Indonesia) etc., hence building EA refers to building A of economic faculty and building FB refers to building B of faculty of pharmacy, etc. The buildings are used for various different academically purposes such classrooms, offices, library, laboratories, and canteens. In addition, there are some non-permanent and semi-permanent buildings; however, they were excluded in this study. The 29 considered buildings in this study consist of storey buildings with the condition as shown in Table 1.
The layout of the campus buildings of University of Surabaya orient about 45o from south direction. This layout gives four parts roof and direction, each to North East (NE), South East (SE), South West (SW), and North West (NW) as shown in Fig.1 and Fig.4. The type of the roofs are mainly Hip Roof and subtype Gablet Roof or Dutch Roof [23] which have four sides and directions as shown in Fig.2. All of the roofs tilted at 35o from the horizontal.
Table 1. Storey buildings at University of Surabaya Storey Building Buildings
Two-storey EB. FA. TA. PA. International Village. Canteen
Three-storey TB.ED
Four-storey EA. EC. FB. FC. FD.
FE.HA.HB.TC. TD. TE. TF.PB. PC. PD. PE
Six-storey FF. FG. Library. TG
3. Methodology
3.1 Determination of Efective Roof Surface Area
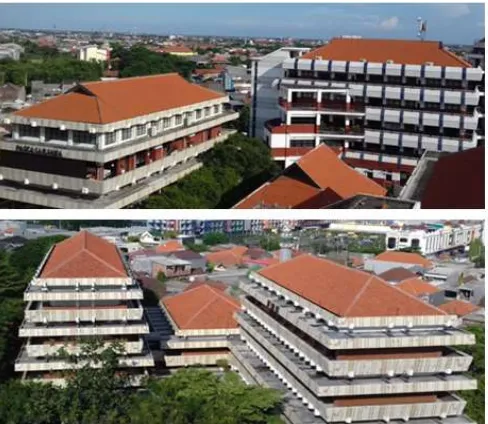
The total area of the campus, as well as the roof surface area of the buildings, is determined using Polygon feature of Google Earth TM. The effective roof area for mounting of PV modules is estimated from maps generated from Google EarthTM by exporting and scaling the map with Google Sketch up software application [24]. Further, solar panels with various dimension and specifications simulated and fit to the roof to determine the effective surface area for PV panels. The library building was used as the representative building in the simulation. A real picture of the library in comparison to the software generated a picture with panels installation on the roof is shown in Fig.3.
Fig. 2. Gablet roof (upper) and Hip roof (lower) types buildings at of University of Surabaya
When coming into the real installation, the detail of real situation on the roof sholud firstly be assessed for each particular building. The considerations are including shading factor due to surrounding obstruction that could come from elevator shafts, HVAC, antennas, and other elements that could interfere with the PV system.
The shading factor is one of the parameters simulated in SolarGIS software. Considering the very small surrounding obstruction within the campus area, the energy lost due to shading factors in this work is expected to be less than 2% of energy production, as proposed in previous similar work [25]
.
3.2 Grid-Connected PV System Simulation
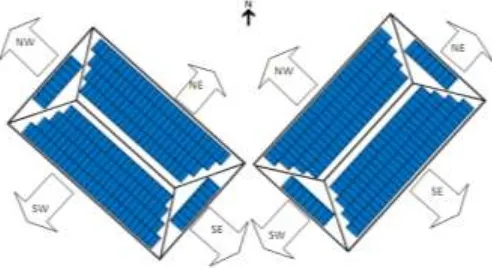
The Grid connected PV system was simulated with the roof-mounted PV panels aligned to the roof tilt and orientation for each building. Theoretical sitting of PV panels for four different roof orientations is graphically shown in Fig.4. Each side of the roof surface is used as much as possible for mounting of PV panels. The type specification of PV panels is based on simulation results in Section 3.1.
Fig. 4. Theoretical sitting of PV panels for different building orientation
Grid Connected PV system is simulated using SolarGIS PV planner [26]. The software uses numerical models that implemented and developed by Geo Model based on 30 minutes time series of aggregated solar radiation and ambient temperature. The main step of the simulation is as shown in Fig.5. The process in the simulation itself is relatively complex.
Before simulating the selected roof, the two parameters need to be set, i.e., technical and site parameters (Fig.5). The software user should provide technical parameters. Otherwise, it will take default values. Site parameters including solar radiation and air temperature are given in the software database for the selected location
.
The process of computation through the implementation of the parameters consists of eight steps [22], [26] as follows:
Step 1: Global in-plane Irradiation; In the first step energy conversion is assumed 100% from global in-plane irradiation at standard test conditions (STC). For a tilted
plane, global irradiation is calculated from related input parameters: global horizontal irradiation, albedo, DNI, and the sun position instantaneously within an interval of 15 minutes.
Step 2: Terrain shading losses; Calculation of reduction global in-inplane is solely based on terrain and PV modules obstruction horizon. Horizon height and SRTM-3 DEM is used in disaggregated calculation shading by terrain. While, shading by surrounding objects such as nearby structures, buildings, and trees are not considered.
Step 3: Angular reflectivity losses; The sun relative position and the plane module are the main factors of losses by angular reflectivity. The accuracy calculation of losses due to angular reflectivity depends on specific properties and cleanness of the surface of PV module.
Step 4: Non-Standard Test condition (STC) losses. The module technologies available in the simulation: Crystalline silicon (c-Si), Amorphous silicon (a-Si), Cadmium telluride (CdTe), and Copper indium selenide (CIS) modules. The c-Si type has the lowest uncertainty of the conversion efficiency prediction [12], [27], [28].
Step 5: DC connection losses; In the computation process, losses due to DC connections need to be input by a user. There are some factors for losses of DC power connections such as a mismatch of inverter size, inappropriate cables, and connections, dust, and dirt on module surface, inter-row shading, etc. The value of losses in total due DC connection is usually set around 5% - 9%.
Step 6: Losses due to DC-AC conversion by an inverter; The efficiency of DC to AC power conversion by an inverter Euro that provided in the simulation ranges from 93% to 95%.
Step 7: Losses due to AC connection and transformers; The losses due to AC connection and transformers depend on the system configuration. A transformer connects the output power from inverter to the grid. The magnitude of losses in this process ranges from 1.5 %– 2.5 %.
Step 8: Downtime failures and maintenance; Output power might be lost during downtime failures and maintenance. It is assumed that from 0.5% to 2% annual PV system energy production is lost due to downtime failures and the system maintenance.
Other technical assumptions; The simulations are run each for four roof directions (SE, SW, NW, and NE) under some following key technical assumptions:
The level of the PV modules degradation is 0.75% annually with a linear rate for 25 years of period. Degradation is due to the components aging and stress by the cycles of the weather.
The modules are installed following the roofs directions and tilted, i.e., 35o from horizontal.
Energy Yield and Performance Ratio; The key performances of a PV system are calculated based on energy output in comparison with the input solar irradiation under operating conditions. Energy yield and performance ratio (PR) are the two performance indices that commonly used in IEC standard to evaluate the performance of a PV system [5], [29]. The energy yield is a comparison of energy output from PV system to maximum power under STC, that can be expressed as
STC P
AC Eout Yield
Energy
max, ,
(1)
where Eout,AC is energy output for A.C current; Pmax, STC
is name plate power under STC. The performance ratio (PR) is defined as the ratio of actual yield, i.e., annual energy output at AC to the target (nameplate) power at DC at standard test condition E, STC. The performance ratio, PR can be expressed as
STC E
AC Eout PR
, ,
(2)
3.3. Greenhouse Gas Emission Reduction
Greenhouse gas (GHG) emission reduction analysis in this study was carried out using RETScreen tools model and simulation. RETScreen is a clean energy management software system for energy efficiency, renewable energy and cogeneration project feasibility analysis. The software is also commonly used to analyze an ongoing energy performance [30]. The software designed by Department of Natural Resources Canada. Further information about the software is available at its official website at www.retscreen.net
3.4. Unit Cost of Electricity
The cost of a grid-connected system is affected by : module cost, balance of system (BOS) cost, system lifetime, discount rate, and operating and maintenance (O&M) cost. The unit cost of electricity generated by PV grid-connected system in this work was matematicaly formulated following the method used by previous work [31], [32][33][34]. The
The levelized annual cost of a grid connected PV system consists of: the annual cost of capital recovery, the annual O&M costs, insurances, taxes, etc. The annual cost of capital recovery in return can be counted as a component of cost of
Cc and capital recovery factor with relation [32]:
If the component cost of annual O&M is assumed as a fraction n of the capital cost, and the component of taxes, insurance, etc., are assumed as a fraction m of the cost of capital cost, the levelized annual cost can be expressed as:
C annual =
From the capacity utilization factor, F, of the PV system, The annual electricity output (annual) can be estimated from PV system capacity utilization factor F with the equation:
Annual = (8,760 x (the PV system at maximum power) x (F)
(6) The equation for unit cost of electricity produced by the grid-connected PV system, Cpv, then can be simplified by
expressing of the total capital of cost Cc as a product of
maximum power and the total cost per peak watt, Cpw. The
equation can be expressed as:
capital cost [%]; and the capacity utilization factor, F, of the PV system [%].4. Results and Discussion
4.1 Solar Energy Availability
Assessment of solar energy potential of a particular location requires the site- specific meteorological data such as solar irradiation, humidity, and temperature. The Sun path in Surabaya (simulated site location) over a year is shown in Fig.6.
The sun path shows the terrain horizon, module horizon, and active area with solar and civil time. The variation of the day length and solar zenith angle yearly in Surabaya area is shown in Fig.7. It is obviously seen that, if obstructed by higher terrain horizon, the period of the Sun is above the horizon is shorter compared to the astronomical day length.
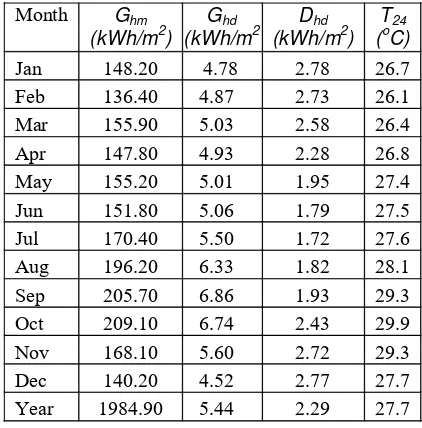
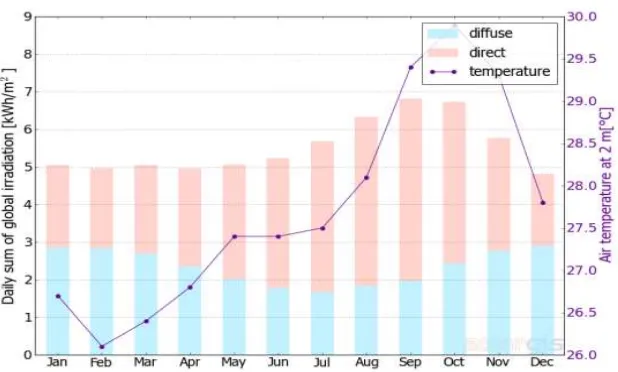
The monthly global in-plane irradiation with component direct, diffuse, and reflected irradiation in Surabaya is shown in Fig.8. The radiation is significantly dominated with diffuse component during November – January, while reflected radiation relatively small throughout the year. The simulation results show that the maximum value of global solar irradiation was 6.86 kWh/m2 during September, and daily average is about 5.44 kWh/m2. While, less solar irradiation is happened during December, with an average of 4.53 kWh/m2.
The summary of monthly sum of global irradiation Ghm, daily sum of global irradiation Ghd, and the daily sum of diffuse irradiation, Dhd in Surabaya, is presented in climate reference - global horizontal irradiation and air temperature in Table 2. The left column of the table shows daily air temperature, T24, which found varies from 26.1 – 29.9 oC
In the past, the global radiation was commonly higher during month April – October than the other months. It can be understood that during this period dry season commonly occurs in this region. Meanwhile, rainy season is during.
Fig. 6. Sun Path over a year in Surabaya
Fig. 7. Solar zenith angle and day length and in Surabaya
December – March which resulted in the lower average solar radiation. However, recently, the season period is likely unpredictable, and further investigation should be attempted for this as it might be closely related not only to the PV application but also to other issues such as global warming or climate change.
4.2 Solar Roof Effective Area
The exact location of the University of Surabaya campus (buildings) as indicated by Google MapsTM is between 7o19’22.98” - 7o19”04.04” South and 112o46’22.02” - 112o22’04.65”East. The total area of land of the campus is about 88,020 m2 with about 1535 m of circumference. The total area of the roofs for all buildings of the University of Surabaya campus was found about 12,280 m2, means that total the area of the roof is 14% of the land. As previously mentioned, it is obviously seen that the roofs for all buildings
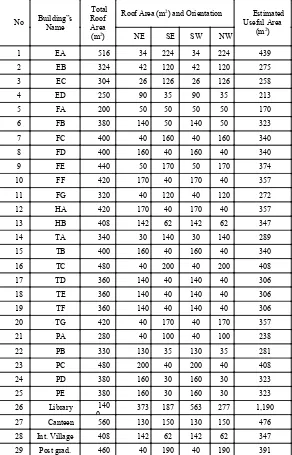
consists of four sides and directions. The area of each side and direction for each building is summarized in Table 3. The total roof area for each directions were found: North East (NE) with 3219 m2 or 26% ; South East (SE) with 2,731 m2 or 22% ; South West (SW) with 3,409 m2 or 29%, and North West (NW) with 2,851 m2 or 23% of total roof area respectively.
Sitting of the PV panels, using an exported and scaled map image with Google Sketch up software for the roofs of the representative building showed that panels installation could place up to 85% of the roof area. The sitting panels are as illustrated in Fig.3. The previous study for the similar type of roof reported that the useful roof surface area for PV panel system is ranging between 78,9% and 97,4% of total roof area [11]. In this simulation work, the value of 85% is No Building”s
Name
Total Roof Area (m2)
Roof Area (m2) and Orientation Estimated
Useful Area (m2)
NE SE SW NW
1 EA 516 34 224 34 224 439
2 EB 324 42 120 42 120 275
3 EC 304 26 126 26 126 258
4 ED 250 90 35 90 35 213
5 FA 200 50 50 50 50 170
6 FB 380 140 50 140 50 323
7 FC 400 40 160 40 160 340
8 FD 400 160 40 160 40 340
9 FE 440 50 170 50 170 374
10 FF 420 170 40 170 40 357
11 FG 320 40 120 40 120 272
12 HA 420 170 40 170 40 357
13 HB 408 142 62 142 62 347
14 TA 340 30 140 30 140 289
15 TB 400 160 40 160 40 340
16 TC 480 40 200 40 200 408
17 TD 360 140 40 140 40 306
18 TE 360 140 40 140 40 306
19 TF 360 140 40 140 40 306
20 TG 420 40 170 40 170 357
21 PA 280 40 100 40 100 238
22 PB 330 130 35 130 35 281
23 PC 480 200 40 200 40 408
24 PD 380 160 30 160 30 323
25 PE 380 160 30 160 30 323
26 Library 140
0 373 187 563 277 1,190 27 Canteen 560 130 150 130 150 476
28 Int. Village 408 142 62 142 62 347
29 Post grad. 460 40 190 40 190 391
assumed. The estimated useful area of the roof buildings is as summarized in the right column in Table 3.
The total PV panels capacity of the roof for all buildings of the University of Surabaya then could be estimated using the obtained numbers of the right column in Table 3 multiplied by 0.85. The calculation showed that, of 12,180 m2 roof area for all buildings, about 10,353 m2 could be used for panels installation with the composition of: 2,736 m2; 2,321 m2; 2,897 m2 and 2,397 m2 respectively for NE, SE, SW and NW roof directions.
Research and development of solar cells technologies resulted in a higher solar energy efficiency conversion. At present time, the efficiency of solar modules commercially in the market ranges from 10% to 25% [35][36], especially for silicon-based solar panels. This means that PV modules can be installed with capacity around 100 Wp – 250 Wp for a 1m2 of roof.
The calculation in this study is done with the assumption that the capacity of the panel is about 200 Wp/m2. By considering the value, the total capacity of the rooftops for PV panels available at the University of Surabaya campus buildings is found about 2,070 kWp or 2.07 MWp. The capacity consists of four roof directions, i.e., 547 kWp, 464 kWp, 580 kWp and 479 kWp respectively for NE, SE, SW and NW roof directions.
4. 3 PV Specific Energy Production
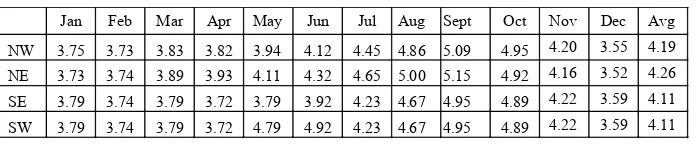
The specific energy production of a crystalline silicon based PV system in Surabaya obtained from simulation is presented in Table 4. In the table Esm refers the monthly sum of specific electricity production in kWh/kWp; while Esd is the daily sum of specific electricity production in kWh/kWp. The result in the table is for each panel orientation, i.e.
azimuth of 315° (NW), 45° (NE), 225° (SW), and 135° (SE). The daily average specific energy production for crystalline silicon panel for each facing direction panels is shown in Table 5. The tilt angle of 35o tilted panels was chosen following the slope of the roof. Changing of PV panel type in simulation parameter resulted in slightly different results. In all cases, the panel facing NE would produce the highest energy. It can be understood as Surabaya is located at South of equator line. Monthly energy production of a grid connected PV system could be estimated using the specific energy production values and the roof panel capacity. Energy Yields annually, as results of energy conversion steps in Section 3.2 and formulated by Eq.1 and Eq. 2 is found slightly different between the four PV rooftop orientations. Energy yield is found about 1525 kWh/kWp; 1549 kWh/kWp; 1494 kWh/kWp; and 1494 kWh/kWp for NE, SE, SW, and NW direction respectively. These correspond to total energy lost of 25.8%; 26.1%; 27.0%; and 26.6% for the respective directions. The total performance ratio as formulated by Eq.2 is found for respective direction as 74.2%; 73.9%; 73.0% and 73.4%.
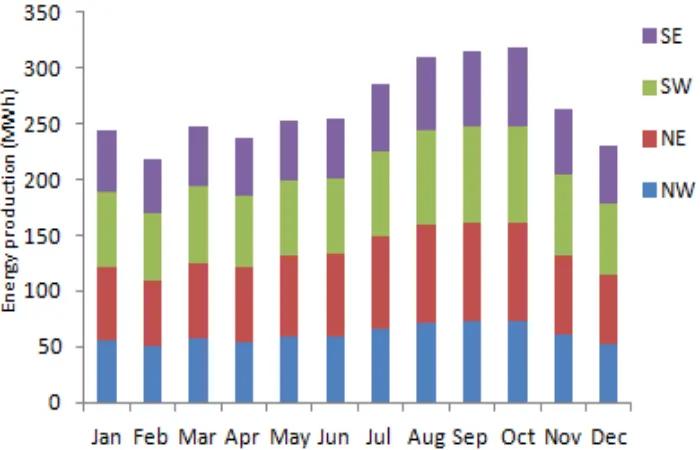
For an optimistic case, where all of the available roof at the university would be installed by PV panels, the monthly energy production would be ranging from 248 MWh to 362 MWh per month as shown in Fig.9. The total monthly energy production comes from the total of roofs facing SE, SW, NE, and NW respectively. The energy productions are after the shading lost of 2% [25], as previously mentioned, has been included in the calculation. The highest energy production is obtained during August – October. This agrees with the period of highest availability of solar irradiation as discussed in Section 4.1. The total annual electricity production from the 2,070 kWp rooftops PV system would be about 3,180 MWh per year.
4.4 Comparison with the Campus Total Energy Demand
The University of Surabaya is powered by an electricity grid at 30,000 kVA with five substations. The electricity network is underground and distributes with 220 V AC voltage . The campus does not have electricity energy meters for each buildings, only in those five substations. The electricity bill is monthly paid by the university through central department of finance and administration.
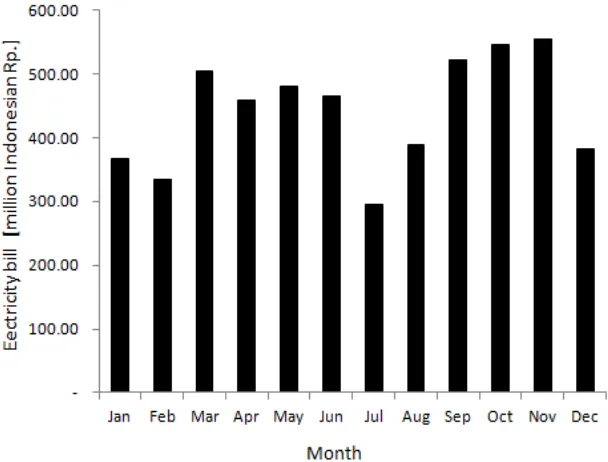
The electricity bill in the period of January – December 2016 as a sum up of the five substations is presented in Fig.10. The energy was used for all electricity needs on the campus such as lighting, air conditioner (cooling), computers, laboratory equipment, elevators, etc. It is obviously seen that the peak load occurred during March – Mei, as well as Sept – November with the maximum bill of Rp. 553.72 million (Indonesian Rupiah). Less energy consumption was during December – February, as well as July – August with the lowest of Rp. 295.88 million. It can be understood that the periods of less energy demand is due to the semester breaks for students. During this period there almost no teaching and laboratory activities as therefore less cooling and laboratory appliances that use energy. Similar energy consumption trends were found for previous years. The electricity bill as shown in Fig.10 was used to calculate the energy demand for the campus, i.e., by dividing the monthly bills by electricity price. At the time of paying the bill, the electricity price in Indonesia was Rp. 1300/kWh. Based the electricity price, it is found that the total monthly
energy demand of the campus (based of the year 2016) varies from 228 MWh (during semester breaks) to 446 MWh during the peak load. Annual energy demand is found about 4,077 MWh per year.
Monthly energy demand in comparison with the monthly energy production by the simulated 2,070 kWp rooftop PV system as discussed in Section 4.3 is presented in Fig.11. Calculation results show that up to 78% of total annual energy demand of the campus can be supplied by the roof top PV system of the campus building. There even some periods, such as July – August, when energy demand can be fulfilled by PV production, as shown in Fig.11.
4.5 GHG Emission Reduction Analysis The project case parameters are shown in Table 6, and GHG emission reduction of 2,070 kWp rooftop PV system ( as the base case) is presented in The analysis result in section 4.3 shows that the proposed project of 2070 kWp rooftop PV system would supply 3,180 MWh of electricity per year. In term of GHG emission, the system would serve as a means of reducing 3,367.6 tons; 2,477.2 tons, or 1,195.7 tons of CO2 to the atmosphere in comparison to the same amount of electricity produced by burning coal, oil or natural gas respectively.
Table 4. Specific Energy production of PV system (in kWh/kWp) in Surabaya with variation of azimuth angle
Month
Table 5. Daily specific energy production in kWh/kWp of Silicon PV
Jan Feb Mar Apr May Jun Jul Aug Sept Oct Nov Dec Avg
NW 3.75 3.73 3.83 3.82 3.94 4.12 4.45 4.86 5.09 4.95 4.20 3.55 4.19
NE 3.73 3.74 3.89 3.93 4.11 4.32 4.65 5.00 5.15 4.92 4.16 3.52 4.26
SE 3.79 3.74 3.79 3.72 3.79 3.92 4.23 4.67 4.95 4.89 4.22 3.59 4.11
Fig. 10. Monthly electricity bill of University of Surabaya year 2016
Table 6. Proposed case rooftop PV system Longitude and latitude -7o19’ long, 112o46’ lat. Heating and Cooling
design value
-21.8 oC and 33.6 oC
Type of system Photovoltaic Capacity 2,070 kWp Electricity exported to
the grid
3,180 MWh
PV modules type mono-si Miscellaneous losses 10% Inverter efficiency 93%
Table 7. Reduction of GHG emission 2,070 kWp rooftop PV system as a base case
Fuel Type
GHG emission Factor
(tCO2/MWh)
Annual reduction of GHG emission (tCO2)
Crude oil equival ence (barrel) Natural
gas 0.376 1195.7 3,346
Oil 0.779 2477.2 690
Coal 1.059 3367.6 9,417
The equivalent of barrel of crude oil not consumed would be 9,417; 690 or 3,346 respectively for coal, oil or natural gas. For the country level, it is obviously seen that the significantly higher rate of reduction of GHG emission could be reached by increasing the percentage of the PV system in the national electricity supply. These measures information
could serve as a means of encouragement to the higher education institutions, as well as government and investors to implement PV system electricity generation and as a consequent high reduction CO2 emission.
4.6. Economic Analysis
The mathematical formula as formulated by Eq. 7 was used to make a numerical calculation to estimate the real unit cost of PV electricity. The following parameter values were considered in numerical calculation: t = 20 years, n = 5%, F
= 20%, and m = 0 and simulated for four scenarios of r i.e., 0.05, 0.10, and 0.15 respectively [30, 33]. As the main component of a grid connected PV system is the solar panels, the unit cost of PV electricity highly depends on the module prices which represented by Cpw in Eq. 7. The unit cost of PV
electricity Cpv (in USD/kWh) with a variation of Cpw is
plotted in a graph as shown in Fig.10. At present time in the market, Cpv ranges from 1 to 2 USD/Wp. With conversion
value from the graph, it is found that Cpw ranges from 0.1 to
0.2 USD/kWh. Currently (per September 2017) electricity price in Indonesia is Rp. 1,600/kWh or around 0.123 USD/kWh, means that at present time the grid-connected PV system would be economically feasible.
The government of Indonesia was recently introduced feed in tariff price system for PV electricity generation [37], however the minimum required capacity is 10 MW, therefore, the system discussed in this work might not be applied for the feed in tariff price policy. However, net metering system has been mandated by which obliges the National Grid (PLN) to credit energy produced by PV system. A customer simply applies installation of a 2-way meter to apply net metering. In this case, the price of electricity from the grid used by a customer would be similar to the price of electricity from PV system exported to the grid.
5. Conclusions
Photovoltaic solar energy simulation of rooftops of University of Surabaya campus buildings in Surabaya, Indonesia has been carried out. The availability of solar
irradiation in Surabaya is relatively high with average irradiation of 5.4 kWh/m2 per day throughout the year. Total area of the roofs of the campus buildings was found about of 12,180 m2. From the total roof area, about 10,353 m2 could be used for panels installation with the composition of 2,736 m2; 2,321 m2; 2,897 m2 and 2,397 m2 respectively for NE, SE, SW and NW roof directions. About 2,070 kWp of panels could be installed on the roof of the campus building with annual electricity production about 3,180 MWh per year. This would supply about 80% of total energy demand of the university. The PV system would serve as a means of reducing 3,367.6; 2,477.2, or 1,195.7 tons of CO2 to the atmosphere in comparison to the same amount of electricity produced by burning coal, oil or natural gas respectively. The equivalent of barrel of crude oil not consumed would be 9,417; 690 or 3,346 respectively for coal, oil or natural gas. The unit cost of electricity generated by PV systems at present time ranges from 0.1 to 0.2 USD/kWh. It is obviously seen that the rooftop PV system seem have the potential to provide power at a competitive cost in comparison to other alternative options of power generation, especially through the technology developments. The results of this study were mainly from simulation work. It is worthwhile to validate the simulation results, e.g. by experiments using a pilot small scale PV system in the real climate condition. However, as the University of Surabaya has a plan to implement a rooftop PV system in the near future (and also for thouse parties who has similar plan), the result of this study would be useful for preliminary consideration.
Acknowledgment
This work is supported by Kementerian Riset Teknologi Dan Pendidikan Tinggi Republik Indonesia through PUPT research grant at University of Surabaya financial year 2016/17.
References
[1] J. M. Pearce, “Catalyzing mass production of solar photovoltaic cells using university driven green purchasing,” Int. J. Sustain. High. Educ., vol. 7, no. 4, pp. 425–436, 2006.
[2] Bruno Borsari, T. Elder, and T. Raynold, “Assessing the educational opportunities from a solar powered cultivator at Slippery Rock University of Pennsylvania,”
Int. J. Sustain. High. Educ., vol. 5, no. 2, pp. 190–198, 2004.
[3] A. A. Merrouni, H. Ait Lahoussine Ouali, M. A. Moussaoui, and A. Mezrhab, “Integration of PV in the Moroccan Buildings: Simulation of a Small Roof System Installed in Eastern Morocco,” Int. J. Renew. ENERGY Res., vol. 6, no. 1, 2016.
[4] G. Chu, H. Wen, Z. Ye, and X. Li, “Design and optimization of the PV-virtual-bus differential power processing photovoltaic systems,” in 2017 IEEE 6th International Conference on Renewable Energy Research and Applications (ICRERA), 2017, pp. 674– 679.
[5] A. Balaska, A. Tahri, F. Tahri, and A. B. Stambouli, “Performance assessment of five different photovoltaic module technologies under outdoor conditions in Algeria,” Renew. Energy, vol. 107, pp. 53–60, 2017. [6] Z. Bouzid, N. Ghellai, M. Benmedjahed, and C. Author,
“Estimation of Solar Radiation, Management of Energy Flow and Development of a New Approach for the Optimization of the Sizing of Photovoltaic System; Application to Algeria,” Int. J. Renew. ENERGY Res. Zakaria Bouzid al, vol. 5, no. 1, 2015.
[7] K. F. Fong, C. K. Lee, and T. T. Chow, “Comparative study of solar cooling systems with building-integrated solar collectors for use in sub-tropical regions like Hong Kong,” Appl. Energy, vol. 90, no. 1, pp. 189–195, 2012. [8] E. Tarigan, Djuwari, and F. D. Kartikasari, “Techno -economic Simulation of a Grid-connected PV System Design as Specifically Applied to Residential in Surabaya, Indonesia,” in Energy Procedia, 2015, vol. 65, pp. 90–99.
[9] D. I. Alvarez, C. J. C. Castro, F. C. Gonzalez, A. L. Uguna, and J. F. T. Toledo, “Modeling and simulation of a hybrid system solar panel and wind turbine in the locality of Molleturo in Ecuador,” in 2017 IEEE 6th International Conference on Renewable Energy Research and Applications (ICRERA), 2017, pp. 620– 625.
[10]T. Huld, M. Šúri, and E. D. Dunlop, “Geographical variation of the conversion efficiency of crystalline silicon photovoltaic modules in Europe,” Prog. Photovoltaics Res. Appl., vol. 16, no. 7, pp. 595–607, Nov. 2008.
[11]J. Ord????ez, E. Jadraque, J. Alegre, and G. Mart??nez, “Analysis of the photovoltaic solar energy capacity of residential rooftops in Andalusia (Spain),” Renew. Sustain. Energy Rev., vol. 14, no. 7, pp. 2122–2130, for the photovoltaic solar energy potential assessment based on available roof surface area: Application to Piedmont Region (Italy),” Sol. Energy, vol. 85, no. 5, pp. 1041–1055, 2011.
[14]H. Awata and T. Yachi, “Electric power leveling of the microgrid system with PV power generation estimation and power demand estimation,” in 2016 IEEE International Conference on Renewable Energy Research and Applications (ICRERA), 2016, pp. 353– 357.
[15]L. K. Wiginton, H. T. Nguyen, and J. M. Pearce, “Quantifying rooftop solar photovoltaic potential for regional renewable energy policy,” Comput. Environ. Urban Syst., vol. 34, no. 4, pp. 345–357, 2010.
distributed photovoltaic electricity production in Israel,”
Renew. Energy, vol. 36, no. 2, pp. 591–594, 2011. [17]V. C. Sontake and V. R. Kalamkar, “Solar photovoltaic
water pumping system - A comprehensive review,” Diaconu, and S. Fara, “Building Integrated Photovoltaic (BIPV)systems in Romania. Monitoring, modelling and experimental validation,” J. Optoelectron. Adv. Mater., vol. 15, no. 1–2, pp. 125–130, 2013.
[20]T. Ma, H. Yang, and L. Lu, “Performance evaluation of a stand-alone photovoltaic system on an isolated island
[22]A. K. Shukla, K. Sudhakar, and P. Baredar, “Simulation and performance analysis of 110 kWp grid-connected photovoltaic system for residential building in India: A comparative analysis of various PV technology,” Energy Reports, vol. 2, pp. 82–88, 2016.
[23]S. Kuchler, “Solar Energy Assesment Based on Weather Station Data for Direct Site Monitoring in Indonesia,” Dalarna University, 2013.
[24]sketchup.com, “3D modeling for everyone | SketchUp.” [Online]. Available: https://www.sketchup.com/. [Accessed: 10-Apr-2017].
[25]H. T. Nguyen and J. M. Pearce, “Incorporating shading losses in solar photovoltaic potential assessment at the municipal scale,” Sol. Energy, vol. 86, no. 5, pp. 1245– 1260, 2012.
[26]SolarGis, “SolarGis PVPlanner,” 2017. [Online]. Available: http://solargis.info/pvplanner. [Accessed: 01-Mar-2017].
[27]A. Orioli and A. Di Gangi, “Review of the energy and economic parameters involved in the effectiveness of grid-connected PV systems installed in multi-storey buildings,” Appl. Energy, vol. 113, pp. 955–969, 2014. [28]N. S. Mubenga, “Grid connected solar photovoltaic in
island states: Challenges, opportunities and waste management,” in 2015 International Conference on Renewable Energy Research and Applications (ICRERA), 2015, pp. 1332–1336.
[29]N. Kahoul, R. Chenni, H. Cheghib, and S. Mekhilef, “Evaluating the reliability of crystalline silicon photovoltaic modules in harsh environment,” Renew.
Energy, vol. 109, pp. 66–72, 2017. economic Simulation of a Grid-connected PV System Design as Specifically Applied to Residential in Surabaya, Indonesia,” Energy Procedia, vol. 65, pp. 90– 99, 2015.
[32]Kandpal T.C. and Garg H.P., Financial evaluation of renewable energy technologies. Macmillan Publishers India Limited, 2003.
[33]R. D. Bingham, M. Agelin-Chaab, and M. A. Rosen, “Feasibility Study of a Hybrid Solar and Wind Power System for an Island Community in The Bahamas,” Int. J. Renew. ENERGY Res., vol. 6, no. 3, 2016.
[34]R. R. Abrao, D. Paschoareli, A. A. Silva, and M. Lourenco, “Economic viability of installations of photovoltaic microgeneration in residencies of a smart city,” in 2017 IEEE 6th International Conference on Renewable Energy Research and Applications (ICRERA), 2017, pp. 785–787.
[35]E. D. D. Martin A. Green1, Keith Emery, Yoshihiro Hishikawa, Wilhelm Warta, “Solar cell efficiency tables,” Prog. Photovolt Res. Appl, vol. 24, pp. 903–913, 2016.
[36]Natural Resources Canada, “RETScreen,” 2017.
[Online]. Available:
http://www.nrcan.gc.ca/energy/software-tools/7465. [Accessed: 14-Sep-2017].
![Fig. 5. Simulation steps in PVplanner [27]](https://thumb-ap.123doks.com/thumbv2/123dok/4003568.1946988/5.595.115.465.330.730/fig-simulation-steps-in-pvplanner.webp)