Seemingly Unrelated Regression Approach for GSTARIMA Model to Forecast Rain Fall
Data in Malang Southern Region Districts
Siti Choirun Nisak
Department of Statistics, Faculty of Mathematics and Natural Sciences, Brawijaya University, Malang, Indonesia
Email: [email protected]
ABSTRACT
Time series forecasting models can be used to predict phenomena that occur in nature. Generalized Space Time Autoregressive (GSTAR) is one of time series model used to forecast the data consisting the elements of time and space. This model is limited to the stationary and non-seasonal data. Generalized Space Time Autoregressive Integrated Moving Average (GSTARIMA) is GSTAR development model that accommodates the non-stationary and seasonal data. Ordinary Least Squares (OLS) is method used to estimate parameter of GSTARIMA model. Estimation parameter of GSTARIMA model using OLS will not produce efficiently estimator if there is an error correlation between spaces. Ordinary Least Square (OLS) assumes the variance-covariance matrix has a constant error 𝜀𝑖𝑗~𝑁𝐼𝐷(𝟎, 𝝈𝟐) but in fact, the observatory spaces are
correlated so that variance-covariance matrix of the error is not constant. Therefore, Seemingly Unrelated Regression (SUR) approach is used to accommodate the weakness of the OLS. SUR assumption is
𝜀𝑖𝑗~𝑁𝐼𝐷(𝟎, 𝚺) for estimating parameters GSTARIMA model. The method to estimate parameter of SUR is
Generalized Least Square (GLS). Applications GSTARIMA-SUR models for rainfall data in the region Malang obtained GSTARIMA models ((1)(1,12,36),(0),(1))-SUR with determination coefficient generated with the average of 57.726%.
Keywords: Space Time, GSTARIMA, OLS, SUR, GLS, Rainfall.
INTRODUCTION
Time series data is data based on the sequence of time within a certain time span and modeled by time series models either univariate or multivariate [1]. If the data consists of the elements of time and space is modeled using multivariate models of space-time. One of the multivariate models are most often used for data modeling space-time is a Generalized Space-Time Autoregressive (GSTAR) model introduced by [2]. GSTAR has limitations that can only be used for data space-time that are stationary and non-seasonal. This condition tends to not be met at the data that is not stationary and containing a seasonal pattern.
GSTARIMA first implemented by Sun, et al. (2010) for forecasting traffic flow data in Beijing. GSTARIMA is the development of GSTAR model for data non-stationary and seasonal. GSTARIMA more flexible and practical for every space observatory has its own real-time parameter and not influenced by other changes in the observation location.
Seemingly Unrelated Regression Approach for GSTARIMA Model to Forecast Rain Fall Data in Malang Southern Region Districts
SUR equations system is used because it can accommodate correlations between space of the rainfall observatories. Parameter estimation of SUR can use the Generalized Least Square (GLS) method. Discussion and implementation of the model GSTARIMA still a bit to do so in this research will be modeling GSTARIMA approach SUR forecasting rainfall data in the region Malang with an observation location Jabung, Tumpang, Turen, Tumpuk Renteng, Tangkilsari, Wajak, Blambangan, Bululawang, Tajinan and Poncokusumo.
LITERATURE REVIEW
GSTAR (Generalized Space Time Autoregressive) Model
GSTAR with order autoregressive (p) and spatial order (𝜆𝑝), or represented by GSTAR
𝒆(𝒕) : error vector with white noise and normal multivariate distribution
GSTARIMA (Generalized Space Time Integrated Autoregressive and Moving
Average) Model
Min, et al. (2010), defines the model GSTARIMA as follows:
∆𝒅𝒛(𝒕) = ∑ ∑ 𝚽𝒌𝒍𝑾(𝒍) order k to autoregressive and moving average, and ∆𝒅𝒛(𝒕) is the observation vector 𝒛(𝒕) in order differencing to d. 𝝓𝒌𝒍and 𝜽𝒌𝒍are autoregressive and moving average parameters on the lag time to spatial lag k and l. 𝑾(𝒍) is the weighted matrix of size N x N and 𝝐(𝒕) is the vector of the residual that is random and normal with size n x 1.
Seemingly Unrelated Regression (SUR)
( Variance-covariance matrix is denoted by Ω.
𝛀 = [
SUR estimation by adding variance covariance matrix residual is stated as follows, 𝜷̂ = (𝑿′(𝚺̂−𝟏⊗ 𝐈
assuming 𝜺~𝑵(𝟎, 𝚺). SUR estimators use the information system more efficient than OLS because of the diversity in each equation is smaller, [3].
The precision model with MSE and R
2Criteria for the good of the model can be determined based on the residual is the Mean Square Error (MSE).
Seemingly Unrelated Regression Approach for GSTARIMA Model to Forecast Rain Fall Data in Malang Southern Region Districts
𝑍̂𝑖(𝑡) : predicted value of 𝑍𝑖(𝑡)
METHODOLOGY
Location of the study is the rainfall observatory stations in the in malang southern region districts. The stations are Tumpang, Wajak, Tajinan, Jabung, Poncokusumo, Turen, Tumpuk Renteng, Tangkilsari, Blambangan, and Bululawang. Data used is 10 days period of rainfall (dasarian) since the beginning of the dry season is determined based on the amount of rainfall in a single dasarian (10 days) of less than 50 mm and is followed by several subsequent dasarian. Meanwhile, the beginning of the rainy season is determined based on the amount of rainfall in a single dasarian (10 days) is equal or more than 50 mm and is followed by several subsequent dasarian [4].
Rainfall data used to build GSTARIMA-SUR model is a sample data for forecasting (insample). The insample data is dasarian rainfall data for the period may 2000 to April 2015. The other data is called outsample data that is used to validate the GSTARIMA-SUR models of the data in the period May-June 2015.
Steps taken to form GSTARIMA-SUR model is started by exploration of rainfall data in the ten rainfall observatory stations, identification of univariate model (ACF and PACF) and multivariate model (MPACF and MCCF) to determine the order GSTARIMA, determination parameters of the model, model validation, and the last is forecasting rainfall data in the malang southern region districts and the surrounding region.
RESULTS AND DISCUSSION
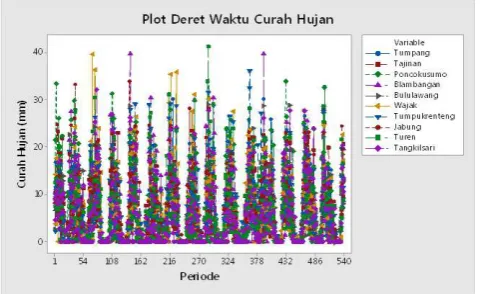
Exploration data is used to easy for viewing the information on the data. exploration data can be presented in the form of graphs and descriptive data. Graph data movement precipitation 10 locations this year May 2000 to April 2015 is shown in the form of a time series plot as in Figure 4.1 below.
Figure 4.1. Time series Plot of Rainfall data
Based on Figure 4.1, known that movement pattern of rainfall data in 10 locations tend to be similar. High and low altitude change of rainfall data recorded in each period indicates the same pattern every year.
Estimation of parameters is done by inserting a weighted into the equation to describe the spatial relationship between the location of the post of rain. The weight of the locations used in this study is the inverse distance weighting location.
Table 4.1 Inverse Distance Weighted Value 10 Pos Rain
GSTARIMA-SUR models for rainfall in the Malang southern region districts can be expressed as follows:
𝒁(𝒕) = 𝚽𝟎𝟏(𝟏)𝒁(𝒕 − 𝟏) + 𝚽𝟏𝟏(𝟏)𝑾𝒁(𝒕 − 𝟏) + 𝚽𝟎𝟏(𝟐)𝒁(𝒕 − 𝟏𝟐) + 𝚽𝟏𝟏(𝟐)𝑾𝒁(𝒕 − 𝟏𝟐) + 𝚽𝟎𝟏(𝟑)𝒁(𝒕 − 𝟑𝟔)
+ 𝚽𝟏𝟏(𝟑)𝑾𝒁(𝒕 − 𝟑𝟔) + 𝒆(𝒕) − 𝛉𝟎𝟏(𝟏)𝒆(𝒕 − 𝟏) + 𝛉𝟏𝟏(𝟏)𝑾𝒆(𝒕 − 𝟏)
Based on the results of parameter estimation GSTARIMA ((1)(1,12,36),(0),(1))-SUR to Tumpang rain post is as follows:
𝑧̂1(𝑡) = 0.236𝑧1(𝑡−1)+ 0.102𝑧2(𝑡−1)+ 0.038𝑧3(𝑡−1)+ 0.024𝑧4(𝑡−1)+ 0.015𝑧5(𝑡−1)+ 0.007𝑧6(𝑡−1) + 0.05𝑧7(𝑡−1)+ 0.026𝑧8(𝑡−1)+ 0.037𝑧9(𝑡−1)+ 0.041𝑧10(𝑡−1)+ 0.026𝑧1(𝑡−12) + 0.009𝑧2(𝑡−12)− 0.017𝑧3(𝑡−12)+ 0.003𝑧4(𝑡−12)+ 0.005𝑧5(𝑡−12)− 0.004𝑧6(𝑡−12) + 0.005𝑧7(𝑡−12)− 0.002𝑧8(𝑡−12)− 0.004𝑧9(𝑡−12)+ 0.001𝑧10(𝑡−12)+ 0.147𝑧1(𝑡−36) + 0.121𝑧2(𝑡−36)+ 0.023𝑧3(𝑡−36)+ 0.007𝑧4(𝑡−36)+ 0.006𝑧5(𝑡−36)+ 0.02𝑧6(𝑡−36) + 0.029𝑧7(𝑡−36)+ 0.014𝑧8(𝑡−36)+ 0.022𝑧9(𝑡−36)+ 0.019𝑧10(𝑡−36)+ 𝑒1(𝑡) + 0.081𝑒1(𝑡−1)+ 0.009𝑒2(𝑡−1)+ 0.019𝑒3(𝑡−1)+ 0.002𝑒4(𝑡−1)+ 0.004𝑒5(𝑡−1) − 0.005𝑒6(𝑡−1)+ 0.011𝑒7(𝑡−1)+ 0.012𝑒8(𝑡−1)+ 0.003𝑒9(𝑡−1)+ 0.015𝑒10(𝑡−1)
Rainfall in the Tumpang Rain Post is influenced by the rain heading more in ten days and twenty days earlier and was influenced by weighting the location. In addition there is seasonality in the rainfall in the period a quarter of the year and annually.
Based on the above model prediction results can be obtained in the data sample for the Tumpang rain post as follows:
Figure 4.2 Forecasting using GSTARIMA((1)(1,12,36),(0),(1))-SUR in Tumpang Rain Post
Pos Hujan turen tumpuk
renteng wajak tumpang jabung
poncokus
umo bululawang tajinan tangkilsari blambangan
turen 0 0.286 0.140 0.057 0.044 0.068 0.103 0.087 0.092 0.122
tumpuk renteng 0.226 0 0.179 0.055 0.041 0.067 0.111 0.098 0.101 0.121
wajak 0.123 0.200 0 0.082 0.055 0.118 0.097 0.130 0.103 0.090
tumpang 0.059 0.073 0.097 0 0.191 0.223 0.075 0.128 0.090 0.064
jabung 0.063 0.074 0.089 0.260 0 0.141 0.083 0.121 0.097 0.072
poncokusumo 0.072 0.090 0.141 0.227 0.105 0 0.078 0.129 0.090 0.069
bululawang 0.068 0.093 0.073 0.048 0.039 0.049 0 0.115 0.280 0.235
tajinan 0.069 0.099 0.117 0.098 0.068 0.097 0.138 0 0.218 0.097
tangkilsari 0.062 0.087 0.080 0.059 0.046 0.058 0.288 0.187 0 0.133
Seemingly Unrelated Regression Approach for GSTARIMA Model to Forecast Rain Fall Data in Malang Southern Region Districts
Inspection accuracy of the model or the model validation is done by looking at the value of RMSE and R2 of the model.
Table 4.2 Accuracy Test Model of GSTARIMA ((1),(1,12,36)(0)(1))-SUR Model in ten Rain Post
Location RMSE R2Prediction
Tumpang 5.668 0.5052
Tajinan 5.51 0.5716
Poncokusumo 5.916 0.5146 Blambangan 5.697 0.5935 Bululawang 5.175 0.5805
Wajak 5.899 0.5136
Tumpuk Renteng 6.007 0.6476
Jabung 5.337 0.5671
Turen 6.119 0.6308
Tangkilsari 5.263 0.6481
R2prediction for 10 observation locations is more than 50%. The greater the value of R2 prediction obtained the greater, model can explain the rainfall distribution. The biggest prediction of R2 is Tangkilsari, that is equal to 0.6481. It can meaned that about 64.81% in Tangkilsari rainfall distribution can be explained by the model GSTARIMA ((1), (1,12,36) (0) (1))-SUR.
The lowest R2 prediction is in Tumpang Area rainfall, but the prediction obtained R2 can still be said to be good for rainfall prediction for prediction obtained R2 values> 50%. If viewed from the RMSE and R2 prediction can be said that the rainfall distribution in ten observation locations have the same result by using modeling GSTARIMA ((1) (1,12,36) (0) (1))-SUR.
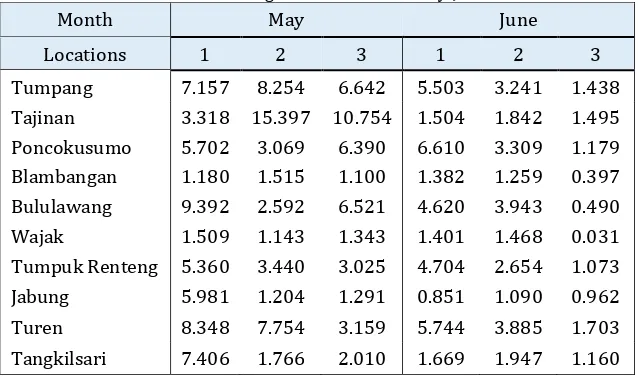
Result forecast rainfall using GSTARIMA ((1),(1,12,36)(0)(1))-SUR model is:
Table 4.3 Forecasting Rainfall Period of May-June 2015
Month May June
Locations 1 2 3 1 2 3
Figure 4.3 Forecast for Period May-June 2015 in Malang Southern Region Districts
Model validation is done by comparing the actual data of rainfall dasarian the period from May to June 2015 on the results of data using models forecasting GSTARIMA ((1),(1,12,36)(0)(1))-SUR. If seen from Figure 4.3 can be said that result of forecasting data can approach the actual data. To better know the data equation then done two paired samples t test. Based on the results of two sample paired t test obtained by value t amounted to 1,958 with significant value 0095. t table with db = 59 values obtained 2,301, for t <t table (1.9585 <2,301) and the p-value is more than 0.05 (0095> 0.05) it was decided to accept H0. The conclusion of this validation test is that the rainfall dasarian data forecasting results do not differ significantly from the actual data, so the model GSTARIMA-SUR formed from in sample data can be used for forecasting rainfall dasarian next period.
CONCLUSION
Our analysis found that the GSTARIMA ((1)(1,12,36)-SUR model can be used to forecast the dasarian seasonal rainfall in the Malang Southern Region Districts. By using seasonal patterns in lag 1,12,36 more accurate forecasting result is obtained. To validate the model, MSE and R2 prediction can be used. In this research, the largest R2 prediction is 57.726%.
REFERENCE
[1] J. Rosadi, Pengantar Analisis Runtun Waktu, Diktat Kuliah, Program Studi Statistika, Fakultas Matematika dan Ilmu Pengetahuan Alam, Universitas Gajah Mada, Yogyakarta, Universitas Gajah Mada, 2006.
[2] S. Borovkova, H. Lopuhaa and B. Ruchjana, "Generalized STAR model with experimental weights," in
Proceedings of the 17th International Workshop on Statistical Modelling, 2002.
[3] H. R. Moon and B. Perron, "Seemingly unrelated regressions," The New Palgrave Dictionary of Economics, pp. 1-9, 2006.
[4] BMKG, Modul Diklat Badan Meteorologi Klimatologi dan Geofisika Karangploso Malang, BMKG, 2000. [5] A. Zellner, "An efficient method of estimating seemingly unrelated regressions and tests for aggregation
bias," Journal of the American statistical Association, vol. 57, no. 298, pp. 348-368, 1962.
[6] P. E. Pfeifer and S. Jay Deutsch, "Stationarity and invertibility regions for low order starma models: stationarity and invertibility regions," Communications in Statistics-Simulation and Computation, vol. 9, no. 5, pp. 551-562, 1980.
Seemingly Unrelated Regression Approach for GSTARIMA Model to Forecast Rain Fall Data in Malang Southern Region Districts