V. Kumar, J. Andrew Petersen, & Robert P. Leone
Defining, Measuring, and Managing
Business Reference Value
It is common for business-to-business firms to use references from client firms when trying to influence prospects to become new customers. In this study, the authors define the concept of business reference value (BRV) as the ability of a client’s reference to influence prospects to purchase and the degree to which it does so. They develop a three-step method to compute BRV for a given client using a retrospective reported measure of reference value. Next, they use data from a financial services and a telecommunications firm to identify and empirically test the drivers of BRV. These drivers fall into four categories: (1) length of client relationship, (2) client firm size, (3) reference media format, and (4) reference congruency. Next, the authors empirically show that clients that have the highest BRV are not the same as the clients that have the highest customer lifetime value. They also show that an average client that is high on BRV has significantly different characteristics from the average client that is low on BRV. Finally, they derive implications for managing BRV.
Keywords: client references, business reference value, customer lifetime value, business-to-business marketing
V. Kumar is Professor of Marketing, the Richard and Susan Lenny Distin-guished Chair in Marketing, the Executive Director of the Center for Excel-lence in Brand & Customer Management, and the Director of the PhD Program in Marketing, J. Mack Robinson School of Business, Georgia State University (e-mail: [email protected]). J. Andrew Petersen is Assistant Professor of Marketing and the Assistant Director for the Center of Inte-grated Marketing and Sales, Kenan-Flagler Business School, University of North Carolina at Chapel Hill (e-mail: [email protected]). Robert P. Leone is Professor and J. Vaughn and Evelyne H. Wilson Chair of Mar-keting, Neeley School of Business, Texas Christian University (e-mail: r.leone@ tcu.edu). The authors thank the anonymous financial and the telecommunication companies for providing access to the data used in this study. They thank participants at 2012 New Developments in the prac-tice of Marketing Science Conference in Washington, DC, for providing valuable comments on a previous version of this article. They thank Renu for copyediting a previous version of the manuscript. Rajdeep Grewal served as area editor for this article.
M
any firms are trying to capitalize on the power of client reference behavior as part of their general marketing and sales efforts to encourage new cus-tomer adoption. For business-to-business (B2B) firms espe-cially, the use of referencing behavior is often the only alternative for leveraging the value of current clients on new customer adoption through social influences. For B2B firms, the use of referencing behavior is important because, unlike for business-to-consumer (B2C) firms, the purchase decision process often does not rely on other social influ-ences such as word of mouth (WOM) or referrals from other businesses. For example, Microsoft has created a Cus-tomer Reference Program to influence prospects to adopt their products and services.1The firm does so by directing prospects to a website that contains case studies and white papers from a sample of current clients, selected byMicrosoft to represent what its sales executives believe are the best examples of successful implementations of Microsoft products and services. These case studies serve as references from current clients that Microsoft uses to influence prospects to adopt.
To date, there has been limited research explaining the social influences present in B2B settings (Libai et al. 2010). Therefore, it is not yet clear how seller firms can quantify the value that these references provide, whether seller firms are able to determine which clients are likely to be the most valuable references for new customer acquisition, or which reference formats are the most effective at influencing prospects to adopt. In this study, we focus on further under-standing the role and value of client references, specifically in a B2B selling context. We aim to answer the following four key research questions:
1. Can we measure the value of a business reference from a client?
2. What are the key drivers, both in terms of the referencing client and the format of reference, of the value of the reference?
3. Are clients that generate valuable references the same ones that are the most profitable in terms of their own purchasing behavior to the seller firm?
4. What types of clients tend to generate high-value references?
Our first step before we begin to answer these four questions is to determine how business references play a role in the adoption of prospects in a B2B setting. We do so by leveraging the rich literature in marketing on the buying processes of B2B firms and through qualitative interviews with managers from B2B firms who are directly involved in making purchase decisions with their respective firms. We use the literature review and the qualitative interviews to develop a conceptual model of the drivers of reference selection (which client to select as a reference) and refer-ence value (how much business the referrefer-ence will bring in 1For an example of Microsoft’s Customer Reference Program,
monetary value). In addition, we hypothesize how each of these drivers is likely to affect the process of selection and value of the reference.
Then, to empirically answer the four key questions, we use data from a B2B financial services firm and a telecom-munications firm that focus on selling products and services to mainly small to medium-sized businesses, for which the purchase situations tend to be simple. Examples of these products and services include business checking/savings (financial services) and commercial/business landline tele-phone service (telecommunications). (For a more detailed list of product categories, see the Web Appendix at www. marketingpower.com/jm_webappendix.) We focus specifi-cally on these two firms’ customer acquisition efforts in which none of the potential client firms had purchased from the focal selling firms or, likely, from any of the firms’ com-petitors. This means that the potential client firms may have some general product category experience, which includes any personal experience using financial services and telecommunications products and services, but none of the potential client firms would have any specific product or focal firm experience in this context to rely on in the pur-chase situation. Given the churn faced by many B2B firms that rely on generating new customers, this is a common sit-uation and makes using references a key part of the potential client firm’s decision to adopt. In addition, most of these small to medium-sized potential client firms likely have few key decision makers, making it easier to obtain accurate information regarding the influence of references on adop-tion. In addition, the selling firms use some other selling and marketing efforts, including product brochures, some general branding efforts on the firms’ websites, and a sales force that calls on potential client firms, providing some potential variance in the effect of references on adoption.
Thus, this study makes three key contributions to the marketing literature. First, we define the concept of busi-ness reference value (BRV), which is the ability of a client’s reference to provide monetary value to the seller firm by influencing a prospect to adopt and the degree to which it does so. We measure the BRV of each referencing client and the customer lifetime value (CLV) of each referencing client and newly acquired client from the prospect pool. To do this, we develop a new three-step method for computing BRV using a retrospective reported measure of reference value, which includes information about how much each reference influenced each prospect to purchase and the value of the new customer.
Second, we empirically determine the key drivers of BRV using data from the two selling firms in this study. We find that the characteristics of the referencing client, the characteristics of the prospect, and the characteristics of the reference are all significant predictors of reference selection and/or BRV. These key drivers include length of client rela-tionship, client firm size, reference congruency, and refer-ence media format. These results help us better understand which references are likely to be most effective in convert-ing prospects to clients.
Third, we deconstruct the measure of BRV to determine the role of each of the three measures (Refn, DOIin, and
CLVn) in driving BRV. We find that, in general, most firms that were acquired during the sales process were highly influenced by references in making their decisions (high Refn). We also find that many of these firms only relied on a few references in making their decisions (low number of firms with positive DOIin). Finally, we find a significant variance in the profitability of the newly acquired cus-tomers (high variance in CLVn), suggesting that references influence low- and high-value customers to adopt.
Theoretical Foundations
Literature Review
Business-to-business firms’ decision to purchase, when compared with B2C firms, is often more complex and drawn out. This is because purchases made by organizations tend to rely on many different employees within the organization (i.e., a buying center) and on budget, cost, and profit consid-erations (Webster and Wind 1972). As a result, seller firms’ sales endeavors are often multidimensional and can include both personal and impersonal sources along with commer-cial and noncommercommer-cial sources (Moriarty and Spekman 1984). Seller firms can influence the organizational buying decisions of prospects through different sources, timing, and quality of information. Moriarty and Spekman (1984) offer empirical evidence showing that the seller firm uses personal noncommercial information sources such as social influences (e.g., references) throughout the decision process. These influences can become most important dur-ing the later stages of the buydur-ing process and often can be what distinguishes one company from another becoming the “order winner.” Although not empirically tested in the literature, this suggests that seller firms that employ refer-ences during the sales process can significantly influence an organizational buyer’s decision to make a purchase.
During the organizational buying decision process, there are four key drivers that affect the prospect’s propen-sity to adopt: (1) firm-initiated efforts (e.g., direct/mass communication), (2) competitor-initiated efforts (e.g., com-petitor direct/mass communication), (3) client-initiated efforts (e.g., references), and (4) prospect characteristics (e.g., demographics) (Prins and Verhoef 2007; Reinartz, Thomas, and Kumar 2005; Villanueva, Yoo, and Hanssens 2008). Because the objective of this study is to investigate how client-initiated efforts influence B2B prospects to make a purchase, we focus specifically on the research that explains the relationship between client-initiated efforts and customer adoption for organizational buyers, which is rela-tively scarce (Libai et al. 2010).
power of WOM for the purposes of enhancing customer acquisition.
Hada, Grewal, and Lilien (2011) show through a mixed-design experiment how supplier firms make trade-offs when selecting references for prospects. They find that increasing the similarities between the client and the prospect provides significant benefit to the manager’s evaluation of the referral. Although this study relates directly to a B2B context, the outcome these authors are interested in is manager evaluation of the reference, whereas in our study, we are interested in determining the value of the reference to the seller firm.
Stephen and Toubia (2010) analyze a group of online social commerce networks, in which the networks involve individual sellers linking their online marketplace with other sellers, creating a virtual mall. The authors find that allowing sellers to connect with each other provides signifi-cant economic value, especially to those whose accessibil-ity is most enhanced by the network. Although this study analyzes social connections between sellers, it is focused on firms that are trying to become more effective at selling products and services to end consumers.
Godes (2012) uses an analytical model to uncover the benefits to early and late adopters as a result of the seller firm announcing a referencing program. He finds that one of the key benefits of announcing a referencing program is that early adopters are willing to pay more because of the increase in information transmission and information trans-parency—a benefit for late adopters as well. Thus, the refer-encing program can be viewed as a substitute for an exclu-sive use contract. While Godes shows that referencing programs do add value, he does not suggest how seller firms should select and use client firm references to maxi-mize profitability.
Thus, while there have been several studies that gener-ally analyze some aspects of social influence on organiza-tional purchase decisions, we know of no study that has specifically investigated how selling firms can understand how to use client references to effectively drive customer acquisition and how to value those client references, a key contribution of this study.
Qualitative Interviews
To better understand the role of references in the organiza-tional buying process, we conducted qualitative interviews with 26 executives from small to medium-sized businesses who play a key role in the purchase decision making for their respective firms. These executives participated in a sales and marketing workshop organized by an executive education forum in the southeast United States over two days. On Day 1, we interviewed 14 executives, and on Day 2, we interviewed 12 more executives. Each interview lasted for approximately 30 minutes and was conducted individually. The same person conducted all the interviews. The objective of these qualitative interviews was to deter-mine whether the executives believe that references influ-ence their decision making. In addition, when they make purchase decisions, we asked to what extent references influence the decision to purchase when compared with the
other marketing and sales efforts. Finally, we asked at what point during the purchase process the references had an impact on the decision to purchase. We selected these executives for the qualitative interviews because many rep-resented small to medium-sized businesses similar to the potential client firms being targeted by the focal firms in our empirical application.
The results from our analysis of the qualitative inter-views suggest that references play a key role in the pur-chase decision process for many of these organizations. Indeed, our qualitative interviews show that many man-agers from these businesses rely on references throughout the purchase decision process, especially just before the buying decision is made. As one manager from the buying firm noted,
The list of references provided by the seller helps us to shortlist the seller firms. However, to finally decide on whom to buy from, we check at least a couple of refer-ences provided by the seller shortly before our purchase decision. We also discuss internally as to how much influ-ence the referinflu-ences had on our buying decisions.
The results of the interviews with the executives also suggested that those references that provided the most value in influencing the purchase decision were those from repu -table firms; had the highest similarities to the buyer firm (whether it was in terms of products or services purchased, industry of the referencing client, or job function of the ref-erencing client); and were provided through richer media formats.
We also interviewed 12 B2B managers from the sup-plier firms about the use of references by their prospective clients. According to the chief executive officer of Pinnacle Promotions (who represents the typical sentiments of the remaining respondents),
Our clients use the list of references we provide to reduce the choice of suppliers. Once we get into the decision-making stage, our participants ask us [for] specific refer-ences. We provide access to multiple forms of references, different types of clients, and different job descriptions of the person providing the reference. Our prospects are free to choose whichever reference they like to pursue.
We used the results of these qualitative interviews to help guide the development and empirical testing of our concep-tual model.
Conceptual Framework and
Hypothesis Development
alliances that the seller firm has built (Gulati and Gargiulo 1999). Moreover, the strength of these current alliances depends on the “trusted informants” (or references) pro-vided by the seller firm and the degree to which those infor-mants are embedded in the seller firm. In addition, the abil-ity of the information transferred from the trusted informant to the potential client firm to be understood and relatable depends on the richness of the communication and the degree to which the information provided is similar to the business situation the potential client firm faces. Thus, seller firms should select trusted informants to pass along the most valuable information to potential client firms.
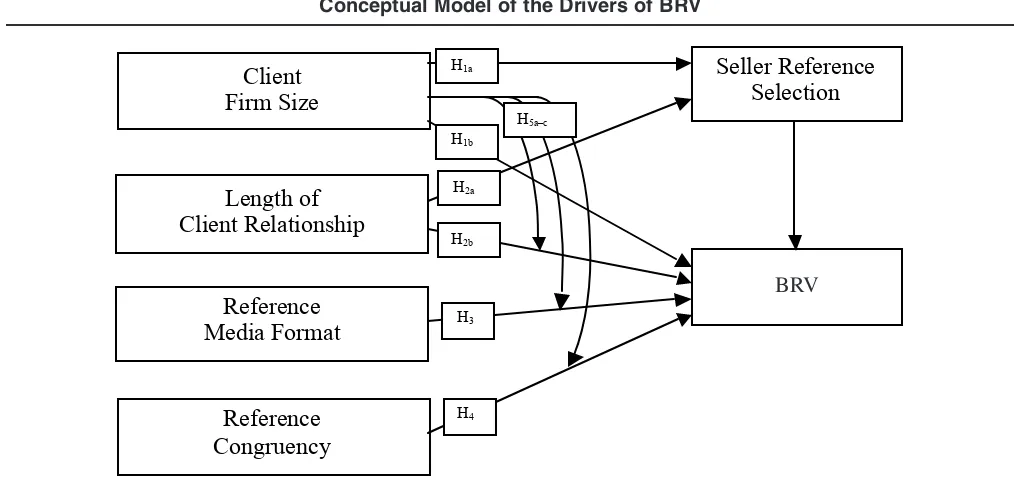
From this discussion, we believe that there are four key drivers of reference selection and reference value: (1) the degree to which the client firm can be viewed as a trusted informant through client firm size, (2) the degree to which the client firm has built a strategic alliance with the seller firm through length of client relationship, (3) the ability of the communication to convey information to the potential client firm through reference media format, and (4) the degree to which the information provided is relatable to the potential client firm through reference congruency. Figure 1 shows a graphic representation of these drivers.
During the sales process, it is common for many B2B firms to use references from clients as a tool to influence a prospect to adopt a product/service. Thus, the process of using references to influence the purchase process breaks down into two distinct steps. First, the seller firm selects the clients in its current database to act as references to be used during the sales efforts. Second, the sales force uses the ref-erences to influence the prospects to adopt. We anticipate that these prospects will evaluate the value of the reference on the basis of several key characteristics.
In the next section, we develop the hypotheses related to the drivers of reference selection and BRV. We anticipate
that differences in the referencing client characteristics will affect the reference selection strategy of the seller firm. We also anticipate that the reference selection strategy, the ref-erencing client characteristics (in terms of firm size and relationship length), the reference media format, and refer-ence congruency with the prospect will drive the BRV.
Client Firm Size
To use client references to influence prospect adoption, the first step a seller firm must take is to select which firms from its current client database are the best candidates to be references. We anticipate that seller firms select these clients strategically to maximize the impact of the influence of the reference. The seller firm aims to reduce the informa-tion cost of search and informainforma-tion asymmetry, with the goal of making the decision to purchase easier for the prospect (Spence 1973). Reducing information asymmetry by providing information that is not otherwise available (i.e., prospects cannot experience the benefits of the product or service until adoption) at a relatively low cost (e.g., through a reference) can be an effective signaling strategy (Connelly et al. 2011). In addition, this information is likely more valuable when the firm is trusted or has a good repu-tation in the marketplace (Morgan and Hunt 1994). More-over, large firms tend to receive more public scrutiny than small firms (Fombrun and Shanley 1990). However, even if this information does not always put the firm in a positive view, the mere availability of information about and famil-iarity with large firms tends to inflate people’s opinion of the larger firms’ activities (Tversky and Kahneman 1974). As a result, we expect that current client firms whose attri -butes are visible in the marketplace and are perceived as valuable to the marketplace (e.g., significant size) are more likely to provide an effective reference to prospects through their reputation. Here, we define “client firm size” as the
FIGURE 1
Conceptual Model of the Drivers of BRV
!
Client
Firm Size
Reference
Media Format
Reference
Congruency
Seller Reference
Selection
Business
Reference Value
(
)
H3
Length of
Client Relationship
H2a
H4 H2b H1b H1a
H5a–c
size of the firm in the marketplace, whether it is based on labor force or scale of operations. As a result, we expect that it is in the best interest of the selling firm to strategi-cally select larger client firms to be references. Thus:
H1a: Seller firms are more likely to select larger client firms to
be references than smaller client firms.
When consumers rely on external information to help in purchase decisions, they often rely on the credibility of the source as well as the information that is being passed along (Gershoff, Broniarczyk, and West 2001). The source of the reference offers a signal to the prospect about the type of firms that currently purchase from the selling firm (Herr, Kardes, and Kim 1991). Research has shown that the credi-bility of the source of the WOM in both B2C and B2B cases matters (Wangenheim and Bayón 2007). In addition, in many instances, especially those such as celebrity endorse-ments (McCracken 1989), the perceived value of the prod-uct or service is directly tied to the source. Research has also shown through interviews with managers that source often plays a significant role in the effectiveness of business references (Godes 2008). Moreover, recent research has suggested that the value of the client firm’s reputation is often passed along to the seller firm through the reference (Helm and Salminen 2010), where higher reputations tend to be linked to larger firms (Tversky and Kahneman 1974). Thus, we anticipate that the client featured in the reference provides a valuable signal to the prospect merely through its identity in the marketplace, such that larger current clients offer a positive signal to prospects about the quality of the products or services and the quality of the selling firm. Thus:
H1b: Among the client firms selected as references, larger firms
are more likely to have higher BRV than smaller firms.
Length of Client Relationship
We expect seller firms to strategically select client refer-ences according to the level of embeddedness the client has with the seller firm, where the embeddedness is often stronger when the relationship between the seller and client firm is longer. Here we define length of client relationship as the total expected time of the relationship between the seller and client firm, which includes not only the length of the past relationship but also the expected length of the future relationship. The structure and quality of ties between the referencing client and the seller firm, where a more integrated structure and a higher quality relationship lead to higher expectations of relationship length. Research has shown that longer relationships between organizations increase the likelihood of new product selection (Kaufman, Jayachandran, and Rose 2006). To relate this research to reference selection, it suggests that firms with longer rela-tionships are more likely to be selected as client references. However, research on buyer–seller relationships indicates that overembeddedness (too much relationship length and depth) actually creates a dark side to relationships (Wuyts and Geyskens 2005), suggesting that seller firms are most likely to select clients with a moderate level of relationship length as references. Thus:
H2a: Seller firms are more likely to select client firms that have a longer relationship with the seller firm to a thresh-old (an inverted U shape) to be references than client firms with a shorter relationship with the seller firm.
We also anticipate that the client’s behavior with the seller firm in particular, and not just its firm size, can signal to the prospect about the quality of the seller firm. For example, Heide and John (1990) find that prospects can view a closer relationship between a seller firm and current client as a way to reduce the ambiguity of purchase. How-ever, research in the management literature also suggests that overembeddedness beyond a certain threshold can be problematic because it may indicate to the prospect that the referencing firm is unfamiliar with potential alternatives (Uzzi 1997). As a result, we anticipate that the longer the relationship between the referencing client and the seller firm, the more positive (to a threshold) the signal will be to the prospect. Thus:
H2b: Among the client firm firms selected as references, those with a longer relationship with the seller firm to a thresh-old (an inverted U shape) are more likely to have a higher BRV than client firms with a shorter relationship with the seller firm.
Reference Media Format
Research has shown that the way the content is delivered and the quality of the information of any marketing com-munications can play a significant role in for industrial pur-chasing (Moriarty and Spekman 1984). Thus, the medium and specific format of the reference should also play a key role in determining the value of the reference. We define “reference media format” as the type of reference provided such that different media formats change (1) the amount of information that can be conveyed and (2) the amount of uncertainty of the message content that can be alleviated (Daft and Lengel 1986). For example, research has shown that richer modes of communication are more likely to influence customers to purchase (Venkatesan and Kumar 2004) because they are perceived to have more valuable information content, convey a greater effort by the firm to communicate with the consumer, and potentially provide a more customizable opinion from the client. We anticipate that a reference that provides information in a richer media format is likely to be more effective in influencing a prospect to purchase. Thus:
H3: The media format of the reference affects the BRV of
client firms such that client firms that provide references in a richer media format are more likely to have a higher BRV than clients that provide references in a less rich media format.
Reference Congruency
prod-ucts or services, or even references from people who hold the same role within their firm (e.g., marketing, operations). Recent research has shown that sellers can benefit from selecting specific referrals for prospects that have a high level of congruency (Hada, Grewal, and Lilien 2011). This homophily between the client providing the reference and the prospect is likely to generate trust and reciprocity (Goldenberg et al. 2009) and strengthen the bond (i.e., tie strength) between the two parties (Brown and Reingen 1987). As a result, we anticipate that references from clients with greater congruency with the prospect are more influen-tial in getting the prospect to adopt. Thus:
H4: Client firms that provide references that have a higher degree of congruency with the prospect firm are more likely to have a higher BRV than client firms that provide references that have a lower degree of congruency.
The Incremental Benefit of Firm Size
Research on commitment and trust suggest that when both commitment and trust are present, “they produce outcomes that promote efficiency, productivity, and effectiveness” (Morgan and Hunt 1994, p. 22). We predict that larger firms are a more trusted reference in terms of a stronger signal of quality to the prospect. This suggests that not only should larger firms send a positive signal to the prospect, which serves to reduce the uncertainty of the purchase decision, but they should incrementally strengthen the other drivers of the value of the reference. Thus, after controlling for the main effect of firm size, we hypothesize the following:
H5a: When client firms are larger, it further strengthens the positive impact of (a) longer lengths of client relation-ships on BRV, (b) richer reference formats on BRV, and (c) higher congruency on BRV.
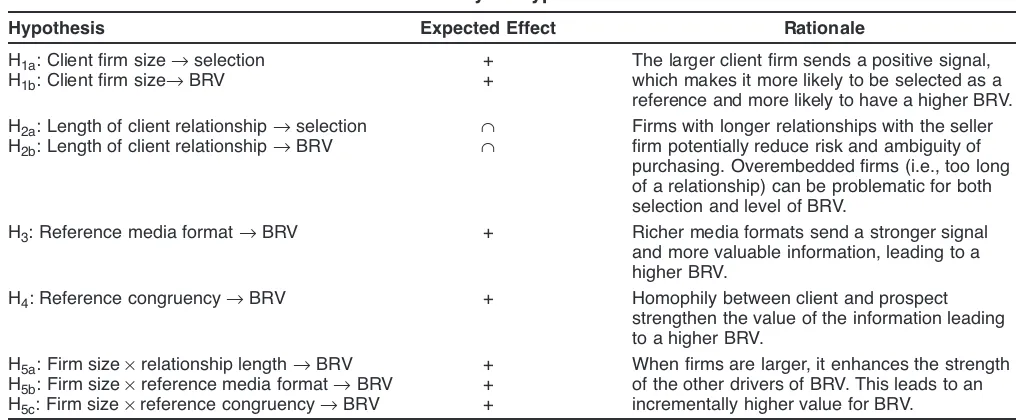
We provide a summary of the main hypotheses in Table 1 and the numbers of the hypotheses on the links between the constructs in our conceptual model in Figure 1.
BRV
Measurement of BRVTo empirically test the hypotheses, we first need to develop a measure to compute the value of a business reference. We propose that the value of a business reference is a function of three components: (1) the amount of influence that client references (vis-à-vis other marketing elements) had on a prospect’s adoption, (2) the amount of influence that a given client reference (vis-à-vis other client references) had on the prospect’s adoption, and (3) the profitability of the prospect after adoption. We represent this mathematically as follows:
where
BRVi= Business reference value of client reference i, Refn= Degree to which references affected the prospect
n’s purchase decision,
DOIin= Degree of influence of client reference i on con-verted prospect n,
CLVn= CLV of converted prospect n, N = Total number of converted prospect,
r = Discount rate (in months), and
tn= month that converted prospect n became a cus-tomer after the first month of the observation window.
Equation 1 illustrates that we can compute the contribu-tion of BRV from each prospect that chooses to adopt a product or service by multiplying the degree of influence that client references, in general, had on the decision of that prospect to adopt (Ref) by the degree that the given client’s reference influenced the prospect to adopt (DOI), and by the profitability of the converted prospect (CLV). When we have this information from each converted prospect, we
cal-∑
( )= × ×
+
=
(1) BRV Ref DOI CLV
1 r ,
i n int n
n 1 N
n
TABLE 1
Summary of Hypotheses
Hypothesis Expected Effect Rationale
H1a: Client firm size Æselection + The larger client firm sends a positive signal,
H1b: Client firm sizeÆBRV + which makes it more likely to be selected as a
reference and more likely to have a higher BRV. H2a: Length of client relationship Æselection « Firms with longer relationships with the seller
H2b: Length of client relationship ÆBRV « firm potentially reduce risk and ambiguity of
purchasing. Overembedded firms (i.e., too long of a relationship) can be problematic for both selection and level of BRV.
H3: Reference media format ÆBRV + Richer media formats send a stronger signal
and more valuable information, leading to a higher BRV.
H4: Reference congruency ÆBRV + Homophily between client and prospect
strengthen the value of the information leading to a higher BRV.
H5a: Firm size ¥relationship length ÆBRV + When firms are larger, it enhances the strength
H5b: Firm size ¥reference media format ÆBRV + of the other drivers of BRV. This leads to an
culate the contributions to each client’s BRV across all the converted prospects. Now that there is a conceptual under-standing of the process to compute BRV, the next step is to create a method for generating values for the three inputs of the BRV equation.
Computation of BRV
Step 1: Determine whether client references influenced
adoption. The first step is to determine whether client
refer-ences in general had any influence on the prospect’s deci-sion to adopt. In this case, we expect that the adoption process is driven by two processes: seller-generated and customer-generated marketing. Seller-generated marketing efforts tend to include any direct- or mass-marketing efforts initiated by the seller firm. In this case, client-generated marketing transpires when the seller firm uses information about the client in influencing the prospect (reference). We compute this value using a constant-sum scale approach. At the time of adoption, we asked the converted prospect to do the following:
Allocate a total of 100 points between the following two influences: (1) the influence of client references in general and (2) the influence of all other marketing processes (e.g. direct, mass, etc.) and sales initiatives (e.g. personal sell-ing).
We assume that the value given to the influence of client references is, in effect, the percentage of the sale that can be attributed to the influence of client references. We then set the score that was given to the influence of references in general to the value of Refn.
Step 2: Determine the influence of each client’s refer-ence. The second step is to determine the influence that each client reference had on the prospect’s decision to adopt. We compute this value using a similar constant sum scale approach as we did for Refn. At the time of adoption, assuming a converted prospect had a value of Refn> 0, we asked the converted prospect to do the following: “Allocate a total of 100 points across each of the client references you felt influenced your decision to purchase (where more points means the reference had a greater influence).”
All 100 points could be allocated to one client reference if all other references had no impact, or the points could be allocated across any combination of client references according to the perceived influence. The value given to each client reference in this step is, in effect, the proportion of influence that a given client’s reference had relative to the total influence that client references had on a converted prospect’s decision to adopt. We attributed the score given to the influence of each client’s reference to the value of DOIin.
Step 3: Compute the CLV of the converted prospect. The
third step is to compute the expected future profit, or CLV, of the converted prospect n. We do so by adapting an equa-tion Petersen and Kumar (2009) use to measure a cus-tomer’s CLV. Petersen and Kumar show at an aggregate level how total customer purchases, total operating costs (i.e., product returns/service costs), and total firm-initiated
marketing efforts are equal to profit. We convert this calcu-lation from the aggregate to the customer level:
where
CLVn= CLV of customer n,
(Purchasesnt) = Profit from purchases of customer n in time t,
(Operating Costsnt) = Profit lost from operating costs of customer n in time t,
Marketingnt= Marketing costs for customer n in time t,
T = Time horizon of the prediction, and r = Discount rate (in months).
Equation 2 shows that the CLV for each new customer n is a function of three factors: (1) the profit from purchases, (2) the operating costs, and (3) the marketing costs to retain the customer. In this case, profit from purchases includes the contribution margin from purchases aggregated monthly, profit lost from operating costs includes losses from product returns and/or costs of customer service aggregated monthly, and marketing costs include the costs of any marketing efforts the firm expends to the individual customer n aggregated monthly.
For our empirical example, we conducted a field study during a one-year time period and then observed the pur-chases, product returns, and marketing efforts for the remainder of the normal CLV prediction window, over a period of three years. In this case, we compute only the actual CLV of converted prospects, not predicting it. In the case in which the entire prediction window is not observed, we could use the method that Reinartz, Thomas, and Kumar (2005) suggest to predict the CLV of newly acquired cus-tomers. We then use the resulting value of BRV for each of the client references as a dependent variable with the antecedents of BRV as independent variables to uncover the drivers of BRV.
An Empirical Example
To explain the influence and value of client references, we provide two empirical examples from two B2B firms, one in the telecommunications industry and another in the financial services industry. In the following sections, we describe the data we collected from these two firms, the selection and operationalization of the variables for the con-structs, and the method used for estimating the model to empirically determine the drivers of BRV.
Data
The telecommunications firm provides products and ser-vices that include landline phone service, voice over Inter-net Protocol, InterInter-net service, wireless service, maintenance contracts, and infrastructure, among other products. The financial services firm provides products and services that include business checking/ savings accounts, payroll deposit
∑
(
(
)
( ))
=
π −
π −
+
=
(2) CLV
Purchases
Operating Costs Marketing
1 r ,
n
nt
nt nt
t t 1
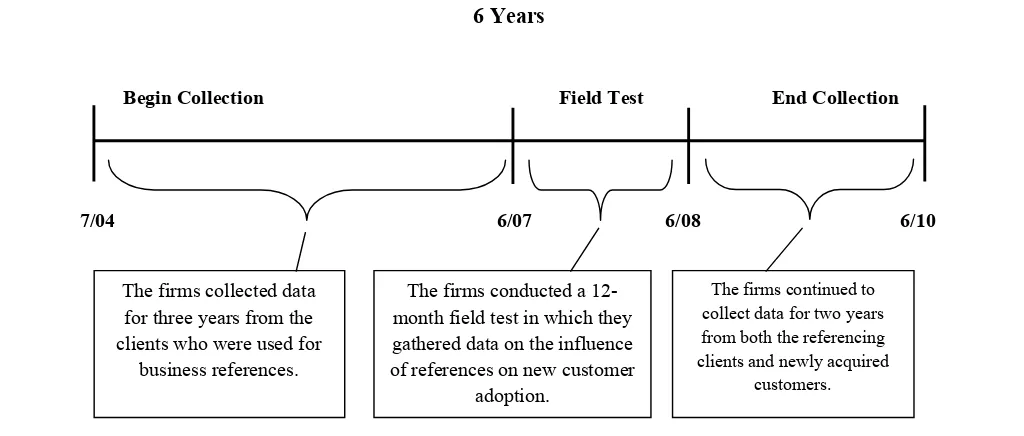
services, lines of credit, loans, insurance, and investments among other products. The data collection for both firms spanned a period of six years and included a one-year field study, during which we collected information about the influence of client references. Figure 2 provides a timeline of the data collection process for both firms.
In the first three years (from July 2004 to June 2007), the firms collected historical transaction and firmographic data from the clients that were chosen to be references for prospects. In this case, many of the firms that agreed to be used as references were willing to do so without any incen-tive. The only compensation given to the seller firm was funds to cover any costs incurred while generating the ref-erence—where the client chose the reference format. There were no rewards (e.g., promotional discounts) for agreeing to be used as a reference. There were 88 clients from the telecommunications firm and 94 clients from the financial services firm used as references during the one-year field study. The data collected from these clients included exchange (e.g., transaction and marketing information) and descriptive (e.g., firmographics) information. In the one-year period immediately following the first three one-years (from July 2007 to June 2008), both firms conducted a field study in which prospects were shown all the references from the clients that were made available to them during the sales process. Then, all prospects that made their first pur-chase during this field experiment period filled out a survey, answering two questions about the client references as described in Steps 1 and 2 from the previous section.
There were 31 converted prospects from the telecom-munications firm and 37 from the financial services firm that joined during the field experiment period. The firms then tracked the exchange characteristics, which included the transactions (both purchases and operating costs) and marketing information of the referencing clients and the converted prospects, for two more years (from July 2008 to
June 2010). We used this information for computing the values of the referencing clients and converted prospects during the three-year data collection period, which included one year of the field test and two years post–field test (i.e. realized CLV).
Estimation Method
To empirically determine the drivers of BRV, we must accommodate four key statistical issues: sample selection bias/truncation, disproportionate stratification, censoring, and unobserved heterogeneity. First, with regard to sample selection bias and truncation, we anticipate that the seller firm strategically selects the clients that are going to be used as references. The telecommunications firm selected 88 from a total of 5109 clients, and the financial services firm selected 94 from a total of 5576 clients as references. This sample selection problem results in a truncation prob-lem because the only clients for which we can observe a value for BRV are those that are selected by the firm and agreed to be a reference. To accommodate this issue, our modeling framework must be able to uncover the drivers of reference client selection by the firm and accommodate this strategic selection bias from the drivers of BRV.2To accom-modate the issue of selection bias, we implement a binary choice model to uncover the drivers of reference client selec-tion. We then use the result of this estimation to correct for the sample selection bias (the cause of the truncation prob-lem) found in the parameter estimates of the drivers of BRV. Second, we face a problem pertaining to disproportion-ate stratification, given that such a small percentage of
FIGURE 2
A Timeline of the Data Collection
Begin Collection Field Test End Collection
6 Years
The firms collected data for three years from the clients who were used for
business references.
The firms conducted a 12-month field test in which they gathered data on the influence of references on new customer
adoption.
The firms continued to collect data for two years from both the referencing clients and newly acquired
customers.
7/04 6/07 6/08 6/10
2In this study, both firms already had established customer
clients were selected for being a reference out of the total clients available to the firm. In this case, a little more than 1% for both the telecommunications firm (88 of 5109) and financial services (94 of 5576) firm were selected as refer-ences. To obtain insights into a firm’s decision to select clients to be references, we want to maximize the sample variance in the dependent variable. To do so, we would ide-ally want an equal proportion of ones and zeros in the sample (Lancaster and Imbens 1991). However, it is also possible not to lose much information in the coefficients even when the split is 80/20 rather than 50/50 (Cramer, Franses, and Slagter 1999). Thus, to maintain a larger sample and still maximize the information from the data set, we dispropor-tionately sample from the entire data set to create a sample with 20% of the clients that are references and 80% of the clients that are not used as references. We can then correct for the bias introduced by the disproportionate sample size straightforwardly by using a choice model with a traditional logit specification and an offset based on the disproportion-ate stratification (Donkers, Franses, and Verhoef 2003).
With regard to censoring, of the clients selected as ref-erences, the value of the BRV observed is greater than or equal to 0 (given that CLV was positive for new clients). This occurs because the prospects that adopt decide which client references influenced their decision to purchase. We observe a positive value for BRV only when at least one prospect found the reference valuable and 0 when no prospects indicated that a given reference was influential. To address this issue, we ran a censored regression model in which the dependent variable is the BRV score for the clients that were selected to be references and the value of BRV is censored at 0.
To account for the final modeling issue, unobserved heterogeneity, we ran a latent class censored regression model to determine the number of potential segments after we account for the variance through the focal variables of this study. For the full details on the sampling steps; selec-tion, transformaselec-tion, and censored regression equations; and the log-likelihood functions, see Appendix A. For details of the latent class segmentation, see Appendix B.
Measures
We need to identify a set of predictor variables to be used in our model of the drivers of reference client selection and BRV. For the selection equation, we include the two key factors the firm is likely to use to select clients to give ref-erences: (1) client firm size and (2) length of client relation-ship. For the BRV equation, we include the four key factors that may influence of the value of a client reference to the prospect along with the interaction effects and the selection bias correction: (1) client firm size, (2) length of client rela-tionship, (3) reference media format, and (4) reference con-gruency. For the sake of simplicity and generalizability, we aggregated the data for each industry, for product/service category, and for functional area into seven categories to test congruency. (For a list of these categories, see Web Appen-dix W1 at www.marketingpower.com/jm_webappenAppen-dix.) The following subsections discuss measurement of the four key drivers.
Client firm size. Research suggests that there are
multi-ple measures of firm size that rely on both labor force and scale of operations (Kimberly 1976). Moreover, these mea-sures may not always be highly correlated with one another. Thus, we operationalize client firm size on both the labor force dimension (number of employees) and the scale of operations dimension (annual revenue).
Length of client relationship. The length of the
relation-ship between the client and the seller firm can be viewed as both the amount of time the relationship has existed and the expected time the relationship is likely to exist into the future. This suggests that both the length of time the alliance has existed (past relationship duration) and the depth of relationship (expected future relationship duration) between the client and seller firms are important factors in the measure of the length of client relationship (Gulati and Gargiulo 1999). To this end, we operationalize length of client relationship as both the length (tenure) and the depth (CLV) of the relationship between the seller and the client.
Reference media format. We measured reference media
format using dummy variables coded by format type of the media used to provide the reference from the client firm to the potential client firm. These formats include video testi-monial, audio testitesti-monial, written testitesti-monial, case study/ white paper, and “call me” (an invitation to call the reference directly).
Reference congruency. Reference congruency depends
on the degree of similarity between the referencing firm and the potential client firms that find the referencing client firm’s reference value. Thus, we operationalized reference congruency as the ratio of potential client firms that found the reference valuable that were from the same industry, bought the same product or service, or had the same role within their organization as the total number of potential client firms that found the reference valuable. Table 2 pro-vides details of the variables and their operationalizations.
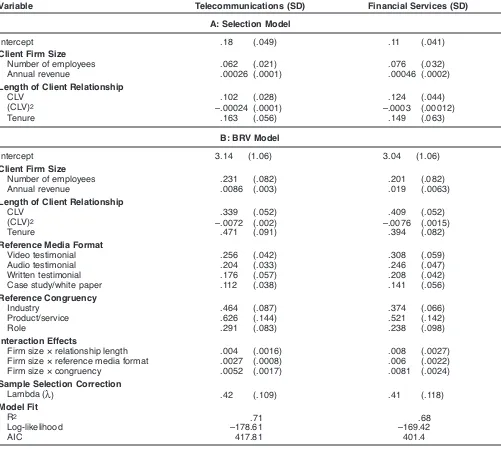
Results
Overall Model Fitvari-ance of BRV. By selecting references according to fit (con-gruency) and reference media format, and taking into account the synergistic value of client firm size, the addi-tional variance of BRV that the model explains is approxi-mately 40%.
From the results of the latent class analysis, we found that there is only one latent segment for our model; thus, we only report the results for the single-segment censored regression model. (For the results of the null models, along with the full model, for the financial services firm, see Web Appen-dix W2 at www.marketingpower.com/jm_webappenAppen-dix; note that we found similar results for the telecommunica-tions firm.) In addition, the parameter estimates from the models provide several key insights into the effect of each variable on the BRV for each of the referencing clients.
Selection Model
Client firm size. For client firm size in the selection model, we found that the number of employees has a posi-tive effect on selection for both the telecommunications firm (.062, p < .01) and the financial services firm (.076, p =
.02). This finding suggests that larger clients are more likely to be selected to provide a reference. In addition, we found that revenue has a positive effect on selection for both the telecommunications firm (.00026, p< .01) and the financial services firm (.00046, p= .02). This suggests that the larger a client’s own revenue, the more likely a client will be selected to provide a reference. These findings support H1a, that the seller firm is more likely to select larger clients, in terms of both labor force and scale of operations, as a reference.
Length of client relationship. For length of client rela-tionship in the selection model, first, we found that CLV has an inverted U-shaped effect on selection for both the telecommunications firm (for CLV: .102, p< .01; for CLV2: –.00024, p= .02) and the financial services firm (for CLV: .124, p< .01; for CLV2: –.0003, p= .01). This suggests that, first, the firm is more likely to select referencing clients that provide more profit and are more likely to have a longer relationship duration, to a threshold. Second, we find that tenure has a positive effect on client selection for both the telecommunications firm (.163; p< .01) and the financial services firm (.149; p = .02). This suggests that the seller TABLE 2
Variable Operationalization
Variable Operationalization
Client Firm Size
Employees The number of employees in the referencing client
Revenue The annual revenue of the referencing client (in millions of dollars)
Length of Client Relationship
CLV The customer lifetime value of the referencing client (in thousands of dollars)
Tenure The time the referencing client has been a customer (years)
Reference Media Format
Video testimonial 1 if the reference was a video file, 0 if not
Audio testimonial 1 if the reference was an audio file, 0 if not
Written testimonial 1 if the reference was a testimonial, 0 if not
Case study/white paper 1 if the reference was a case study/white paper, 0 if not
“Call me”a 1 if the reference was for a personal call, 0 if not
Reference Congruency
Industry (Number of converted prospects from the same industry that indicated this
client’s reference influenced their purchase)/(Number of converted prospects that indicated this client’s reference influenced their purchase)
Product/service (Number of converted prospects that purchased the same product/service
that indicated this client’s reference influenced their purchase)/(Number of converted prospects that indicated this client’s reference influenced their purchase)
Role (Number of converted clients whose decision maker was in the same role
that indicated this client’s reference influenced their purchase)/(Number of converted prospects that indicated this client’s reference influenced their purchase)
Congruency Average number of congruency matches for each converted prospect on
three congruency factors from prospects that indicated this client’s reference influenced their purchase
Interaction Effectsb
Firm size × relationship length Client firm size ¥length of client relationship Firm size × reference media format Client firm size ¥reference media format
Firm size × congruency Client firm size ¥congruency
aWe do not include “call me” in the regression because each of the references must be categorized into one of the five categories listed, and
using all five would cause perfect multicollinearity.
bFor the interaction effects, “client firm size” is represented by the revenue variable. We found similar results when we used employees.
firm is more likely to select clients that have had a longer prior relationship as a reference. In general, these findings support H2a, which predicts that, to a threshold, seller firms are more likely to select clients that have had and are expected to have longer relationships with the seller firm as a reference.
Summary. In general, all these variables and the
signifi-cance of the parameter estimates suggest that the firm does not randomly select the clients that provide references. Instead, the firm is probably selecting larger clients with stronger relationships with the seller firm (to a threshold). This finding is also supported by the positive and signifi-cant coefficient on the pseudo inverse Mills ratio for both the telecommunications firm (.42, p< 0.01) and the finan-cial services firm (.41, p< .01), further validating the need to accommodate for this selection bias.
Censored Regression (BRV Model)
Client firm size. We found that both variables that describe the client firm size of the referencing client for the telecommunications firm (for employees: .231, p< .01; for revenue: .0086, p< .01) and the financial services firm (for employees: .201, p < .01; for revenue: .019, p < .01) are positive and significant, in support of H1b. “This finding suggests that prospects are more likely to value references from clients that are larger, in terms of either labor force or scale of operations.
Length of client relationship. For length of client tionship, we found that CLV had an inverted U-shaped rela-tionship for both the telecommunications firm (for CLV: .339, p< .01; for CLV2: –.0072, p< .01) and the financial services firm (for CLV: .409, p< .01; for CLV2: –.0076, p< TABLE 3
Parameter Estimates
Variable Telecommunications (SD) Financial Services (SD)
A: Selection Model
Intercept .18 (.049) .11 (.041)
Client Firm Size
Number of employees .062 (.021) .076 (.032)
Annual revenue .00026 (.0001) .00046 (.0002)
Length of Client Relationship
CLV .102 (.028) .124 (.044)
(CLV)2 –.00024 (.0001) –.0003 (.00012)
Tenure .163 (.056) .149 (.063)
B: BRV Model
Intercept 3.14 (1.06) 3.04 (1.06)
Client Firm Size
Number of employees .231 (.082) .201 (.082)
Annual revenue .0086 (.003) .019 (.0063)
Length of Client Relationship
CLV .339 (.052) .409 (.052)
(CLV)2 –.0072 (.002) –.0076 (.0015)
Tenure .471 (.091) .394 (.082)
Reference Media Format
Video testimonial .256 (.042) .308 (.059)
Audio testimonial .204 (.033) .246 (.047)
Written testimonial .176 (.057) .208 (.042)
Case study/white paper .112 (.038) .141 (.056)
Reference Congruency
Industry .464 (.087) .374 (.066)
Product/service .626 (.144) .521 (.142)
Role .291 (.083) .238 (.098)
Interaction Effects
Firm size × relationship length .004 (.0016) .008 (.0027)
Firm size × reference media format .0027 (.0008) .006 (.0022)
Firm size × congruency .0052 (.0017) .0081 (.0024)
Sample Selection Correction
Lambda () .42 (.109) .41 (.118)
Model Fit
R2 .71 .68
Log-likelihood –178.61 –169.42
AIC 417.81 401.4
.01). We also found that tenure has a positive relationship for both the telecommunications (.471, p< .01) and finan-cial services (.394, p< .01) firms. In this case, the longer the client has been purchasing from the firm and the greater the likelihood of a longer future relationship duration, the greater was the influence of the reference from that client on a prospect’s decision to adopt. In general, these findings support H2b, suggesting that longer relationships between clients and the seller firm (to a threshold) lead to a higher BRV.
Reference media format. For all reference media format
variables, we found a positive relationship for both firms. The specific values are as follows: for the video testimonial variable, telecommunications: .256, p< .01; financial ser-vices: .308, p < .01; for the audio testimonial variable, telecommunications: .204, p< .01; financial services: .246,
p< .01; for the written testimonial variable, telecommuni-cations: .176, p< 0.01; financial services: .208, p < 0.01; and for case study/white paper variable, telecommunica-tions: .112, p< .01; financial services: .141, p= .02.
We ordered the five reference media format variables according to the size of the parameter estimates from high-est to lowhigh-est: (1) video thigh-estimonial, (2) audio thigh-estimonial, (3) written testimonial, (4) case study/white paper, and (5) “call me.”3 In addition, we tested to determine whether there is a significant difference between the levels of each of the parameter estimates using a pairwise t-test. We found that in both firms, the parameter estimate for video testimo-nial is statistically significantly larger than the parameter estimate for audio testimonial (for telecommunications: t = 9.12, p< .01; for financial services: t = 7.95, p< .01). We found that in both firms, the parameter estimate for audio testimonial is statistically significantly larger than the parameter estimate for written testimonial (for financial ser-vices: t = 4.00, p< .01; for telecommunications for finan-cial services: t = 5.85, p< .01). For both cases, we found that the parameter estimate for written testimonial is statis-tically significantly larger than the parameter estimate for case study/white paper (for telecommunications: t = 8.77, p< .01; for financial services: t = 9.31, p< .01). For both cases, we found the parameter estimate for case study/white paper is statistically significant, meaning it is larger than the value added by “call me,” which can be found in the intercept (for telecommunications: t = 2.96, p < .01; for financial ser-vices: t = 2.87, p < .01). In general, this finding supports H3, suggesting that client references with richer media con-tent tend to influence prospects more than references with less rich content.
Reference congruency. For the industry congruency
variable, we found a positive relationship for both the telecommunications (.464, p< .01) and financial services (.374, p< .01) firms. This suggests that as the number of prospects in the same industry as the referencing client
increases, so does the BRV of that referencing client. For the product congruency variable, we found a positive rela-tionship for both the telecommunications (.626, p < .01) and financial services (.521, p< .01) firms. This suggests that as the percentage of prospects that valued the reference and purchased the same product or service increased, the BRV of the referencing client increased. For the role con-gruency variable, we found a positive relationship for both the telecommunications (.291, p< .01) and financial services (.238, p= .02) firms. This suggests that as the percentage of prospects that valued the reference and held the same role as the person in the referencing client increased, the BRV of the referencing client increased.
Our findings suggest that increasing the opportunities for congruency can add significant value to a client’s ence (e.g., through strategically having a broad set of refer-ences from which to choose). However, the type of congru-ency can add differing levels of value. We find that for both firms, the value provided by different reference congruen-cies follows the same order in terms of importance: Product/ service congruency is the most valuable (when compared with industry congruency, for the telecommunications firm: t = 9.05, p< .01; for the financial services firm: t = 9.07, p< .01); industry congruency is the second most valuable (when compared with role congruency, for the telecommu-nications firm: t = 13.52, p< .01; for the financial services firm: t = 11.15, p< .01); and role congruency is the third most valuable in terms of BRV. Thus, if a prospect is inter-ested in a reference, although all congruencies are impor-tant, the most influential references will be product/service related first, industry related second, and role related third. The finding that product/service and industry (i.e. market) are the most important congruency factors supports the management literature that focuses on product–market fit as a surrogate for congruency (Alderson 1965).
Interaction effects. We found each of the interaction terms to be positive and significant for both the firms. For client firm size × length of client relationship, we found a coefficient of .004 (p = .02) for the telecommunications firm and .0008 (p< .01) for the financial services firm. For client firm size × reference media format, we found a coef-ficient of .0027 (p< .01) for the telecommunications firm and .006 (p= .01) for the financial services firm. For client firm size × reference congruency, we found a coefficient of .0052 (p< .01) for the telecommunications firm and .0081 (p< .01) for the financial services firm. These findings sup-port H5a–H5c, suggesting that larger client firms have a syn-ergistic and positive effect on the value of the reference across the other constructs.
Summary. In general, all these variables and the
signifi-cance of the parameter estimates suggest that we have uncovered many of the drivers of BRV, or the level of influ-ence a given referinflu-ence will have on getting a prospect to adopt. Thus, when accounting for the potential of selection bias, seller firms can now determine which references in their client reference database are likely to be the most valuable in a given sales situation.
3First, we omitted “call me” from the regression and treated it
Does High BRV = High CLV?
A key finding from Kumar, Petersen, and Leone (2007, 2010) is that individual customers with the highest cus-tomer referral value (CRV) are not the same cuscus-tomers as those with the highest CLV. Thus, it is important to manage customers on both their CLV and their CRV scores. In the case of BRV, it is also important to determine whether clients that have a high CLV are the same as those that pro-vide the most valuable references. To do this, we ordered the client reference firms from the telecommunications and financial services firms that were part of the field test by their realized CLV during the three years at the beginning of the field test. We divided these clients into ten deciles and computed the average CLV and BRV for each decile. Table 4 presents the results.Table 4 shows that, similar to the findings regarding CRV, the clients with the highest BRV are not the same as the clients with the highest CLV. For both firms, the clients with the highest BRV fall into the third, fourth, and fifth deciles on CLV (fifth having the highest BRV in both firms). We observe that referencing clients in the first two deciles (highest CLV) are also higher on BRV compared with the clients in the lowest four deciles (seventh through tenth), which have by far the lowest average BRV.
When comparing CLV with CRV, Kumar, Petersen, and Leone (2007, 2010) find that the customers with the highest CLV did not have a relatively high CRV. This was possibly the case because of the incentives provided to encourage referral behavior. Customers with the highest CLV probably did not value the referral incentive to the degree that the
medium CLV customers did. In this case, there is no incen-tive, and the BRV of the clients in the top deciles is still relatively high. The highest deciles still have a high BRV because of client firm size (i.e., higher client firm size Æ higher BRV). However, the medium CLV clients that give references have the highest BRV due to the length of client relationship (i.e., medium relationship duration Æ higher BRV) and the congruency effect (higher congruency Æ higher BRV). With regard to congruency, we found that many of the prospects being targeted for acquisition had the most in common with the customers in the medium CLV group.
We also observe that the average BRV scores in Deciles 1–6 for the telecommunications firm and Deciles 1–7 for the financial services firm are higher than the average CLV scores for the clients in those deciles. This suggests that get-ting a medium- to high-value business client to provide a reference can be potentially much more profitable than merely focusing on cross- and up-selling opportunities to that business client. To provide some additional insights into the type of clients that provide high- versus low-value references, we segmented the referencing clients using a median split of BRV (see Table 5).
Table 5 shows significant differences between the pro-files of clients that are high on BRV for both firms. As we expected, the CLV of the high-BRV clients is much higher than that for the low-BRV clients (for the telecommunica-tions firm, 18,400 vs. 5800; for the financial services firm, 18,700 vs. 5200). We observe a significant difference in the tenure between the two groups: Clients that have a higher BRV have longer tenure (for the telecommunications firm,
TABLE 4
Decile Analysis for BRV and CLV
Telecommunications Financial Services (n = 9 for All but Tenth Decile) (n = 9 for All but Tenth Decile)
Decile CLV (in Thousands) BRV (in Thousands) CLV (in Thousands) BRV (in Thousands)
1 30.8 34.6 26.2 31.2
2 25.7 40.8 23.6 33.6
3 20.2 49.6 20.5 41.8
4 17.3 55.8 18.1 59.2
5 14.9 61.2 15.7 66.8
6 12.1 30.2 12.8 36.1
7 9.3 6.2 9.6 10.2
8 6.4 3.1 5.5 4.1
9 3.2 1.8 2.9 2.2
10 .8 .2 .4 .18
TABLE 5
Segment Description for High and Low BRV Clients
Telecommunications Financial Services
Variable High BRV (n = 44) Low BRV (n = 44) High BRV (n = 47) Low BRV (n = 47)
Average CLV (in thousands) 18.4 5.8 18.7 5.2
Average tenure (years) 10.3 4.9 14.7 6.8
Most common media format Video “Call me” Video “Call me”
Average number of employees 2710 468 2158 318
Average annual revenue 59.4 11.2 70.6 18.8