submitted manuscript under review
TWIN TANK
’
S DEBIT CONTROL BY ETHERNET WITH
PROPORTIONAL INTEGRATIVE CONTROL METHOD WITH ARDUINO
R. Adnanqays
School of Electrical Engineering,Telkom University, Bandung, 40287, Indonesia
Abstract
This paper proposes proportional integrative control method for twin tank’s debit control by Ethernet using arduino. An ultrasonic sensor was mounted in top of twin tanks to measure a height that can be converted into debit with some calculation. An Ethernet modul was used for communication between PC and twin tank. Bigger the debit will make time rise increase because water must fill the tank first.
Keywords: Arduino; Debit control; Integrative; Proportional
1. Introduction
The water needs can not be avoided, everyone would need, either for drinks, food, bathing, washing clothes and other daily necessities. In some areas there is still a difficulty to get clean water, even if there is no division of water per person is still not evenly distributed. Of issues that the author wants to make a tool that is able to control the amount of output water flow is regulated through a web browser, so that in determining the amount of discharge output we no longer have to set up of a tool it is, but can be arranged through remotely via the internet. So that people can get water by the amount corresponding to the desired, which can be set via the remote.
In this proposal will explain how to create such a device that the author named "Twin Tank's Debit Control by Ethernet with Proportional Integrative Control Method with Arduino". This tool is designed to use two tanks, which are connected by pipes underneath. Hole section above are useful for adjusting the water pressure in the first tank and the second tank. Meanwhile, the bottom of the pipe is useful to drain the water from the first tank to a second tank. When water flows from the first tank to the second tank then there will be differences in altitude. This difference is used to measure the flow of water that will be used to control the speed of the water pump motor.
In these tools need a tool that is able to measure the height of the water that is in the two tanks, therefore the authors chose to use ultrasonic sensor as a measurement tool. In addition to this there is an inexpensive sensor, accuracy can be relied upon so as to be suitable for use on this instrument. In addition to ultrasonic sensors, this tool is also needed in the control method to be used to control the speed of the pump motor, the authors chose to use a method of controlling proportional integrative.
2. Section
(Times New Roman, Font 11, Bold)2.1 Basic Theory
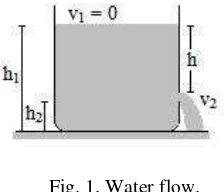
One is the use of the Bernoulli equation to calculate the flow rate of liquid coming out of the bottom of a container ( see figure below )
Fig. 1. Water flow.
Bernoulli equation applies to the surface of the container and the surface of the hole . Because the diameter of the hole at the base of the container is smaller than the diameter of the container , then the flow velocity at the surface is considered zero (v=0) . The surface of the container and open pit so that the pressure is assumed to be equal to the atmospheric pressure ( P1 = P2 ) [2] . After few adjustment so we get the equation speed of water flowing in a tank.
where v2 denotes the speed of water flowing, g is gravitation, and h is height from above the hole until water surface.
2.2 System
cross-sectional area is known, then all are included in the count of the formula:
Q = a. v (2) Q = a. √2gh (3)
In accordance with the purpose of making this tool , which is making a powerful tank that can be used to store water without any leakage and secure for electronic components that will support the system. So the water tank was invented that can hold water without any leakage.
where Q denotes the water debit, v is speed of water cap For testing tool, used a measuring cup with a
flowing from the tank, g is gravitation, and h is height from above the hole until water surface.
After feedback and output water flow is known, then we can go to the next process that is controlling the proportional integrative methods. Inside the control will be calculated error value, the error value obtained from discharge enter output reduced water flow. After that, the data will be processed again by using the constant proportional and integrative constant. Constant Proportional used to speed up the rise time and constant output integrative used to stabilize water flow.
After all the data is processed in arduino, it will get the water pump speed. To be able to control the speed of the water pump would require a DC motor driver. The driver will control the pump speed in accordance with the data that has been processed in the previous integrative proportional control. So that the water will turn the motor pump and will pump water from the storage tank to tank data processing or twin tanks. Repeat the process will return from this point until the desired output water flow accordingly.
2.3 Analysis
Making the interface on the internet is an important stage in this final project . At the interface of these tools , will be given a few keys to adjust the flow of water we want. Once the button is pressed , it will send you the information that will be read by the system so that the water will discharge in accordance with the desired water discharge , the water flow is regulated through the tool interface.
Fig. 2. Interface
Fig. 3. Twin Tank.
acity of 2 liters with a resolution of 20 ml . To test how we set the large debit in web browser and then when the system is stable, then we measure output per second discharge of water from the system by using a measuring cup . How to test that first set the timer for one second. When the timer starts counting Immediately place the measuring cup right at the end of the water discharge output . Once the timer goes off or has been declared one second , then also take a measuring cup and see how the volume of water . See and measure the volume of water then we can find out a great flow of water per second output . After all the tools available and is installed, then held tests on components of the distance measuring devices and finally testing on the system.
Table 1.
Height (cm) Height in Sensor (cm)
5 5
10 10
15 15
20 20
25 25
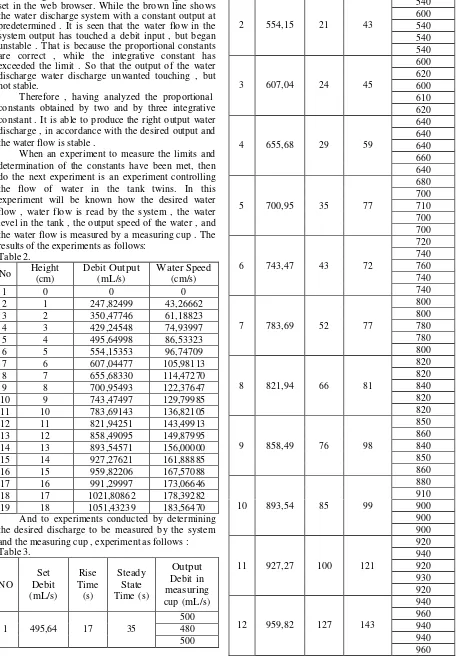
Having obtained an experiment to measure an object distance and the results obtained in accordance with the actual situation , then the experiment was continued to the next stage . The next stage is to measure the limits of experimental control of this water discharge . From the experimental results obtained the following data:
Input debit max = 1051,5033333 mL/s Output debit max = 1051,43239233 mL/s Height max = 18 cm
Height min = 3 cm Gravitation = 9,36 m/s2 Kp = 2
Ki = 3
Integrative proportional constants obtained by trying one at a constant proportional constants start at zero to eventually obtain appropriate constant value which is able to provide better water flow output . Data following experiments :
Constant P = 1 and I = 0:
Fig. 4. Tuning P=1, I=0.
Table 2.(The contents font 10)
Experiment Measured
Distance (cm) Error (%) 20 100 3 40 120 2 100 125 1
predetermined . Seen that discharge effluent water in the system is still too small compared to the input discharge and rise time the system is not big enough . That is because the proportional constant is too small . So that the output has not touched the water discharge water discharge is desired.
Constant P = 2 and I = 0:
Fig. 5. Tuning P=2, I=0.
For the second trial is determined by two constants proportional and integrative constant of zero . Figure 5 The blue line is a discharge that we set in the web browser. While the purple line shows the water discharge system with a constant output at predetermined . Seen that discharge effluent water in the system is still too small compared to the input discharge and rise time the system is not big enough . That is because the constant integrative still too small . So that the output has not touched the water discharge water discharge desired and not yet stable. Constant P = 3 and I = 0:
Fig. 6. Tuning P=3, I=0.
For the third trial in the set of three constants proportional and integrative constant of zero . Figure 6 The blue line is a discharge that we set in the web browser. While the yellow line shows the water discharge system with a constant output at predetermined . Seen that discharge effluent water in the system has started to touch input discharge , but still not stable . That is because the proportional constants have started correctly, while the integrative constant is zero . So that the output flow of water begins to touch the water flow is desirable, but not yet stable.
Constant P = 2 and I = 1:
Fig. 7. Tuning P=2, I=1
For the experiments in the fourth set of two and a constant proportional integrative constants by one . In Figure 7 The blue line is a discharge that we set in the web browser. While the green line shows the water discharge system with a constant output at predetermined . It is seen that the water flow in the system output has touched a
debit input , but still not stable . That is because the proportional constants have started right , while still small integrative constant . So that the output flow of water begins to touch the water flow is desirable, but not yet stable.
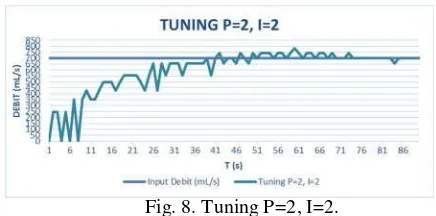
Constant P = 2 and I = 2:
Fig. 8. Tuning P=2, I=2.
For the experiments in the fifth set of two and a constant proportional integrative constants of the two . In Figure 8 the blue line is a discharge that we set in the web browser. While the dark blue line shows the water discharge system with a constant output at predetermined . It is seen that the water flow in the system output has touched a debit input , but still not stable . That is because the proportional constants have started right , while still small integrative constant . So that the output flow of water begins to touch the water flow is desirable, but not yet stable.
Constant P = 2 and I = 3:
Fig. 9. Tuning P=2, I=3.
For the experiments in the sixth set of two and a constant proportional integrative constants of three . In Figure 9 the blue line is a discharge that we set in the web browser. While the lines are gray showing water discharge system with a constant output at predetermined . It is seen that the water flow in the system output has touched the input and stable discharge . That is because constants and constant proportional integrative own right . So that the output flow of water touching the desired water flow and stable.
Constant P = 2 and I = 4:
510 constants proportional and integrative constants of four . In Figure 10 the blue line is a discharge that we set in the web browser. While the brown line shows the water discharge system with a constant output at predetermined . It is seen that the water flow in the system output has touched a debit input , but began unstable . That is because the proportional constants are correct , while the integrative constant has exceeded the limit . So that the output of the water discharge water discharge unwanted touching , but not stable.
Therefore , having analyzed the proportional constants obtained by two and by three integrative constant . It is able to produce the right output water discharge , in accordance with the desired output and the water flow is stable . the water flow is measured by a measuring cup . The results of the experiments as follows:
Table 2.
13 991,29 147 159
1000 1010 980 980 1000
14 1021,80 188 205
1020 1040 1040 1020 1000
15 1051,43 256 267
1040 1050 1060 1040 1040
Adnanqays Graha Riyadhi was born in Bandung, Februari 15th, 1995. Had graduated in Senior High School 32 Jakarta Selatan. Then continued to studied in Telkom University in a Electrical Enggineering Schools.
.
For power consumption on these devices can be divided in advance by parts. There are 2 parts:
Mikrokontroller = 9 Watt Pump = 96 Watt
3. Conclusions
From the test results and analysis that has been done, some conclusions can be drawn as follows.
1. Ultrasonic sensors can be used as a measure of the distance to the object being measured is water. 2. Resolution ultrasonic sensor is used that is 1 cm to
make the data more tidy.
3. Tank with acrylic material to accommodate the water with a strong and does not leak.
4. Control is done by proportional integrative method with constant proportional integrative constant at 2 and by 3.
5. Determination of the constants Proportional Integrative do as much as 7 times by trial and error method.
6. Large discharge minimum output of 495.64 mL / s and large output discharge a maximum of 1051.43 mL / s.
7. Gravity used dipercobaan 9.36 m / s2.
8. The maximum water level that can be achieved on a tank that is as high as 18 cm.
9. The larger the output water flow, the greater the rise time. Due to water should fill the room ditangki before finally coming out with an appropriate discharge.
Reference
[1] Fox, R, W., Mcdonald, A.T., & Pitchard, P. J. (2003). Introduction to Fluid Mechanics 6th Edition. Bogota DC: Jhon willy & Sons Inc. [2] Haris, A. (2009). Fisika SMA/MA Kelas XI.
Jakarta: Pusat Perbukuan Departemen Pendidikan Nasional