Obesity Risk Factors among 25-65 Years Old Adults in Bogor City, Indonesia:
A Prospective Cohort Study
Sudikno
1*, Hidayat Syarief
2, Cesilia Meti Dwiriani
2, Hadi Riyadi
2, Julianty Pradono
11National Institute of Health Research and Development, Ministry of Health Indonesia, Jakarta 10560 2Department of Community Nutrition, Faculty of Human Ecology, Bogor Agricultural university,
Bogor 16680
ABSTRACT
This research was aimed to identify the obesity risk factors in adults aged 25-65 years old in 2011-2014. The study used secondary data from “Cohort study on risk factors of non-communicable diseases” that was collected for two years in 2011-2013 and 2012-2014. The research was designed as a prospective cohort study. The number of subjects was 1006, consisted of 364 men and 642 women. Results showed a 25% prevalence of obese (BMI≥25 kg/m2). Multivariate Cox regression analysis showed the risk factors of obesity in adults aged 25-65 years old were gender, smoking habit, consumption of fatty foods, and duration of smoking habit. During the two years of observation, obesity developed faster in female subjects compared to male subjects, after adjusted to smoking habit, fat intake, and interaction between smoking habit and time. The risk of obesity in adults can be reduced by not starting smoking at early age and reducing consumption of fatty foods.
Keywords: adults, obesity, risk factors
*Corresponding Author: tel:+6281316350502; email: [email protected]
ISSN 1978-1059 EISSN 2407-0920
INTRODUCTION
Obesity has reached the epidemic propor-tion globally with a prevalence of almost doubled since 1980 (WHO 2013). Low et al. (2009) re-ported the increasing prevalence of overweight and obese in developing and developed countries. In Indonesia, the prevalence of overweight and obese shows an increase every year. The preva-lence of obese (BMI>25 kg/m²) among adults (15 years old and above) based on the Basic Health Research 2007 was 13.9% in men and 23.8% in women (Depkes RI 2008). Further analisis on Riskesdas’ data showed the prevalence of over-weight among adult females aged 19-55 years old was 29.4 % (Diana et al. 2013). Data from Riskesdas 2013 showed the prevalence of obese (BMI>25 kg/m²) among adult males (>18 years old) was 19.7% and 32.9% for adult females (Kemenkes 2013). Moreover, analysis on data of Riskesdas 2013 showed that within the age group of 25-65 years old, the prevalence of overweight and obese was 26.1% and 7.2%, respectively (Su-dikno et al. 2015). Many studies have shown the relationship between obesity and several disea-ses. Overweight and obesity have been proven to be related with some conditions such as diabetes, cardiovascular diseases, dislipidemia, hyperten-sion, metabolic syndrome, inflammation, throm -bosis, certain cancers, and life-span expectation (Peeters et al. 2003; Jafar et al. 2006; Lestari & Siswanto 2007; Despre´s et al. 2008; Mokdad et
al. 2003; Lee 2009; Marliyati et al. 2010; Zalesin et al. 2011; Kurukulasuriya et al. 2011; Franssen et al. 2011; Schmandt et al. 2011; Saleh 2015; Sihombing et al. 2015).
Obesity is linked to high-calorie food in-take, high intake of fatty meat and oily foods, and high consumption of alcohols combined with low physical activity (Lokuruka 2013). Studies have shown the risk factors for obesity are gender, age, occupation, education level, economic status, marital status, urban living area, smoking habit, consumption of fatty food, consumption of sweet food, and level physical activity (Hou et al. 2008; Sugianti et al. 2009; Oanh et al. 2009; Shayo & Mugusi 2011; Mir Islam & Rasooly 2013; Gbary et al. 2014; Sudikno et al. 2015).
prevalence of obese (BMI
≥
30 kg/m2) in men and women was 6.3% and 16.8%, respectively (Sudikno et al. 2017). A longitudinal study by Riyadina et al. (2017) showed the prevalence of obesity among 888 post-menopause women aged 44-64 years old was 57.2%. The main determi-nants for obesity in post-menopause women were sufficiency of carbohydrate intake, abnormal tri -glycerides, lack of physical activity, sufficiency of protein intake, and family history of obesity. The current study was aimed to determine the risk factors for obesity in adults aged 25-65 years old using cohort design from 2011 to 2014.METHODS
Design, location, and time
The current study used the secondary data from “Cohort Study on Risk Factors of Non-Communicable Diseases (RFNCD)” that was collected for 2 years: 2011-2013 and 2012-2014 by the Center of Research for Public Health In-tervention, National Institute of Health Research and Development, the Ministry of Health Indone-sia, in 5 sub-districts from 11 administrative villa-ges in Bogor Tengah district, Bogor City, which were Kebon Kalapa, Babakan Pasar, Babakan, Ciwaringain and Panaragan. The research was designed as a prospective cohort study.
Sampling
The population used in the study was all household members aged 25-65 years old resi-ding in the study location. Samples were all mem-bers of the households aged 25-65 years old with the criteria of permanent residents in the research location (permanent residency was proven by identity card), independent, no physical disabili-ties, non-pregnant female respondents, normal BMI (18.5-24.9 kg/m2) (WHO 2000) and had no non-communicable diseases (hypertension, dia-betes mellitus, cancer, stroke, chronic obstructive lung disease) at the beginning of the study, signed on the informed consent form, and duly-filled the data forms. The exclusive criteria were pregnant women and subjects with non-communicable diseases and abnormal BMI at the beginning of the study. Based on two years of observation (2011-2013 and 2012-2014), 1,006 subjects who fulfilled the inclusive criteria were selected to be analyzed. The number of subjects was considered sufficient based on the calculation, which resulted in 892 as the sample size (Lemeshow 1997).
Data collection
The data collected included the risk factors and event (obesity) that appeared during the two years of observation (2011-2013 and 2012-2014)
and collected in 7 sampling times. The gap be-tween each sampling time was three months. The baseline (0) was the initial data of the study (2011 and 2013). The risk factors that were analyzed consisted of gender, marital status, age, level of education, occupation, stress level, smoking habit, physical activity, dietary pattern (meat, of-fal, food cooked with coconut milk, fried foods, noodles, fruits, and vegetables), intake of sugar, fat and salt, and intake of energy, protein, and car-bohydrate). The risk factors of obesity that were analyzed were those existed at the beginning of the study and not the dynamic risk factors.
Sociodemographic data collection on smoking habit and physical activity was per-formed using a questionnaire that was developed specially for the cohort study on risk factors of non-communicable diseases in Indonesia, which was adopted from "The WHO STEPS Instrument for Non Communicable Diseases Surveillance" (Riyadina et al. 2012). Assessment of the physi-cal activity was based on the composite physi- calcula-tion of the type and duracalcula-tion of the activity (days per week and minutes per day), including sports. Heavy activities or sports were rated 8 times, me-dium activity or sports were rated 4 times, and light activity or sports were rated 2 times. Sub-jects were categorized as lacking in physical ac-tivity if the total acac-tivity was less than 600 MET (metabolic equivalent) in a week (WHO 2011). The category of education was based on the high-est level of education of the subjects, which were categorized into two categories: “low” if the sub-ject never had any formal education or went to middle school and “high” if the subject graduated from the high school or higher. Subjects were categorized as having emotional disturbance (un-der stressed) if they experienced at least 6 out of 20 symptoms listed in the SRQ (Self Reporting Questionnaire) (Riyadina et al. 2012).
Measurement of body height was per-formed using microtoise that was modified and made from paper carton with the capacity of 200 cm and accuracy of 0.1 cm. Body weight mea-surement was carried out using digital balance (brand: AND) with the capacity of 150 kg and ac-curacy of 0.01 kg. Body mass index (BMI) was the ratio between body weight and squared body height (kg/m2), consisted of normal (18.5-24.9
kg/m2), overweight (25.0-29.9 kg/m2), and obese
(≥30 kg/m2) (WHO 2000).
Next, nutrient content was calculated us-ing the software Nutrisoft, developed by Pusat Teknologi Terapan Kesehatan dan Epidemiologi Klinik, Balitbangkes (The Centre for Applied Health Technology and Clinical Epidemiology, National Institute of Health Research and Develop-ment). Grouping of nutrients (energy and protein) was based on the adequacy of nutrient intake (Angka Kecukupan Gizi (AKG)) (Kemenkes 2013). Energy intake was categorized into two: deficit ((<70% AKG) and sufficient ((≥70% AKG). Protein intake was categorized into two: deficit (<80% AKG) and sufficient (≥80% AKG). Sufficiency of carbohydrate intake relies on the adequacy of total energy intake based on age and gender, after being subtracted with the adequate intake of protein and fat (Hardinsyah et al. 2012), which then was divided into two categories: deficit (<100% AKG) and sufficient (≥100% AKG). Consumption of noodles, meat, offal, foods cooked with coconut milk, fried foods, and vegetables and fruits, was categorized into three groups: never, 1-6 times/week, and ≥7 times/week. Intake of salt, sugar, and fat was based on the Decree of Minister of Health No. 30 in 2013 on labeling of sugar, salt, and fat and health messages on processed food and ready-to-eat-food (Kemenkes 2013). Sugar intake was ca-tegorized into two groups: >50 g/day and ≤50 g/ day, while salt intake was grouped as: >200 mg/ day and ≤2000 mg/day, and fat intake was divi-ded into two: >60 g/day and ≤60 g/day.
Data analysis
Data that were analyzed were the risk fac-tors and prevalence of obesity that developed during the two years of observation (2011-2013 and 2012-2014). Data was collected seven times. The limiting criteria was the subject’s condition that was not obese at the pre-determined time-frame. Obese survival rate was calculated using life-table survival analysis.This step of analysis was performed before multivariate analysis. Va-riables were included in the multivariate analysis if the p value from bivariate analysis was <0.25 (Hosmer & Lemeshow 2000).
The analysis used was time-dependent Cox regression. If the variables had interaction with p value <0.05, then the interaction was included in the multivariate model and further analyzed with Cox regression with reduced model (time-depen-dant Cox regression). If the assumption of pro-portional hazard was fulfilled (p>0.05), then Cox proportional hazard model was developed with multivariate regression analysis (time-dependant Cox regression) to determine the risk factors that contributed to obesity by using prediction model and Enter method.
RESULTS AND DISCUSSION
Table 1 shows that during two years of ob-servation, there were 251 cases (25%) of obesity (BMI≥25 kg/m2) in subjects previously classified as having normal BMI. The trend was doubled in female subjects (63.5%) as compared to the male subjects (36.2%). The age group with the high-est case of obesity was 35-44 years old (32.1%) and 59% of the cases were found in the category of low education level. In terms of occupation, most cases of obesity occurred in the group of domestic workers (launderer, cook, baby sitter, etc.), which was 34.9%. Interestingly, there were 6.5% of the subjects who were unemployed. As much as 26.1% of the subjects were under stress. From the marital status, it was found that most subjects were married (84.9%). Physical activity of the subjects were mostly in the category of suf-ficient (89.1%). Meanwhile, in terms of smoking habit, there were 36.6% of the subjects who were active smokers and only 13% were non-smokers (Table 1).
Most subjects had sufficient energy intake (79%) and protein intake (55.5%). In contrast, most of the subjects were deficit in terms of car -bohydrate intake (90.1%). For dietary pattern, only small percentage (2.2%) of the subjects who never consumed noodles, while offal was con-sumed ≥ 7 times/week for only 1.9% (Table 1).
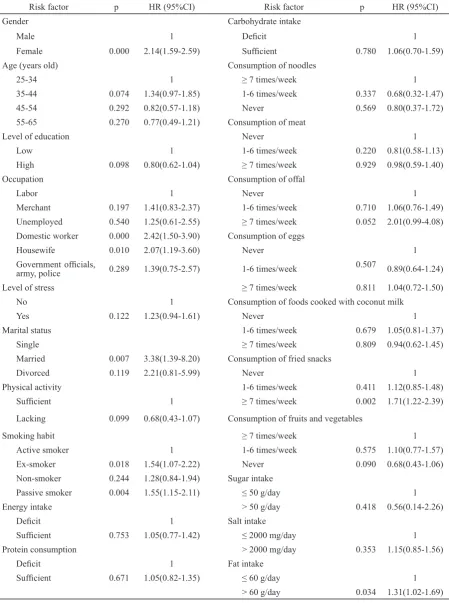
Table 2 shows that the variables that were included in the multivariate analysis (p<0.25) were gender, age, occupation, level of stress, marital status, physical activity, smoking habit, dietary pattern (meat, offal, fried snacks, and fruits and vegetables), and fat intake.
In the next step, each variable of risk fac-tor was analyzed against time (t). Results of the analysis showed that there were interactions be-tween occupation and smoking habit with obe-sity. This finding showed that the assumption of proportional hazard was not fulfilled (p<0.05), thus multivariate analysis of time-dependant Cox regression was used (Table 3).
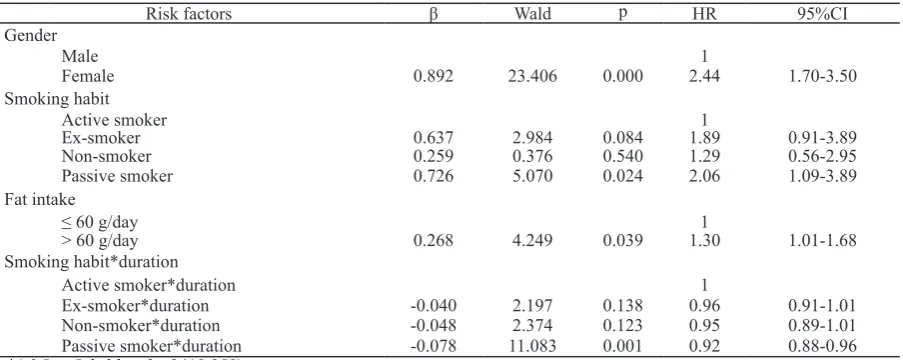
It can be observed in Table 3 that the risk factors for obesity in adults aged 25-65 years old were gender, smoking habit, fat intake, and the interaction between smoking habit and time. Table 3 also shows that the variable that had sig-nificant effect on obesity was gender. During two years of observation, there were 84.6% of male subjects who became obese, while among female subject, the percentage was lower (69.6%).
vari-Table 1. Respondent distribution according to socio-demographic characteristics, physical activity, smoking habit, dietary habit, and type of food consumed
Characteristic n=1006 % Characteristic n=1006 %
Obesity status Carbohydrate intake
Sensor 755 75.0 Deficit 906 90.1
Event (obese) 251 25.0 Sufficient 100 9.9
Gender Consumption of noodles
Male 364 36.2 ≥ 7 times/week 405 40.3
Female 642 63.8 1-6 times/week 579 57.6
Age (year old) Never 22 2.2
25-34 234 23.3 Consumption of meat
35-44 323 32.1 Never 176 17.5
45-54 305 30.3 1-6 times/week 528 52.5
55-65 144 14.3 ≥ 7 times/week 302 30.0
Level of education Consumption of offal
Low 594 59.0 Never 832 82.7
High 412 41.0 1-6 times/week 155 15.4
Occupation ≥ 7 times/week 19 1.9
Labor 133 13.2 Consumption of eggs
Merchants, entrepreneurs 234 23.3 Never 185 18.4
Unemployed 65 6.5 1-6 times/week 560 55.7
Domestic work 351 34.9 ≥ 7 times/week 261 25.9
Housewife 120 11.9 Consumption of foods cooked with
coconut milk
Government officials, army,
police 103 10.2 Never 463 46.0
Level of stress 1-6 times/week 433 43.0
No 743 73.9 ≥ 7 times/week 110 11.0
Yes 263 26.1 Consumption of fried snacks
Marital status Never 513 51.0
Single 58 5.8 1-6 times/week 356 35.4
Married 854 84.9 ≥ 7 times/week 137 13.6
Divorced 94 9.3 Consumption of fruits and vegetables
Physical activity ≥ 7 times/week 753 74.9
Sufficient 896 89.1 1-6 times/week 132 13.1
Lacking 110 10.9 Never 121 12.0
Smoking habit Sugar intake
Active smoker 368 36.6 ≤ 50 g/day 992 98.6
Ex-smoker 169 16.8 > 50 g/day 14 1.4
Non-smoker 131 13.0 Salt intake
Passive smoker 338 33.6 ≤ 2000 mg/day 812 80.7
Energy intake > 2000 mg/day 194 19.3
Deficit 211 21.0 Fat intake
Sufficient 795 79.0 ≤ 60 g/day 674 67.0
Protein intake > 60 g/day 332 33.0
Deficit 448 44.5
Risk factor p HR (95%CI) Risk factor p HR (95%CI)
Gender Carbohydrate intake
Male 1 Deficit 1
Female 0.000 2.14(1.59-2.59) Sufficient 0.780 1.06(0.70-1.59)
Age (years old) Consumption of noodles
25-34 1 ≥ 7 times/week 1
35-44 0.074 1.34(0.97-1.85) 1-6 times/week 0.337 0.68(0.32-1.47)
45-54 0.292 0.82(0.57-1.18) Never 0.569 0.80(0.37-1.72)
55-65 0.270 0.77(0.49-1.21) Consumption of meat
Level of education Never 1
Low 1 1-6 times/week 0.220 0.81(0.58-1.13)
High 0.098 0.80(0.62-1.04) ≥ 7 times/week 0.929 0.98(0.59-1.40)
Occupation Consumption of offal
Labor 1 Never 1
Merchant 0.197 1.41(0.83-2.37) 1-6 times/week 0.710 1.06(0.76-1.49)
Unemployed 0.540 1.25(0.61-2.55) ≥ 7 times/week 0.052 2.01(0.99-4.08)
Domestic worker 0.000 2.42(1.50-3.90) Consumption of eggs
Housewife 0.010 2.07(1.19-3.60) Never 1
Government officials,
army, police 0.289 1.39(0.75-2.57) 1-6 times/week
0.507
0.89(0.64-1.24)
Level of stress ≥ 7 times/week 0.811 1.04(0.72-1.50)
No 1 Consumption of foods cooked with coconut milk
Yes 0.122 1.23(0.94-1.61) Never 1
Marital status 1-6 times/week 0.679 1.05(0.81-1.37)
Single ≥ 7 times/week 0.809 0.94(0.62-1.45)
Married 0.007 3.38(1.39-8.20) Consumption of fried snacks
Divorced 0.119 2.21(0.81-5.99) Never 1
Physical activity 1-6 times/week 0.411 1.12(0.85-1.48)
Sufficient 1 ≥ 7 times/week 0.002 1.71(1.22-2.39)
Lacking 0.099 0.68(0.43-1.07) Consumption of fruits and vegetables
Smoking habit ≥ 7 times/week 1
Active smoker 1 1-6 times/week 0.575 1.10(0.77-1.57)
Ex-smoker 0.018 1.54(1.07-2.22) Never 0.090 0.68(0.43-1.06)
Non-smoker 0.244 1.28(0.84-1.94) Sugar intake
Passive smoker 0.004 1.55(1.15-2.11) ≤ 50 g/day 1
Energy intake > 50 g/day 0.418 0.56(0.14-2.26)
Deficit 1 Salt intake
Sufficient 0.753 1.05(0.77-1.42) ≤ 2000 mg/day 1
Protein consumption > 2000 mg/day 0.353 1.15(0.85-1.56)
Deficit 1 Fat intake
Sufficient 0.671 1.05(0.82-1.35) ≤ 60 g/day 1
> 60 g/day 0.034 1.31(1.02-1.69)
Table 2. Hazard ratio based on bivariate Cox regression on risk factors of obesity in adults aged 25-65 years old
ables of smoking habit, fat intake, and interaction between smoking habit and time.
The results of this study was in accordance with the studies in Tanzania (Shayo & Mugusi 2011), Afghanistan (Mir Islam & Rasooly 2012),
2002). In their study, Gbary et al. (2014) found that the following factors: culture, attitude, and psychosocial were related to obesity in women in West Africa.
Factors affecting puberty were also shown to affect the risk of obesity in women. A longitu-dinal growth study performed in Finland showed that at the age of 31 years old, the prevalence of obesity in women who reached menarche before they were 11 years old was 15% as compared to 4% in those who had menarche at 15 years old and above (Laitinen et al. 2001). Fat accumula-tion during childhood increased the possibility of early menarche (Freedman et al. 2003) and young girls with early sexual maturation had lo-nger positive energy balance (Garn et al. 1986). Adipose tissue in the body increases following the age since at older age, the metabolic rate and energy expenditure decrease. Thus, older indivi-duals do not need more calories to maintain their body weight. If the calorie intake remains cons-tant or even increases, then the body weight will increase. Men need more calories to maintain their body weight since they have higher basal metabolism rate than women. In post-menopause women, obesity is the results of the decrease in metabolism rate and changes in ovarian hor-mones that increases the rate of body fat depo-sition depending on age and energy expenditure (Poehlman et al. 1995).
Simkin-Silverman and Wing (2000) stated that menopause in women correlates with in-creased body weight and central adiposity and decreased physical activity. This study has shown that smoking habit affected obesity. Subjects who were non-smokers, ex-smokers and passive smokers had the hazard ratio of 1.29, 1.89, and 2.06 times faster than those who were smokers. These results were in accordance to those of
Ci-hangir et al. (2004), Sugianti et al. (2009), Hou et al. (2008), and Sudikno et al. (2015) who found the correlation between smoking habit and the prevalence of obesity. Quitting from smoking is usually associated with an increase in body weight and change in metabolism of fat cells that results in increased activity of the enzyme lipo-protein lipase in adipose tissue. Increased activity of lipoprotein lipase usually affects the increase in body weight as a result of quitting from smo-king (Owen-Smith & Hannaford 1999; Ferrara et al. 2001).The results also showed that fat intake affected the prevalence of obesity. Subjects who consumed fat more than 60 g/day had a hazard ratio of 1.3 times faster than those who consumed ≤60 g/day of fat. According to Bray and Popkin (1998), increased consumption of fat, especially saturated fats, was associated with increased obe-sity cases. Drewnowski (2007) stated that contri-bution of sweet and fatty food to obesity showed a physiology mechanism that explained how fat intake had roles in the increase of body fat as the results of high energy density, tasty flavor of fatty food, high metabolic efficiency, weak satiety, and weak physiology regulation between fat and car-bohydrate intakes.
There were several limitations in the study (1) food consumption was measured only with 24-h food recall, (2) measurement of dietary pat-tern was only for the previous week, and (3) the existence of recall bias in measurement of food intake, dietary pattern, physical activity, level of stress, and smoking habit.
CONCLUSION
This study showed that gender, smoking habit, fat intake, and interaction between smok-ing habit and time affected the prevalence of Table 3. Final model of multivariate time-dependent Cox regression analysis on risk factors of obesity in adults aged 25-65 years old*
Risk factors β Wald p HR 95%CI
Gender
Male 1
Female 0.892 23.406 0.000 2.44 1.70-3.50
Smoking habit
Active smoker 1
Ex-smoker 0.637 2.984 0.084 1.89 0.91-3.89
Non-smoker 0.259 0.376 0.540 1.29 0.56-2.95
Passive smoker 0.726 5.070 0.024 2.06 1.09-3.89
Fat intake
≤ 60 g/day 1
> 60 g/day 0.268 4.249 0.039 1.30 1.01-1.68
Smoking habit*duration
Active smoker*duration 1
Ex-smoker*duration -0.040 2.197 0.138 0.96 0.91-1.01
Non-smoker*duration -0.048 2.374 0.123 0.95 0.89-1.01
Passive smoker*duration -0.078 11.083 0.001 0.92 0.88-0.96
obesity in adults aged 25-65 years old. Preven-tive measures by not smoking at early age and reducing fat intake are expected to lower the risk of obesity in adulthood.
ACKNOWLEDGEMENTS
The authors would like to thank the Head of National Institute of Health Research and De-velopment, Ministry of Health Indonesia, and the team of cohort study for non-communicable di-seases.
REFERENCES
Bray GA, Popkin BM. 1998. Dietary fat does af-fect obesity. Am J Clin Nutr 68:1157-1173. Cihangir E, Cengiz A, Hacihasanoglu A, Orhan
D, Topbas M, Ukinc K, Ersoz HO, Telatar M. 2004. Prevalence of obesity and asso-ciated risk factors in a Turkish population (Trabzon City, Turkey). Obesity research 12:1117-1127.
Del Parigi A, Chen K, Gautier JF, Salbe AD, Prat-ley RE, Ravussin E, Reiman EM, Tataran-ni PA. 2002. Sex differences in the human brain’s response to hunger and satiation. Am J Clin Nutr. 75:1017-1022.
[Depkes RI] Departemen Kesehatan Republik Indonesia. 2008. Laporan Hasil Riset Kes-ehatan Dasar Tahun 2007. Jakarta: Depkes RI.
Despre´s JP, Lemieux I, Bergeron J, Pibarot P, Mathieu P, Larose E, Rode´s-Cabau J, Bertrand OF, Poirier P. 2008. Abdominal obesity and the metabolic syndrome: Con-tribution to global cardiometabolic risk. Arterioscler Thromb Vasc Biol 28:1039-1049.
Diana R, Yuliana I, Yasmin G, Hardinsyah. 2013. Faktor risiko kegemukan pada wanita de-wasa Indonesia. J Gizi Pangan 8(1):1-8. Drewnowski A. 2007. The real contribution of
added sugars and fats to obesity. Epide-miol Rev 29:160-171. doi: 10.1093/epirev/ mxm011.
Ferrara CM, Kumar M, Nicklas B, McCrone S, Goldberg AP. 2001. Weight gain and adi-pose tissue metabolism after smoking ces-sation in women. Int J Obes Relat Metab Disord 25:1322-1326.
Franssen R, Monajemi H, Stroes ES, Kastelein JJ. 2011. Obesity and dislipidemia. Med Clin North Am 95(5):893-902.
Freedman DS, Khan LK, Serdula MK, Dietz WH, Srinivasan SR, Berenson GS. 2003. The relation of menarcheal age to obesity in childhood and adulthood: the Bogalusa heart study. BMC Pediatr 30:3-12.
Garn SM, LaVelle M, Rosenberg KR, Hawthorne VM. 1986. Maturational timing as a factor in female fatness and obesity. Am J Clin Nutr 43(6):879-883.
Gbary AR, Kpozehouen A, Houehanou YC, Djro-lo F, Amoussou MPG, Tchabi Y, Salamon R, Houinato DS. 2014. Prevalence and risk factors of overweight and obesity: findings from a cross-sectional community-based survey in Benin. Global Epidemic Obesity 2(1):3. doi:10.7243/2052-5966-2-3. Hardinsyah, Riyadi H, Napitupulu V. 2012.
Ke-cukupan energi, protein, lemak dan karbo-hidrat. Makalah WKNPG. page:1-27. Hosmer DW, Lemeshow S. 2000. Apllied
Lo-gistic Regression: second edition. New York: John Wiley & Sons.
Hou X, Jia W, Bao Y, Lu H, Jiang S, Zuo Y, Gu H, Xiang K. 2008. Risk factors for overweight and obesity, and changes in body mass in-dex of Chinese adults in Shanghai. BMC Public Health 8:389. doi:10.1186/1471-2458-8-389.
Jafar TH, Chaturvedi N, Pappas G. 2006. Preva-lence of overweight and obesity and their association with hypertension and diabe-tes mellitus in an Indo-Asian population. CMAJ 175(9):1071-1077.
[Kemenkes] Kementerian Kesehatan Republik Indonesia. 2013. Peraturan Menteri Ke-sehatan Nomor 30 Tahun 2013 tentang Pencantuman informasi kandungan gula, garam, dan lemak serta pesan kesehatan untuk pangan olahan dan pangan siap saji (Berita Negara Republik Indonesia Tahun 2013 Nomor 617). Jakarta: Kemenkes RI. Kurukulasuriya LR, Stas S, Lastra G, Manrique
C, Sowers JR. 2011. Hypertension in obe-sity. Med Clin North Am 95(5):903-917. Laitinen J, Power C, Jarvelin MR. 2001.
Fam-ily social class, maternal body mass in-dex, childhood body mass inin-dex, and age at menarche as predictors of adult obesity. Am J Clin Nutr 74:287-294.
Lee YS, So JBY, Deurenberg-Yap M. 2009. Confronting the obesity epidemic: Call to Arms. Annals Academy of Medicine 38(1). Lemeshow S. 1997. Besar Sampel dalam Pene-litian Kesehatan (Terjemahan Dibyo Pra-mono). Yogyakarta: Gajah Mada Univer-sity Press.
Lestari H, Siswanto. 2007. Pemodelan risiko kejadian diabetes mellitus (Analisis data surkesnas 2004). Buletin Penelitian Kes-ehatan 35(1):25-35.
Low S, Mien CC, Deurenberg-Yap M. 2009. Re-view on epidemic of obesity. Annals Acad-emy of Medicine 38(1):57-65.
Marliyati SA, Simanjuntak M, Kencana DS. 2010. Sosial ekonomi dan indeks massa tubuh (IMT) pria dewasa dalam kaitannya dengan faktor risiko penyakit jantung ko-roner di perdesaan dan perkotaan Bogor-Jawa Barat. J Gizi Pangan 5(1):15-25. Mir Islam SK, Rasooly MH. 2013. Prevalence
and risk factors associated with obesity among adult Kabul citizens (Afghanistan), 2012. IJDO 4(4):152-161.
Mokdad AH, Ford ES, Bowman BA, Dietz WH, Vinicor F, Bales VS, Marks JS. 2003. Prev-alence of obesity, diabetes and obesity-re-lated health risk factors. JAMA 289(1):76-79. doi:10.1001/jama.289.1.76.
Oanh TT, Nguyen DN, Philayrath P, Dibley MJ, Bauman AE. 2009. Prevalence and risk factors with overweight and obesity among Vietnamese adults: Caucasian and Asian cut-offs. Asia Pac J Clin Nutr 18(2):226-233.
Owen-Smith V, Hannaford PC. 1999. Stopping smoking and body weight in women liv-ing in the United Kliv-ingdom. Br J Gen Prac 49:989-990.
Peeters A, Barendregt JJ, Willekens F, Macken-bach JP, Al Mamun A, Bonneux L. 2003. Obesity in adulthood and its consequences for life expectancy: a life-table analysis. Ann Intern Med 138:24-32.
Poehlman ET, Toth MJ, Gardner AW. 1995. Changes in energy balance and body com-position at menopause: a controlled longi-tudinal study. Ann Intern Med 123(9):673-675.
[Riskesdas] Riset Kesehatan Dasar. 2013. Risk-esdas 2013. Jakarta: Badan Litbang Kese-hatan.
Riyadina W et al. 2012. Laporan Akhir Penelitian Studi Kohor Tumbuh Kembang Anak dan Faktor Risiko Penyakit Tidak Menular Ta-hun 2012. Jakarta: Badan Litbangkes Ke-menterian Kesehatan RI.
Riyadina W, Kodim N, Madanijah S. 2017. De-terminan obesitas pada perempuan pasca-menopause di Kota Bogor tahun 2014. Gizi Indon 40(1):45-58.
Saleh R. 2015. Abdominal obesity and cardio-vascular disease. Adv Obes Weight Man-ag Control 3(2):00046. doi: 10.15406/ aowmc.2015.03.00046.
Schmandt RE, Iglesias DA, Co NN, Lu KH. 2011. Understanding obesity and endometrial
cancer risk: Opportunities for prevention. Am J Obstet Gynecol 205(6):518-525. Shayo GA, Mugusi FM. 2011. Prevalence of
obesity and associated risk factors among adults in Kinondoni municipal district, Dar es Salaam Tanzania. BMC Public Health 11:365.
Sidik SM, Rampal L. 2009. The prevalence and factors associated with obesity among adult women in Selangor, Malaysia. Asia Pac Fam Med 8(1):2. doi:10.1186/1447-056X-8-2.
Sihombing M, Tjandrarini DH. 2015. Fak-tor risiko sindrom metabolik pada orang dewasa Di Kota Bogor. Panel Gizi dan Makanan 38(1):21-30.
Simkin-Silverman LR, Wing RR. 2000. Weight gain during menopause. Is it inevitable or can it be prevented? Postgrad Med 108(3):47-50.
Sudikno, Syarief H, Dwiriani CM, Riyadi H. 2015. Faktor risiko overweight dan obese pada orang dewasa di Indonesia. (Analisis data Riset Kesehatan Dasar 2013). Gizi In-don 38(2):91-104.
Sudikno, Syarief H, Dwiriani CM, Riyadi H. 2015. Faktor risiko obesitas sentral pada orang dewasa umur 25-65 tahun di Indo-nesia (Analisis data Riset Kesehatan Dasar 2013). Penel Gizi Makan 38(2):111-120. Sudikno, Syarief H, Dwiriani CM, Riyadi H,
Pra-dono J. 2017. The relationship of obesity index and lipid profile in 25-65 year-old dults in Bogor City (Baseline data of co-hort study on non-communicable disease in Bogor City, West Java Province). IJS-BAR 33(1):323-331.
Sugianti E, Hardinsyah, Afriansyah N. 2009. Fak-tor risiko obesitas sentral pada orang de-wasa di DKI Jakarta: Analisis Lanjut Data Riskesdas 2007. Gizi Indon 32(2):105-116.
[WHO] World Health Organization. 2000. Obe-sity: Preventing and Managing the Global Epidemic. Report of a WHO Consultation. Geneva: WHO.
[WHO] World Health Organization. 2011. Global Physical Activity Questionnaire (GPAQ). Geneva: WHO.
[WHO] World Health Organization. 2013. Obe-sity and Overweight. Report 311. Geneva, Switzerland: WHO.