Full Terms & Conditions of access and use can be found at
http://www.tandfonline.com/action/journalInformation?journalCode=ubes20
Download by: [Universitas Maritim Raja Ali Haji], [UNIVERSITAS MARITIM RAJA ALI HAJI
TANJUNGPINANG, KEPULAUAN RIAU] Date: 11 January 2016, At: 20:19
Journal of Business & Economic Statistics
ISSN: 0735-0015 (Print) 1537-2707 (Online) Journal homepage: http://www.tandfonline.com/loi/ubes20
Comment
Chiara Scotti
To cite this article: Chiara Scotti (2014) Comment, Journal of Business & Economic Statistics, 32:4, 504-506, DOI: 10.1080/07350015.2014.956873
To link to this article: http://dx.doi.org/10.1080/07350015.2014.956873
Published online: 28 Oct 2014.
Submit your article to this journal
Article views: 94
View related articles
504 Journal of Business & Economic Statistics, October 2014
Analysis,” ECB Working Paper No. 944, European Central Bank, Frank-furt, Germany. [501]
Del Negro, M., Hasegawa, R. B., and Schorfheide, F. (2014), “Dynamic Pre-diction Pools: An Investigation of Financial Frictions and Forecasting Per-formance,” Paper Presented at the 8th ECB Workshop on Forecasting Tech-niques, 13–14 June 2014, Frankfurt. [503]
Geweke, J., and Amisano, G. (2011), “Optimal Prediction Pools,”Journal of Econometrics, 164, 130–141. [503]
Kenny, G., and Morgan, J. (2011), “Some Lessons From the Crisis for the Economic Analysis,” ECB Occasional Paper No. 130, European Central Bank, Frankfurt, Germany. [502]
Kn¨uppel, M., and Schultefrankenfeld, G. (2012), “How Informative are Cen-tral Bank Assessments of Macroeconomic Risks,”International Journal of Central Banking, 8, 87–139. [503]
Leeper, E. M. (2003), “An Inflation Report,” NBER Working Paper No. 10089, National Bureau of Economic Research, Cambridge, MA. [502]
Samuelson, P.A. (1965), “Economic Forecasting and Science,”Michigan Quar-terly Review, 4, 274–280. [502]
Stockton, D. (2012), “Review of the Monetary Policy Committee’s Forecasting Capability,” Report presented to the Court of the Bank of England. Available at http://www.bankofengland.co.uk/publications/Documents/news/2012/ cr3stockton.pdf. [500]
Comment
Chiara S
COTTIFederal Reserve Board, Washington, D.C. 20551 ([email protected])
1. INCLUDING FINANCIAL INFORMATION INTO THE FORECASTING PROCESS
Asset prices represent a class of potentially useful predic-tors of inflation and output growth because they are forward-looking. They have been considered in this regard for a long time. Mitchell and Burns (1938), for example, included the Dow Jones composite index of stock prices in their initial list of leading indicators of expansions and contractions in the U.S. economy. Since then, the literature has grown considerably and a number of asset prices have been identified as good predic-tors of economic activity and inflation, namely, interest rates, term spreads or slope, stock returns, dividend yields, and ex-change rates, among others. As shown in Stock and Watson (2003), some asset prices have a significant marginal predic-tive content for output growth at some times in some coun-tries. However, it might be difficult to know ex-ante what asset price works in which country because its importance might change over time. Moreover, the existing literature has focused on in-sample analysis to identify predictive relations, which is no guarantee of a good out-of-sample performance. For these reasons, it has been difficult to systematically use asset price information for macroeconomic forecasting, although central banks have surely been using them to guide their judgmental forecasts.
AGOPP consider a large number of financial series, and gen-erate a prediction through a mixed-data sampling (MIDAS) regression from each one of these series. They then employ Bayesian model averaging to combine the K macro predictions coming from the K financial series. Through this method, they let the data determine which forecast should have the highest weight and which financial series should therefore be treated as most prominent. Their main exercise, however, covers the period 2008Q2 to 2012Q4, the height of the European debt crisis, a period in which the macro-finance link was particu-larly strong. Not surprisingly, they find that fixed income vari-ables, especially the short-end of the curve and the VSTOXX, are among the best explanatory variables. In what follows, I will expand on the issue of including financial information into macro forecasting and on the impact of uncertainty on macro variables.
2. EURO-AREA FORECASTING WITH FINANCIAL INFORMATION
Central banks around the world have recognized the impor-tance of financial information for some time. Because there are lots of financial series that could potentially be considered, an alternative to AGOPP could be to first consolidate finan-cial information into one series. One example is to construct a stress index that summarizes, through a principal component analysis, a number of euro-area financial variables that are be-lieved to be useful indicators of financial stress (Pruitt2012). These include market information from equities (return, volatil-ity, correlation, and bid-ask spreads), sovereign bond yields, credit default swaps, LIBOR-OIS spreads, and corporate AAA-BBB bond spreads.
Figure 1shows the evolution since 1991 of financial stress and GDP in the euro area. Financial stress is high in the early part of the sample due largely to the European Exchange Rate Mechanism (ERM) crisis. From the mid-1990s, the financial stress index declines and remains low until the 2008 global financial crisis and, subsequently, the European debt crisis. The advantage of using a stress index is that this factor is the one linear combination of all series that explains as much of their joint variance as possible and as such it filters out the noisy information idiosyncratic to the specific underlying series. Since the stress index can be constructed daily, it might be interesting to run the MIDAS regressions with the stress index.
Just to confirm the importance of the link between financial information and macroeconomic activity, I include the stress index into a five-variable SVAR after euro-area GDP growth, inflation rate, labor productivity growth, and the 3- month in-terest rate. This methodology is motivated by the work of Van Roye (2011) and Carlson et al. (2008). I run the SVAR with and without the stress index over the period 1991–2013 and 1991–2007. As shown inTable 1, in both samples, including
© 2014American Statistical Association Journal of Business & Economic Statistics October 2014, Vol. 32, No. 4 DOI:10.1080/07350015.2014.956873 Color versions of one or more of the figures in the article can be found online atwww.tandfonline.com/r/jbes.
Scotti: Comment 505
Figure 1. Euro-area 4-quarter GDP growth (left-hand scale) and stress index (right-hand scale).
and excluding the crisis, the likelihood ratio test would fail to reject the hypothesis that the stress index contribution is zero.
1991–2013 1991–2007 SVAR with SI 93.2 132.6 SVAR ex SI 68.5 89.8 LR test (χ92) 49.5 85.4
In a small Bayesian VAR model, Van Roye (2011) found that about 15% of variation in real GDP growth can be accounted for variations in financial stress for Germany and about 30% in the euro area. He also shows that the inclusion of the indicator significantly improves out-of-sample forecasting accuracy for real GDP growth in Germany compared to a model without the indicator and other forecast benchmarks.
3. THE ROLE OF UNCERTAINTY
A growing literature has focused on analyzing the relation-ship between real activity and uncertainty, and the latter has been generally found to have a significant role in firms’ hiring deci-sions (employment) and output. Uncertainty, however, has not generally been considered in the macro forecasting world. (The uncertainty that I am referring to differs from parameter or model uncertainty, which have in contrast received more attention in the macro forecasting world.) Starting from the seminal work by Bloom (2009), a number of authors have tried to measure un-certainty, which is not observable, and to quantify its impact on the real economy. Since its impact is not trivial, further analysis is probably necessary also when it comes to macro forecasting. AGOPP, by including the VSTOXX in their list of variables, is a good start in this direction. Because measuring uncertainty is challenging, realized and implied stock market volatility have in fact been commonly used as proxies. Recent literature, how-ever, has focused on developing alternative uncertainty mea-sures, such as the economic policy uncertainty measure (Baker, Bloom, and Davis2013) and the real-time, real-activity uncer-tainty index (Scotti2013). The problem with using uncertainty as defined by the VIX or VSTOXX is that these measures tend to combine economic uncertainty with other notions, like infor-mation about stock market volatility. When trying to identify the importance of financial information in macro forecasting, it might therefore be useful to disentangle the part of uncertainty, which relates to the state of the economy (pure macro uncer-tainty) and a more general (financial and macro) uncertainty,
as measured by the VIX. Part of the uncertainty measured by implied stock market volatility is not financial information, but it is simply macroeconomic uncertainty, uncertainty about the state of the economy.
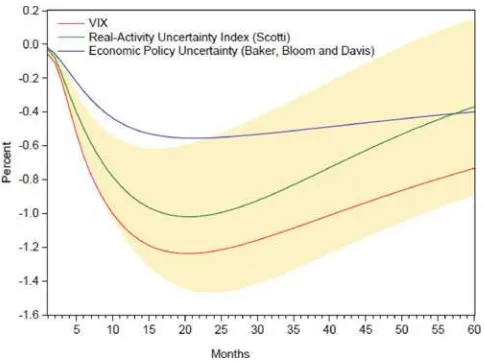
As shown in Figure 2, pure economic uncertainty, as mea-sured by the Scotti real-activity uncertainty index, has an im-pact on employment. (figure taken from Scotti 2013). The figure shows the impulse-responses from a bivariate VAR exercise with employment and uncertainty proxies for the United States over the last decade: the VIX, the economic policy uncertainty in-dex and the real-activity uncertainty inin-dex. The analysis shows evidence that even when uncertainty is just related to economic conditions, it has an important impact on employment. How-ever, when uncertainty is more generally related to economic and financial conditions, as measured by the VIX, its impact on real-activity variables seems to be stronger and more pro-longed than when uncertainty is strictly related to real activ-ity, as measured by real-activity uncertainty index, or to eco-nomic policy, as measured by the ecoeco-nomic policy uncertainty index.
Interestingly, once we consider uncertainty about the state of the economy, we need to start thinking about the distribution of macro outcomes and the probability of tail events. This notion is clearly linked to the FRBNY scenario-driven risk profiles analyzed in AGOPP.
Figure 2. Employment response to a one-standard-deviation shock in the different uncertainty proxies. The shaded area represents the +/−
one standard error confidence interval for the real-activity uncertainty index.
506 Journal of Business & Economic Statistics, October 2014
4. CONCLUSIONS
The financial crisis has clearly proven the importance of the link between macro and finance, and has emphasized the im-portance of recognizing a role for uncertainty. AGOPP present an interesting summary of the forecasting methods adopted by two of the major central banks, and give applied forecasters use-ful suggestions for further work that can help improve central banks’ forecasts.
DISCLAIMER
The views expressed here are solely the responsibility of the author and should not be interpreted as reflecting the view of the Board of Governors of the Federal Reserve System or of any other person associated with the Federal Reserve System.
[Received May 2014. Accepted August 2014.]
REFERENCES
Baker, S. R., Bloom, N., and Davis, S. J. (2013), “Measuring Economic Policy Uncertainty,” Working Paper. [505]
Bloom, N. (2009), “The Impact of Uncertainty Shocks,”Econometrica, 77, 623–685. [505]
Carlson, M. A., King, T. B., and Lewis, K. F. (2008), “Distress in the Financial Sector and Economic Activity,”B.E. Journal of Economic Analysis and Policy, 11, 35. [504]
Mitchell, W. C., and Burns, A. F. (1938),Business Cycle Indicators, Princeton: Princeton University Press, pp. 162–183. [504]
Pruitt, S. (2012), “Financial Stress Indexes for the Euro Area,” working paper. [504]
Scotti, C. (2013), “Surprise and Uncertainty Indexes: Real-Time Aggregation of Real-Activity Macro Surprises,” International Finance Discussion Papers 1093, Board of Governors of the Federal Reserve System (U.S.). [505] Stock, J. H., and Watson, M. W. (2003), “Forecasting Output and Inflation:
The Role of Asset Prices,”Journal of Economic Literature, 41, 788–829. [504]
Van Roye, (2011), “Financial Stress and Economic Activity in Germany and the Euro Area,” Kiel Discussion Paper 1743, Kiel Institute for the World Economy (ifW). [505]
Comment
Kirstin H
UBRICHand Simone M
ANGANELLIResearch Department, European Central Bank, 60311 Frankfurt am Main, Germany ([email protected]; [email protected])
According to a famous saying, one “should never ask what’s inside a sausage and an economic forecast.” We still do not dare to ask how a bratwurst is made, but the authors are to be commended for having written an article that brings to a wider audience an overview of how the forecasting process is con-ducted in two major central banks, the European Central Bank (ECB) and the Federal Reserve Bank of New York (FRBNY). The reader can appreciate the many challenges faced by fore-casters, who have to address a wide variety of issues, ranging from data aggregation, incorporation of judgment, model com-bination, mixed frequency data, and structural breaks. Fore-casters in central banks, unlike foreFore-casters in academia, do not have the luxury to postpone their analysis if they find major roadblocks on their way: their forecasts are needed at regular frequency as a major input into the monetary policy decision process.
The article starts with an in-depth description of the forecast-ing process at the ECB and the FRBNY. Readers interested in understanding the institutional background behind the forecasts will find this section particularly useful. It then compares and evaluates point forecasts produced by the ECB and FRBNY for gross domestic product (GDP) and inflation during the global financial crisis. A related section is dedicated to explore how and to what extent the inclusion in the forecasting model of high-frequency financial variables improves the macroeconomic forecasts. The article also has a section discussing the develop-ment of a broader conceptual framework for the forecasting process, emphasizing in particular scenario-driven forecasting schemes and distributional features to evaluate macroeconomic risks.
In this commentary, we will first provide some broader com-ments about the nature and characteristics of forecasting in cen-tral banks, followed by more specific suggestions about the analysis and results presented in the article.
1. BROADER COMMENTS
The broader comments are interrelated and call for central bank forecasters to give more insight into how forecasts enter the central banker’s decision-making process.
It would be incredibly helpful to the reader to know how fore-casts are used in a central bank. The authors are rather silent on this aspect, as a discussion about the purpose of the forecast is missing. From a purely econometric and decision theory per-spective, forecasts serve the purpose to help the decision maker to take better decisions. However, since central banks are major players in financial markets and in the macroeconomy in gen-eral, one could think that the publication of forecasts may also serve to coordinate market expectations. In other words, there is a strategic element in the production and publication of the forecasts which in our opinion deserves more discussion.
Pushing deeper along these lines, Clive Granger has nailed into our heads the concept that forecast evaluations cannot be carried out in a vacuum, but rather need to take into account
© 2014American Statistical Association Journal of Business & Economic Statistics October 2014, Vol. 32, No. 4 DOI:10.1080/07350015.2014.956874 Color versions of one or more of the figures in the article can be found online atwww.tandfonline.com/r/jbes.