CHAPTER III
RESEARCH METHOD
This chapter discusses the research designand the design strategies underpinning this research study. In addition, the chapter discusses the research design and approach which used in the study including place and time of the research, population and sample, instruments, endorsment of the data, data collecting procedure, data analysis while explaining the stages and processes involved in the study, and method for verification the research findings.
A. Research Type
The research type of this study was descriptive quantitative his research purely quantitative with questionnaire as the main instrument to obtain the data which in the form of numerical in the statistic analysis. Wido states the descriptive research is a research that involving the collection of the data for the purpose of describing exiting conditions.1Descriptive study is a type of research that happened naturally, has no control over the condition and the situation, and could only measure what already exist.2
1
Wido H. Toendan, 2013. “Research Methods”, University of Palangka Raya. 2
Norjenah, 2012. “The Students’ Perception Toward EFL Teachers’ Feedback on Oral
Performance ofthe Seventh Grade Students of Mtsn 1 Model Palangkara Raya”, Unpublished Thesis,
Palangka Raya: State Islamic College of Palangka Raya, p.37
B. Research Design
The research design of this study was a survey research. A survey is any activity that collects information in an organized and methodical manner about characteristics of interest from some or all units of apopulation using well-defined concepts, methods and procedures, and compiles such information into a useful summary form.3In one line, survey is a procedure used by the researcher to describe the attitudes, opinions, behaviors, or characteristics of the population.4
While in this study was descriptive with survey research, there a few common characteristics in it:
1. A pre-established instrument has most likely been developed by the researcher.
2. Most responses to the questions on the survey are quantitative (e.g., ratings) or will be summarized in a quantitative way.
3. The sample is selected from a larger population or group to allow the study’s findings to be generalized back to the larger group.5
C. Population and sample 1. Population
3
Statistics Canada. 2003. Survey Methods and Practice.p.1 4
John W. Creswell, 2012. Educational Research: Planning, Conducting and Evaluating Quantitative and Qualitative Research, Boston: Pearson Education Inc, p. 376
5
Marguerite G. Lodico, Dean T. Spaulding, Katherine H. Voegtle, 2006. Method in Educational Research, San Francisco: Jossey-Bass a Wiley Imprint, p. 156-157
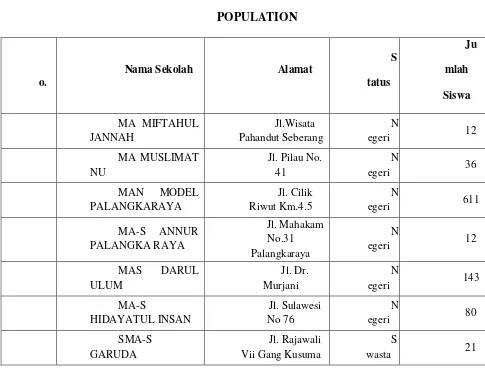
Population is defined as all members of any well-defined class of people, events, or objects.6 While in this study, the population was the students of all Senior High Schools in Palangka Raya. In total there are 40 Senior High Schools in Palangka Raya.
The population data of senior high schools in Palangka Raya can be seen in the following table:
Table 3. 1 POPULATION
o.
Nama Sekolah Alamat
S
tatus
Ju
mlah
Siswa
MA MIFTAHUL JANNAH
Jl.Wisata Pahandut Seberang
N
egeri 12
MA MUSLIMAT NU
Jl. Pilau No. 41
N
egeri 36
MAN MODEL
PALANGKARAYA
Jl. Cilik Riwut Km.4.5
N
egeri 611
MA-S ANNUR
PALANGKA RAYA
Jl. Mahakam No.31 Palangkaraya
N
egeri 12
MAS DARUL
ULUM
Jl. Dr. Murjani
N
egeri 143
MA-S
HIDAYATUL INSAN
Jl. Sulawesi No 76
N
egeri 80
SMA-S GARUDA
Jl. Rajawali Vii Gang Kusuma
S
wasta 21
6
PALANGKA RAYA Jaya
SMA-S ISEN
MULANG
Jl. Dr. Wahidin Sudiro
Husodo
S
wasta 307
SMA-S KARYA PALANGAKA RAYA
Jl. Cilik Riwut Km. 15
Sakan V
S
wasta 132
0
SMA-S
KATOLIK ST PT.
KANISIUS
Jl. Cilik Riwut
S
wasta 265
1 SMA-S KRISTEN Jl. Diponegoro Nomor 1 S
wasta 624
2
SMA-S
MUHAMMADIYAH 1 PALANGKA RAYA
Jl. Rta Milono Km. A.5
S
wasta 671
3
SMA-S
MUHAMMADIYAH 2 PALANGKA RAYA
Jl. Demak S
wasta 26
4
SMA-S
NAHDIATUL ULAMA
Jl. Rta. Milono Km. 3
S
wasta 169
5 SMA-S NUSANTARA Jl. Dr. Wahidin Sudirohusodo S
wasta 386
6 SMA-S PGRI – 1
Jl. Putri Junjung Buih
S
wasta 80
7 SMA-S PGRI – 2 Jl. Hiu Putih
S
wasta 65
8
SMA-S PURNAMA
PALANGKA RAYA
Jl. Patih Rumbih No. 03
S
wasta 57
9
SMAN 1
PALANGKA RAYA
Jl. Ade Irma Suryani Nasution N egeri 1.2 08 0
SMAN 2
PALANGKA RAYA
Jl. Ks Tubun No. 02
N
1
SMAN 3
PALANGKA RAYA
Jl. G. Obos No. 12 N egeri 1.1 3 2
SMAN 4
PALANGKA RAYA
Jl. Sisinga Maharaja III
N
egeri 212
3
SMAN 5
PALANGKA RAYA Jl. Tingang
N
egeri 281
4
SMAN 6
PALANGKA RAYA
Jl. Cilik Riwut Km. 29
N
egeri 333
5
SMAN 7
PALANGKARAYA
Jl. Bukit Manuah
N
egeri 19
6
SMK (SMEA)
ISEI PALANGKA
RAYA
Jl. Yos Sudarso No. 15
S
wasta 10
7
SMK (SMEA)
ISEN MULANG
Jl. Dr. Wahidin Sudirohusodo
S
wasta 48
8
SMK (STM) AL
ISHLAH Jl. Mahakam
S
wasta 25
9
SMK(STM) BETHEL PALANGKA RAYA
Jl. Aries No. 4 Lantai Ii Amaco
S
wasta 15
0
SMK KARSA
MULYA
Jl. G. Obos Km. 4.5
S
wasta 191
1
SMK KECIL
NEGERI 1
PALANGKA RAYA
Jl. Mawar N
egeri 35
2
SMK KECIL
NEGERI 2
PALANGKA RAYA
Jl. Tjilik Riwut Km. 33
N
egeri 41
3 SMK KRISTEN
Jl. Diponegoro
S
wasta -
4 SMK NASIONAL Jl. Tambun Bungai S
wasta -
5
SMK NEGERI 5
PALANGKA RAYA Jl. Matal
N
6
SMKN - 6
PALANGKA RAYA Panjehang
N
egeri -
7
SMKN 1
PALANGKA RAYA
Jl. Tambun Bungai
N
egeri 550
8
SMKN 2
PALANGKA RAYA
Jl. Ra. Kartini
N
egeri 211
9
SMKN 3
PALANGKA RAYA
Jl. Ra Kartini No. 25
N
egeri 214
0
SMKN 4
PALANGKA RAYA
Jl. Seth Adjie
N
egeri 18
2. Sample
A sample is a portion of a population.7 In this study the writer used the cluster random sampling criteria or called as clustering sampling technique. Because, in this case the population of Palangka Raya Senior High Schools students too large that the writer cannot list all members of students for the purpose of drawing a simple random sample.Cluster random sampling is the type of sampling technique that the unit chosen is not an individual but, rather, a group of individuals who are naturally together.8Cluster random sampling is used when it is more feasible or convenient to select groups of individual that it is to select individuals from a defined population.9
Another statement that refer to this research by Borg and Gall that “for
survey research, it is desirable to have at least 100 subjects in each major
7
Ibid.Donald Ary, Lucy Cheser Jacobs, Chris Sorensen, and Asghar Razavieh, Introduction to Research in Education, ....
8Ibid,
Donald Ary, Lucy Cheser Jacobs, Chris Sorensen, and Asghar Razavieh, Introduction to Research in Education, ....
9
subgroup and 20 to 50 in each minor subgroup whose responses are to be analyzed”.10
While in this research the writer used some step to establish based on the clustering random sampling technique. Firstly, the writer chosen the major subgroup (school)randomly for 10% from the total of population: 40:10%= 4 major subgroup / senior high schools, namely;MAN Model Palangka Raya (Islamic senior high school), MA Muslimat – N.U Palangka Raya (Islamic senior high school), SMA Negeri 4 Palangka Raya and SMK Negeri 2 Palangka Raya. Secondly, the writer selecta random sampleof one minor subgroup (class)on the second grade from within each these schools in total there are 4 classes, namely; XI-Bahasa of MAN Model, XI-IPA of MA Muslimat N.U, XI-Bahasa / 10 of SMA Negeri 4, and XI-APK / 01 of SMK Negeri 2. The last step, the writer includes all students from each of these classes in totally 134 students as the samples.
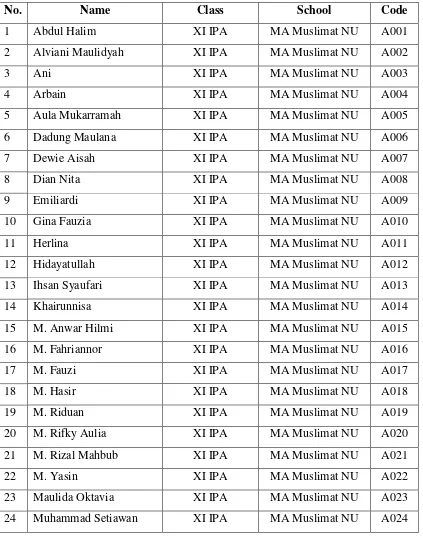
The samples data were selected based on the cluster random sampling technique in the following table:
10
Table 3. 2
Sample Result Based on the Simple Clustering Technique
No. Name Class School Code
1 Abdul Halim XI IPA MA Muslimat NU A001
2 Alviani Maulidyah XI IPA MA Muslimat NU A002
3 Ani XI IPA MA Muslimat NU A003
4 Arbain XI IPA MA Muslimat NU A004
5 Aula Mukarramah XI IPA MA Muslimat NU A005
6 Dadung Maulana XI IPA MA Muslimat NU A006
7 Dewie Aisah XI IPA MA Muslimat NU A007
8 Dian Nita XI IPA MA Muslimat NU A008
9 Emiliardi XI IPA MA Muslimat NU A009
10 Gina Fauzia XI IPA MA Muslimat NU A010
11 Herlina XI IPA MA Muslimat NU A011
12 Hidayatullah XI IPA MA Muslimat NU A012
13 Ihsan Syaufari XI IPA MA Muslimat NU A013
14 Khairunnisa XI IPA MA Muslimat NU A014
15 M. Anwar Hilmi XI IPA MA Muslimat NU A015
16 M. Fahriannor XI IPA MA Muslimat NU A016
17 M. Fauzi XI IPA MA Muslimat NU A017
18 M. Hasir XI IPA MA Muslimat NU A018
19 M. Riduan XI IPA MA Muslimat NU A019
20 M. Rifky Aulia XI IPA MA Muslimat NU A020
21 M. Rizal Mahbub XI IPA MA Muslimat NU A021
22 M. Yasin XI IPA MA Muslimat NU A022
23 Maulida Oktavia XI IPA MA Muslimat NU A023
25 Nordiyanti XI IPA MA Muslimat NU A025
26 Putri Tunggal Dewi XI IPA MA Muslimat NU A026
27 Rahmad Padillah XI IPA MA Muslimat NU A027
28 Rahmad Shomadi XI IPA MA Muslimat NU A028
29 Reza Mahdi XI IPA MA Muslimat NU A029
30 Reza Ramadhan XI IPA MA Muslimat NU A030
31 Risna Wati XI IPA MA Muslimat NU A031
32 Rizky Aulia Nanda A XI IPA MA Muslimat NU A032
33 Roesmegawati XI IPA MA Muslimat NU A033
34 Salasiah A XI IPA MA Muslimat NU A034
35 Salman Al-Farizi XI IPA MA Muslimat NU A035
36 Vira Cantika Khalbina XI IPA MA Muslimat NU A036 37 Afifah Ayura Firdaus XI BAHASA MA Negeri Model B037 38 Amaliya Mulyanor XI BAHASA MA Negeri Model B038
39 Asri Mulandari XI BAHASA MA Negeri Model B039
40 Aula Mliani XI BAHASA MA Negeri Model B040
41 Dea Aulia XI BAHASA MA Negeri Model B041
42 Dessy Wulandari Saputri XI BAHASA MA Negeri Model B042 43 Dwi Cahyo Ramadhan XI BAHASA MA Negeri Model B043 44 Edo Suryo Bintoro XI BAHASA MA Negeri Model B044 45 Farah Yumnaa M Ar XI BAHASA MA Negeri Model B045 46 Fathiya Rosyada XI BAHASA MA Negeri Model B046
47 Fatmawati XI BAHASA MA Negeri Model B047
48 Fuziah XI BAHASA MA Negeri Model B048
49 Helda Raysa XI BAHASA MA Negeri Model B049
50 Hilmansyah XI BAHASA MA Negeri Model B050
52 Mauladi A Asyawali XI BAHASA MA Negeri Model B052 53 Maulidia Astuti XI BAHASA MA Negeri Model B053 54 M. Ridwan Farid XI BAHASA MA Negeri Model B054 55 Muhammad Rizqan XI BAHASA MA Negeri Model B055
56 Mutiani XI BAHASA MA Negeri Model B056
57 Nina XI BAHASA MA Negeri Model B057
58 Novia Khairina XI BAHASA MA Negeri Model B058
59 Rahmawati XI BAHASA MA Negeri Model B059
60 Rena Apriana XI BAHASA MA Negeri Model B060
61 Rona Sekar Ayu XI BAHASA MA Negeri Model B061
62 Siti Munawarah XI BAHASA MA Negeri Model B062
63 Syifauddin M Al Zuhri XI BAHASA MA Negeri Model B063
64 Tiara XI BAHASA MA Negeri Model B064
65 Tirra Nugrahani Dewi XI BAHASA MA Negeri Model B065
66 Zahratun Nisa XI BAHASA MA Negeri Model B066
67 Zakiah XI BAHASA MA Negeri Model B067
68 Zella Nur Qayyimah XI BAHASA MA Negeri Model B068 69 Zhapyrend Putri Sangadji XI BAHASA MA Negeri Model B069 70 Angeni Kristalesalonika XI-10 BAHASA SMA Negeri 4 C070
71 Arfiana XI-10 BAHASA SMA Negeri 4 C071
72 Ragus Wahyudi XI-10 BAHASA SMA Negeri 4 C072
73 Brianson Topan Prayogi XI-10 BAHASA SMA Negeri 4 C073 74 Cristoperus Andrian XI-10 BAHASA SMA Negeri 4 C074 75 Cris Dogi Prioky XI-10 BAHASA SMA Negeri 4 C075
76 Dwi Prasetyo XI-10 BAHASA SMA Negeri 4 C076
79 Fitriani XI-10 BAHASA SMA Negeri 4 C079
80 Giyan XI-10 BAHASA SMA Negeri 4 C080
81 Henny Hidayatul Adha XI-10 BAHASA SMA Negeri 4 C081
82 I Gde Awan XI-10 BAHASA SMA Negeri 4 C082
83 Indrianan Lame C.K XI-10 BAHASA SMA Negeri 4 C083 84 Jessica Maria Fernanda XI-10 BAHASA SMA Negeri 4 C084 85 Joshua Arbiyanto XI-10 BAHASA SMA Negeri 4 C085
86 Juliano Parera XI-10 BAHASA SMA Negeri 4 C086
87 Khezia Lapang Atei A XI-10 BAHASA SMA Negeri 4 C087
88 Ria Agustin XI-10 BAHASA SMA Negeri 4 C088
89 Richard Melkhy XI-10 BAHASA SMA Negeri 4 C089
90 Rima Januarini XI-10 BAHASA SMA Negeri 4 C090
91 Ronny Wahyu XI-10 BAHASA SMA Negeri 4 C091
92 Sindy Astria XI-10 BAHASA SMA Negeri 4 C092
93 Tania Priskila XI-10 BAHASA SMA Negeri 4 C093
94 Tedi Setiawan XI-10 BAHASA SMA Negeri 4 C094
95 Triana Kartika XI-10 BAHASA SMA Negeri 4 C095
96 Vivi Meynawati XI-10 BAHASA SMA Negeri 4 C096
97 Wendi Anugroho XI-10 BAHASA SMA Negeri 4 C097
98 Yana Lestari XI-10 BAHASA SMA Negeri 4 C098
99 Yowanda Angga Reksa XI-10 BAHASA SMA Negeri 4 C099
100 Yudha XI-10 BAHASA SMA Negeri 4 C100
101 Zutha Isnaini XI-10 BAHASA SMA Negeri 4 C101
102 Agung Prasetyo XI-01 APK SMK Negeri 2 D102
103 Aldiansyah XI-01 APK SMK Negeri 2 D103
104 Aldi Hidayat XI-01 APK SMK Negeri 2 D104
106 Annisa Febriwati XI-01 APK SMK Negeri 2 D106 107 Ayu Novita Berliani XI-01 APK SMK Negeri 2 D107
108 Apridianto XI-01 APK SMK Negeri 2 D108
109 Doni Wardana Putra XI-01 APK SMK Negeri 2 D109 110 Eka Setya Fuji Rahayu XI-01 APK SMK Negeri 2 D110
111 Fajar Wanto XI-01 APK SMK Negeri 2 D111
112 Fardiah XI-01 APK SMK Negeri 2 D112
113 Halimatussa'diyah XI-01 APK SMK Negeri 2 D113
114 Ilmi Wahyuni XI-01 APK SMK Negeri 2 D114
115 Irfan Tegar Prakoso XI-01 APK SMK Negeri 2 D115
116 Laila Hasanah XI-01 APK SMK Negeri 2 D116
117 Jumia Marsita XI-01 APK SMK Negeri 2 D117
118 Muhammad Bahrudin XI-01 APK SMK Negeri 2 D118 119 Muhammad Abdi Yuandi XI-01 APK SMK Negeri 2 D119 120 Muhammad Reza Fahlepi XI-01 APK SMK Negeri 2 D120
121 Nilda XI-01 APK SMK Negeri 2 D121
122 Nor Aida XI-01 APK SMK Negeri 2 D122
123 Nurul Hidayah XI-01 APK SMK Negeri 2 D123
124 Pella Mahrita Dewi XI-01 APK SMK Negeri 2 D124
125 Pemarini XI-01 APK SMK Negeri 2 D125
126 Penti XI-01 APK SMK Negeri 2 D126
127 Resafonika XI-01 APK SMK Negeri 2 D127
128 Rizki Rahma Sari XI-01 APK SMK Negeri 2 D128
129 Siti Fatimah XI-01 APK SMK Negeri 2 D129
130 Sukma Tina Haryani XI-01 APK SMK Negeri 2 D130
131 Yana XI-01 APK SMK Negeri 2 D131
133 Yudi Erlangga XI-01 APK SMK Negeri 2 D133 134 Yuliani Ananda Putri XI-01 APK SMK Negeri 2 D134
TOTAL = 134 Students
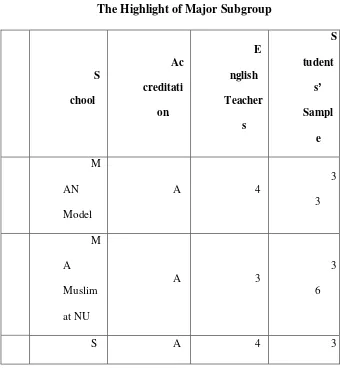
To more specific of the samples, the writer served the highlights of the fourth schools, available in the table 3.2. The writer also listed the teachers’ of the fourth schools data, available in the appendices section.
Table 3. 3
The Highlight of Major Subgroup
S
chool
Ac
creditati
on
E
nglish
Teacher
s
S
tudent
s’
Sampl
e
M
AN
Model
A 4
3
3
M
A
Muslim
at NU
A 3
3
6
MAN 4 2
S
MKN 2
B 6
3
3
TOTAL
1
7
1
34
D. Research Instrument
Sandra states that survey is spesifically thought as written questionnaire and it is clearly different with interview.11Hornby states that questionnaire is a written or printed list of questions to be answered by a number of people especially as part of a survey.12Interview is asking participants questions in one on one or small group setting.13In any other hand both survey and interview are different.
In this study, the writer used questionnaire only as the main instrument, because both questionnaire and interview was different as mention previously. Another reason that the writernot use an interview as additional of the instrument was mention by Wido. He stated that the interview differs from the ordinary questionnaire because of the personal presence of the interviewer while the respondents supply their answers. One of the disadvantages is that this one-to-one approach takes much longer than an ordinary questionnaire. Another disadvantages is that the personal presence of
11
Sandra Lee Mckey, 2008. Researching Second Language Classroom, Lawrence Erlbaum Associates, Inc., Publisher, p. 35
12Ibid,
A.S Hornby, Oxford Dictionaries: Advanced Learner’s...,p. 952. 13
the interviewer may reduce the respondents’ spontaneity. Anonymity is gone, and so
the willingness to be completly frank and honest might be reduced.14
In this study, the writer used likert scale as the kind of questionaire. A likert scale shows a set of statements of the topic and asking the respondent to chose whether they strongly agree, agree, are undecided, disagree, strongly disagree.15 A likert scale provides a range of responses to a given question or statement.16 Then, the writer also used Bahasa Indonesia in order to respondents more comfortable and get the point better of the questionnaire. Zoltan stated that, “questionnaire research makes the inherent assumption that the respondents can read and write well. It is therefore understandable that for respondents with literacy problems or with limited L2 proficiency.17
E. Endorsment of the Data 1. Try Out
The writer tried out the test instrument before it applied to the real sample in the research. The writer gave test of try out to second grade students at SMA- N.U Palangka Raya. To get the data of try out, the writer used some procedures as follows:
a. The writer made and prepare test of try out.
14
Wido H. Toendan, 2013. “Research Methods”, University of Palangka Raya, p.128 15
Donald Ary, et al., 2010. Introduction to Research in Education. Wadsworth: Wadsworth Cengange Learning, p. 209
16
Louis Cohen, et al., 2000.Reserch Methods in Education: Fifth Edition, London: Routledge Falmer. p. 253
17
b. The writer gave test of try out to the students c. The writer asked the students to do test of try out. d. The writer collected the student’s answer.
e. The writer calculated and gave score to the students’ answer.
f. The writer analyzed the obtain data to know the instruments validity, and instruments reliability.
2. Validity
Validity is the degree to which the evidence and theory support the interpretations of test scores entailed by proposed uses for tests.18Validity is defined as the extent to which scores on a test enable one to make meaningful and appropriate interpretations.19In questionnaire, to measure the validity is whether respondent who complete the questionnaire do so accurately, honestly and correctly and second whether those who fail to return their questionnaire would have given the same distribution of answer as did the returnes.20Face Validity is taken to ensure that the questionnaire is valid. Face validity refers to the extent to which examinees believe the instrument is
18
Donald Ary, et al., 2010. Introduction to Research in Education. Wadsworth: Wadsworth Cengange Learning, P. 225
19
Donald Ary, Lucy Cheser Jacobs, Chris Sorensen, and Asghar Razavieh, 2010. Introduction to Research 7in Education, Canada: Wadsworth, p.224.
20
measuring what it is supposed to measure.21 Doing pilot study was not only to know the students’ difficulties in answer the questionnaire, but also measured the construct validity of the questionnaire.
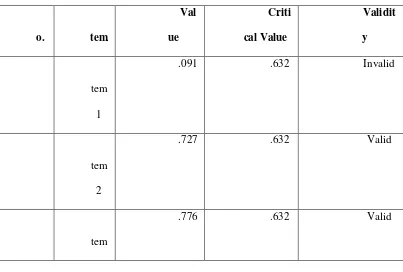
In this research the writer calculated the results of the pilot study using SPSS 20.0 Program. The total of the item was 10 items and respondents in totally there were 134 students. The. By comparing and analyzing between the pilot study results and the critical values of the Pearson Product Moment Correlation Coefficient as stated in Donald’ book the data were found as
follow:
Table 3. 4
The Validity of the Research Using SPSS 20.0 Program
o.
I
tem
Val
ue
Criti
cal Value
Validit
y
I
tem
1
.091 .632 Invalid
I
tem
2
.727 .632 Valid
I
tem
.776 .632 Valid
21
3
I
tem
4
.629 .632 Valid
I
tem
5
.791 .632 Valid
I
tem
6
.771 .632 Valid
I
tem
7
.725 .632 Valid
I
tem
8
.740 .632 Valid
I
tem
9
.106 .632 Invalid
0
I
tem
10
3. Reliability
Reliability is the degree of consistency with which it measure whatever it is measuring.22The reliability of a measuring instrument is the degree of consistency with which it measures whatever it is measuring. This quality is essential in any kinds of measurement.23
In order to assure the reliability of a survey, several measures can be used.24
a. First, the same survey can be given on two occasions to the same individuals. Then the researcher can check to see how consistently the respondents gave the same response to the same item.
b. The second way of assuring reliability is to have two forms of a survey and have individuals take both forms. The consistency of response on these two forms could again be checked.
c. The final way to achieve reliability is to check the internal consistency of responses in a survey. In this case, if a survey contains several items that ask similar questions but in different forms, then the researcher can check to see how consistently the respondents have answered these questions.
22
Donald Ery, et al., 2010.Introduction to Research in Education. Wadsworth: Wadsworth Cengange Learning, p. 236
23 Ibid,
Donal Ary, et al, Introduction to Research…, p.236 24
It was using SPSS 20.0program in finding the reliability. The degree of alpha’s cronbach alpha is higher than r table (0.632). The result of reliability above as follows:
Table 3. 5
Result of Reliable Using SPSS 20.0 Program Reliability Statistics
Cronbach's Alpha
Cronbach's Alpha Based
on Standardized
Items
N of Items
.779 .752 10
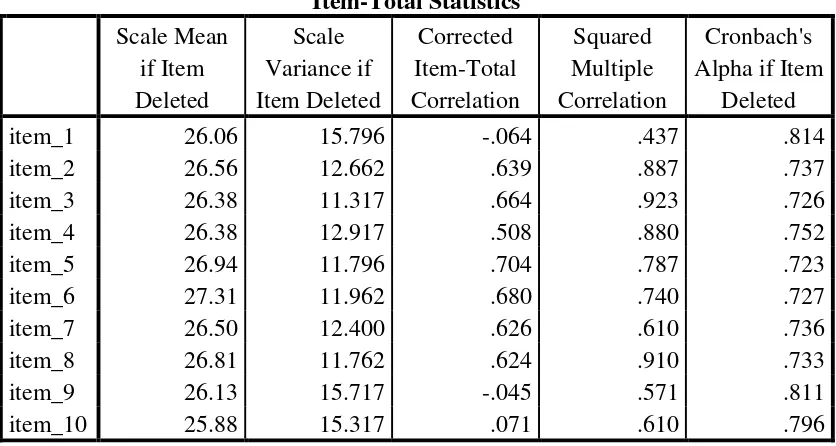
Table 3. 6
Items’ Total Statistic Using SPSS 20.0 Program
Item-Total Statistics Scale Mean
if Item Deleted
Scale Variance if Item Deleted
Corrected Item-Total Correlation
Squared Multiple Correlation
Cronbach's Alpha if Item
Deleted
item_1 26.06 15.796 -.064 .437 .814
item_2 26.56 12.662 .639 .887 .737
item_3 26.38 11.317 .664 .923 .726
item_4 26.38 12.917 .508 .880 .752
item_5 26.94 11.796 .704 .787 .723
item_6 27.31 11.962 .680 .740 .727
item_7 26.50 12.400 .626 .610 .736
item_8 26.81 11.762 .624 .910 .733
item_9 26.13 15.717 -.045 .571 .811
F. Data collection procedure
To collect the data needed, questionnaires with open-ended questions was given to the participants. Indonesian language was chosen to help the students understand the question better so they will not have a problem in answering the questions.
To collect the data, there were several steps should be done, they are as follows:
1. Preparing the questionnaire
2. Giving the questionnaire to the respondents. 3. Collecting the responses.
4. Calculating the result of responses.
5. Analyzing the data obtained using SPSS Version 20.
6. Concluding the students’ perceptions of English as a Medium of Instruction of Senior High Schools in Palangka Raya.
G. Data analysis
To analyze the data obtained from the field, several techniques were conducted of this research, namely data reduction and data displaying.
3. Data Reduction
There were three steps to analyze the data; they are item scores, the distribution of frequency, and then central tendency, calculating mean using formula, median, and modus, interpreting the data result and giving the conclusion.. To analyze the data (mean,median and modus/mode), below the steps applied:
a) Mean
∑X X = N
Where:
X = Mean value Σ = Sum of
X = raw score
N = Number of case. 25
b) Median
The median is defined as that point in a distribution of measure which 50 percent of the cases lay26. Example:
18 20 22 25 25 30
Median: any point from 22.5 to 24.5 fits definition of the median.
25 Ibid,
Donald Ary, et al, Introduction to Research…, p.109. 26
c) Modus / Mode
The mode is the value in a distribution that occurs most frequently27. Example:
14 16 16 17 18 19 19
Calculating the deviation score and standard deviation using the formula:
1) Deviation Score
𝑥= X −X
𝑥 = Deviation Score X = raw score X = Mean
2) Standard Deviation
𝑆2= 𝑥2𝑁−1
s = 𝑥2
𝑁−1
s = 𝑥 2−( 𝑋)2
𝑁
𝑁−1
Where : 𝑥2= sum of the squares of each score (i.e., each score is first squared, and then these squares are summed)
27
( 𝑋)2 = sum of the score squared (the scores are first summes, and then this total is squared)
N = Number of cases
4. Data Displaying
Coding categories is the first thing to do for the writer when decide compiling survey research.28 The writer adopted the Fukuda’s way to display her data results. The writer used questionnaire with the opened ended questions and likert type scale (strongly agree, agree, strongly disagree, disagree) as the instrument for collecting the data. In addition, the table also includes the percentage of respondents for each response and finally the mean for the question.
There were several possible alternatives to display the information is compiled in a table;
a) One is to simply report the frequency of each response. Hence, in the example of having students rank the importance of each skill, one could simply describe how many students ranked writing as one, and how many ranked listening as one, and so on.
b) A second alternative is to describe the results in percentages. If writers choose to describe the results in terms of frequency or percentages they could also display these results in a figure using a bar graph or pie
28