BAB IV
FINDINGS AND DISCUSSION
In this chapter presents the research finding and the discussions. It covers the data description, and the discussion.
A. Description of Data
In this section, it would be describe the results of the research on the students‟ perception of English as a medium of instruction in teaching English at Senior High Schools in Palangka Raya by using questionnaire as the main instrument for collecting the data.
1. The Description of the Data on Students’ Perception
The data presentation of the item score of the students‟ perception shown in the measurement of central tendency (mean, median, and mode), the measurement of deviation standard, the table of frequency distribution and the chart of frequency distribution. The total of the respondents were134 students and it consisted of 10 items of the questionnaire.
The first step, the writer tabulated the scores of 10 items of the questionnaire into the table for the calculation of mean, the table of calculation deviation score and find out the standard deviation, they were as follow:
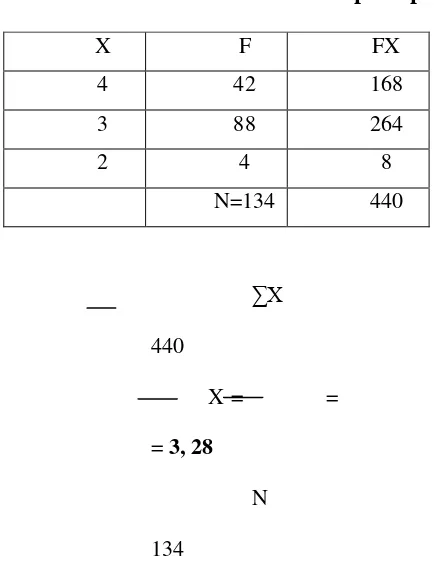
Table 4.1
Mean’s calculation of the students’ perception (item_1)
X F FX
4 42 168
3 88 264
2 4 8
N=134 440
∑X
440
X = =
= 3, 28
N
134
The Mean of Item 1 is 3, 28.
Next step is to tabulate the score into the table of calculation Deviation Score and Standard Deviation.
Table 4.2
X F FX X x2 Fx2
4 42 168 0,
72
0,
518
21,
756
3 88 264 -0,
28
0,
78
6, 864
2 4 8 -1,
28
1,
638
6, 552
N=
134
∑F
X=440
∑Fx2 =
35,172
Stdev = 𝑓𝑥 2 𝑁−1 =
35,172 134−1 =
35,172
133 = 0, 624= 0, 513
Table 4.3
Mean’s calculation of the students’ perception (item_2)
X F FX
4 30 120
3 80 240
2 22 44
1 1 1
N=134 405
∑X
405
X = =
= 3, 02
134
The Mean of Item 2 is 3, 02.
Next step is to tabulate the score into the table of calculation Deviation Score and Standard Deviation.
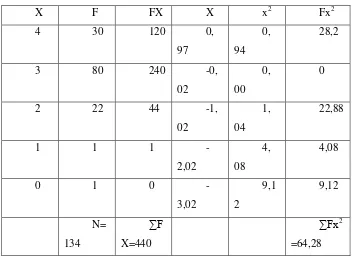
Table 4.4
The Calculation of Deviation Score and Standard Deviation (item_2)
X F FX X x2 Fx2
4 30 120 0,
97
0,
94
28,2
3 80 240 -0,
02
0,
00
0
2 22 44 -1,
02
1,
04
22,88
1 1 1
-2,02
4,
08
4,08
0 1 0
-3,02
9,1
2
9,12
N=
134
∑F
X=440
∑Fx2 =64,28
Stdev = 𝑓𝑥2 𝑁−1 =
64,28 134−1 =
64,28
133 = 0,48 = 0,69
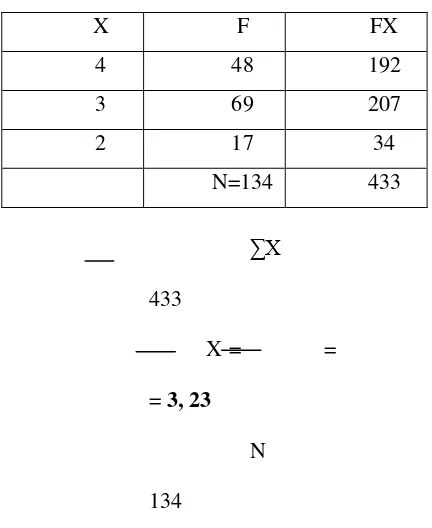
Mean’s calculation of the students’ perception (item_3)
X F FX
4 48 192
3 69 207
2 17 34
N=134 433
∑X
433
X = =
= 3, 23
N
134
The Mean of Item 3 is 3, 23.
Next step is to tabulate the score into the table of calculation Deviation Score and Standard Deviation.
Table 4.6
The Calculation of Deviation Score and Standard Deviation (item_3)
X F FX X x2 Fx2
4 48 192 0,
77
0,
59
28,32
3 69 207 -0,
23
0,
05
2 17 34 -1,
23
1,
52
25,67
N=
134
∑F
X=433
∑Fx2 =57,44
Stdev = 𝑓𝑥2 𝑁−1 =
57,44 134−1 =
57,44
133 = 0, 43= 0, 65
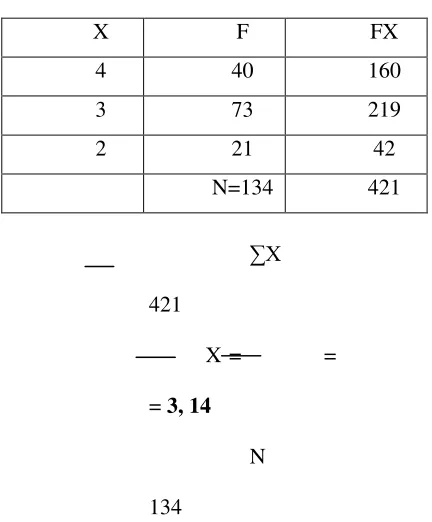
Table 4.7
Mean’s calculation of the students’ perception (item_4)
X F FX
4 40 160
3 73 219
2 21 42
N=134 421
∑X
421
X = =
= 3, 14
N
134
Next step is to tabulate the score into the table of calculation Deviation Score and Standard Deviation.
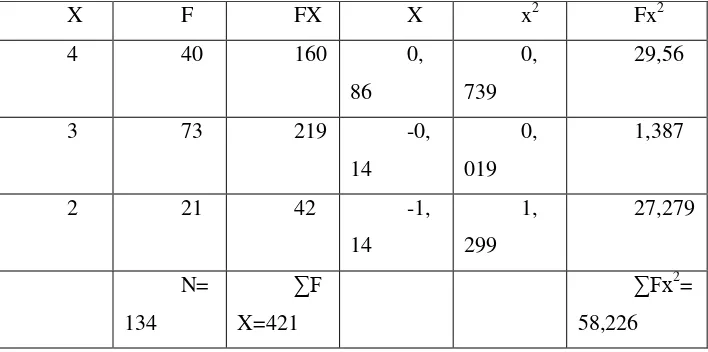
Table 4.8
The Calculation of Deviation Score and Standard Deviation (item_4)
X F FX X x2 Fx2
4 40 160 0,
86
0,
739
29,56
3 73 219 -0,
14
0,
019
1,387
2 21 42 -1,
14
1,
299
27,279
N=
134
∑F
X=421
∑Fx2 =
58,226
Stdev = 𝑓𝑥 2 𝑁−1 =
58,226 134−1 =
58,226
133 = 0, 437= 0, 66
Table 4.9
Mean’s calculation of the students’ perception (item_5)
X F FX
3 63 189
2 62 124
1 1 1
N=134 ∑X=3
46
∑X
346
X = =
= 2,58
N
134
The Mean of Item 5 is 2,58.
Next step is to tabulate the score into the table of calculation Deviation Score and Standard Deviation.
Table 4. 10
The Calculation of Deviation Score and Standard Deviation (item_5)
X F FX X x2 Fx2
4 8 32 1,4
2
2,0
1
16,08
3 63 189 0,4
2
0,1
7
10,71
0,58 3
1 1 1
-1,58
2,4
9
2,49
N=
134
∑F
X=346
∑Fx2 =49,74
Stdev = 𝑓𝑥2 𝑁−1 =
49,74 134−1 =
49,74
133 = 0, 373= 0, 61 Table 4. 11
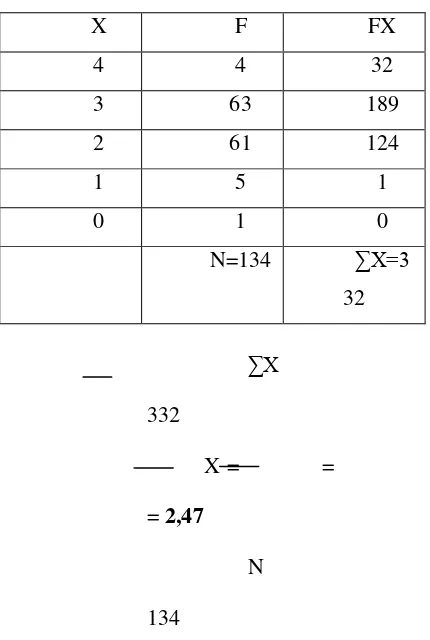
Mean’s calculation of the students’ perception (item_6)
X F FX
4 4 32
3 63 189
2 61 124
1 5 1
0 1 0
N=134 ∑X=3
32
∑X
332
X = =
= 2,47
N
134
Next step is to tabulate the score into the table of calculation Deviation Score and Standard Deviation.
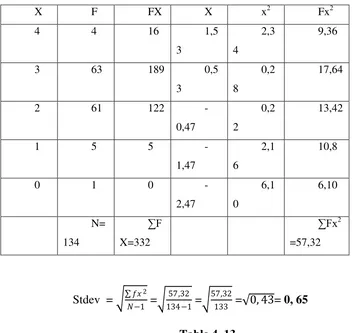
Table 4. 12
The Calculation of Deviation Score and Standard Deviation (item_6)
X F FX X x2 Fx2
4 4 16 1,5
3
2,3
4
9,36
3 63 189 0,5
3
0,2
8
17,64
2 61 122
-0,47
0,2
2
13,42
1 5 5
-1,47
2,1
6
10,8
0 1 0
-2,47
6,1
0
6,10
N=
134
∑F
X=332
∑Fx2 =57,32
Stdev = 𝑓𝑥2 𝑁−1 =
57,32 134−1 =
57,32
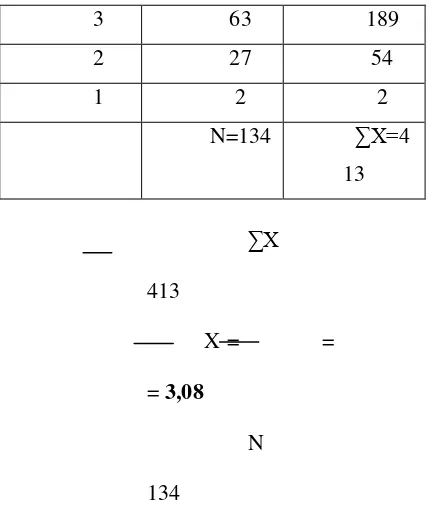
133 = 0, 43= 0, 65 Table 4. 13
Mean’s calculation of the students’ perception (item_7)
X F FX
3 63 189
2 27 54
1 2 2
N=134 ∑X=4
13
∑X
413
X = =
= 3,08
N
134
The Mean of Item 7 is 3,08.
Next step is to tabulate the score into the table of calculation Deviation Score and Standard Deviation.
Table 4. 14
The Calculation of Deviation Score and Standard Deviation (item_7)
X F FX X x2 Fx2
4 42 168 0,9
2
0,8
4
35,28
3 63 189
-0,08
0,0
06
0,378
1,08 6
1 2 2
-2,08
4,3
2
8,64
N=
134
∑F
X=346
∑Fx2 =
75,618
Stdev = 𝑓𝑥2 𝑁−1 =
75,618 134−1 =
75,618
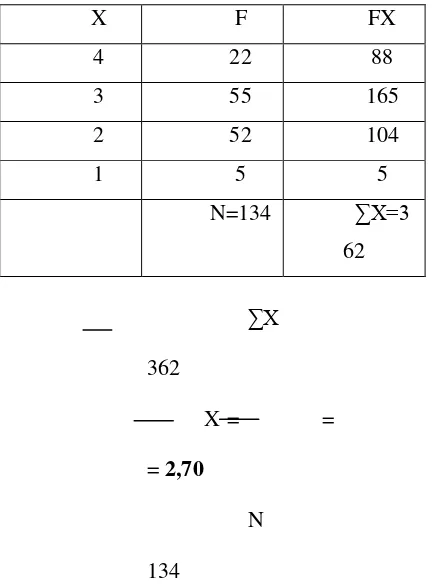
133 = 0, 568= 0, 75 Table 4. 15
Mean’s calculation of the students’ perception (item_8)
X F FX
4 22 88
3 55 165
2 52 104
1 5 5
N=134 ∑X=3
62
∑X
362
X = =
= 2,70
N
134
Next step is to tabulate the score into the table of calculation Deviation Score and Standard Deviation.
Table 4. 16
The Calculation of Deviation Score and Standard Deviation (item_8)
X F FX X x2 Fx2
4 22 88 1,3 1,6
9
37,18
3 55 165 0,3 0,0
9
4,95
2 52 104 -0,7 0,4
9
25,48
1 5 5 -1,7 2,8
9
14,45
N=
134
∑F
X=346
∑Fx2 =82,06
Stdev = 𝑓𝑥2 𝑁−1 =
82,06 134−1 =
82,06
133 = 0, 61= 0, 78 Table 4. 17
Mean’s calculation of the students’ perception (item_9)
X F FX
4 56 224
2 6 12
1 1 1
0 2 0
N=134 ∑X=4
44
∑X
444
X = =
= 3,31
N
134
The Mean of Item 9 is 3,31.
Next step is to tabulate the score into the table of calculation Deviation Score and Standard Deviation.
Table 4. 18
The Calculation of Deviation Score and Standard Deviation (item_9)
X F FX X x2 Fx2
4 56 224 0,6
9
0,4
76
26,656
3 69 207
-0,31
0,0
96
6,624
2 6 12
-1,31
1,7
16
10,296
2,31 36
0 2 0
-3,31
10,
956
21,912
N=
134
∑F
X=444
∑Fx2 =
70,804
Stdev = 𝑓𝑥2 𝑁−1 =
70,804 134−1 =
70,804
133 = 0, 532= 0, 73 Table 4. 19
Mean’s calculation of the students’ perception (item_10)
X F FX
4 88 352
3 41 123
2 5 10
N=134 ∑X=4
85
∑X
362
X = =
= 3,62
N
134
Next step is to tabulate the score into the table of calculation Deviation Score and Standard Deviation.
Table 4. 20
The Calculation of Deviation Score and Standard Deviation (item_10)
X F FX X x2 Fx2
4 88 352 0,3
8
0,1
4
12,32
3 41 123 0,6
2
0,3
8
15,58
2 5 10 1,6
2
2,6
2
13,1
N=
134
∑F
X=346
∑Fx2 =
41
Stdev = 𝑓𝑥 2 𝑁−1 =
41 134−1 =
41
133 = 0, 308= 0, 55
Then, the writer tabulated the score of 10 items of the questionnaire into the table for the calculation of mean, deviation score and standard deviationavailable in table 4.3.
2. The Result of Data Analyze
Palangka Raya by using questionnaire as the main instrument for collecting the data, the writer used the data displaying at first. The data displaying served in a table as follow:
Table 4. 21
Result of Questionnaire Score of Mean, Median, Modus, Standard Deviation and Percentage on the Students’ Perception
o / I t e m erc ent & Nu mb er Scale o t a l N D O D T . D E V A = 4 = 3 = 2 D = 1 S D um ber
2 8
% %
um
ber
0 0 2
3 4 , 0 2 , 6 9 erc ent 2 , 4 % 9 , 7 % 6 , 4 % , 7 % , 7 % 0 0 um ber
8 9 7
um
ber
0 3 1
3 4 , 1 4 , 6 6 erc ent 9 , 9 % 4 , 5 % 5 , 7 % 0 0 um ber
3 2
3 4 , 5 8 , 6 1 erc ent , 0 % 7 , 0 % 6 , 3 % , 7 % 0 0
ber 4 4 8 6 5 erc ent , 0 % 7 , 0 % 5 , 5 % , 7 % , 7 % 0 0 um ber
2 3 7
3 4 , 0 8 , 7 5 erc ent 1 , 3 % 7 % 0 , 1 % , 5 % 0 0 um ber
2 5 2
erc ent 6 , 4 % 1 , 0 % 8 , 8 % , 7 % 0 0 um ber
6 9
3 4 , 3 1 , 7 3 erc ent 1 , 8 % 1 , 5 % , 5 % , 7 % , 5 % 0 0 0 um ber
8 1
3
4 ,
7
%
6
%
%
It was apparent from the table above that the students‟ perception of English as a medium of instruction in teaching English at senior high schools in Palangka Raya as follow:
Item 1, English as a Medium of Instruction increase my standard of English and motivate me to learn English. There are 42 students (31,3%) state strongly agree, 88 students (65, 7%) agree, and 4 student (3,0%) disagree.
The writer also calculated the data frequency, percentage, valid and cumulative percentage of the item using SPSS version 20.0 Program. The result statistic table as follows;
item_1
Frequency Percent
Valid Percent
Cumulative Percent
Valid 2 4 3.0 3.0 3.0
3 88 65.7 65.7 68.7
4 42 31.3 31.3 100.0
Item 2, English as a Medium of Instruction helps me more c pable to speaks English. There are 30 students (22,4%) state strongly agree, 80 students (59, 7%) agree, 22 students (16,4%) disagree and 1 student (0,7 %) state strongly disagree.
The writer also calculated the data frequency, percentage, valid and cumulative percentage of the item using SPSS version 20.0 Program. The result statistic table as follows;
item_2
Frequency Percent
Valid Percent
Cumulative Percent
Valid 0 1 .7 .7 .7
1 1 .7 .7 1.5
2 22 16.4 16.4 17.9
3 80 59.7 59.7 77.6
4 30 22.4 22.4 100.0
Total 134 100.0 100.0
The writer also calculated the data frequency, percentage, valid and cumulative percentage of the item using SPSS version 20.0 Program. The result statistic table as follows;
item_3
Frequency Percent
Valid Percent
Cumulative Percent
Valid 2 17 12.7 12.7 12.7
3 69 51.5 51.5 64.2
4 48 35.8 35.8 100.0
Total 134 100.0 100.0
Item 4, English as a Medium of Instruction facilitates me to understand international cultures. There are 40 students (29, 9%) state strongly agree, 73 students (54, 5%) agree, and 21 students (15, 7%) disagree.
The writer also calculated the data frequency, percentage, valid and cumulative percentage of the item using SPSS version 20.0 Program. The result statistic table as follows;
item_4
Frequency Percent
Valid Percent
Cumulative Percent
Valid 2 21 15.7 15.7 15.7
3 73 54.5 54.5 70.1
4 40 29.9 29.9 100.0
Item 5, it is easy to understand a teacher of English subject. There are 8 students (6.0%) state strongly agree, 63 students (47, 0%) agree, 62 (46,3%) students state disagree and 1 student (0, 7%) state strongly disagree.
The writer also calculated the data frequency, percentage, valid and cumulative percentage of the item using SPSS version 20.0 Program. The result statistic table as follows;
item_5
Frequency Percent
Valid Percent
Cumulative Percent
Valid 1 1 .7 .7 .7
2 62 46.3 46.3 47.0
3 63 47.0 47.0 94.0
4 8 6.0 6.0 100.0
Item 6, I understand very well when the English teacher speaks English during the class is on going. There are 4 students (3, 0%) state strongly agree, 55 students (41, 0%) agree, 69 students (51, 5%) disagree, 5 students (3, 7%) state strongly disagree and 1 student (0, 7%) do not answer anything.
The writer also calculated the data frequency, percentage, valid and cumulative percentage of the item using SPSS version 20.0 Program. The result statistic table as follows;
item_6
Frequency Percent Valid Percent
Cumulative Percent
Valid 0 1 .7 .7 .7
1 5 3.7 3.7 4.5
2 61 45.5 45.5 50.0
3 63 47.0 47.0 97.0
4 4 3.0 3.0 100.0
Total 134 100.0 100.0
Item 7, English is applied as a Medium of Instruction in the English subject. There are 42 students (31, 3%) state strongly agree, 63 students (47, 0%) state agree, 27 students (20, 1%) state disagree, 2 students (1, 5%) state strongly disagree.
item_7
Frequency Percent
Valid Percent
Cumulative Percent
Valid 1 2 1.5 1.5 1.5
2 27 20.1 20.1 21.6
3 63 47.0 47.0 68.7
4 42 31.3 31.3 100.0
Total 134 100.0 100.0
Item 8, the English teachers must use English when teaching English subject. There are 22 students (16, 4%) state strongly agree, 55 students (41, 0%) agree, 52 students (38, 8%) disagree, and 5 students (3, 7%) strongly disagree.
The writer also calculated the data frequency, percentage, valid and cumulative percentage of the item using SPSS version 20.0 Program. The result statistic table as follows;
item_8
Frequency Percent
Valid Percent
Cumulative Percent
Valid 1 5 3.7 3.7 3.7
2 52 38.8 38.8 42.5
3 55 41.0 41.0 83.6
4 22 16.4 16.4 100.0
Total 134 100.0 100.0
strongly agree, 69 students (51, 5%) agree, and 6 students (4, 5%) disagree, 1 student (0, 7) strongly disagree and 2 students (1, 5%) do not answer anything. The writer also calculated the data frequency, percentage, valid and cumulative percentage of the item using SPSS version 20.0 Program. The result statistic table as follows;
item_9
Frequency Percent
Valid Percent
Cumulative Percent
Valid 0 2 1.5 1.5 1.5
1 1 .7 .7 2.2
2 6 4.5 4.5 6.7
3 69 51.5 51.5 58.2
4 56 41.8 41.8 100.0
Total 134 100.0 100.0
Item 10, the combination between English and Indonesian language in English subject is appropriate with the condition of students in each class even school. There are 88 students (65, 7%) state strongly agree, 41 students (30, 6%) agree, and 5 students (3, 7%) disagree.
The writer also calculated the data frequency, percentage, valid and cumulative percentage of the item using SPSS version 20.0 Program. The result statistic table as follows;
Frequency Percent
Valid Percent
Cumulative Percent
Valid 2 5 3.7 3.7 3.7
3 41 30.6 30.6 34.3
4 88 65.7 65.7 100.0
Total 134 100.0 100.0
B. Discussion
The research problem was “what is the students‟ perception of English as a Medium of Instruction in teaching Englishat Senior High Schools in Palangka Raya?” To answer the question above, the writer has done the study in this research.
The writer did the research on the problem of the study as stated previously. The data were found that English as a Medium of Instruction used by the English teachers in the classroom based on the students point of view. Hence, to uncover the students‟ perspective in it, the writer gave the questionnaire as the main instrument for measure the information. The questionnaire that the writer used was adopted by the Implementation of English as a Medium of Instruction in Indonesia University. Therefore, the questions in the questionnairefocused on the students‟ expectation, behavior, and attitude of the English as a Medium of Instruction in teaching English.
students‟ of English. The validity and reliabilities of the instrument in pilot study could describe those aspects.
The objective of the study in this research was to uncover the students‟ perception of English as a Medium of Instruction used by the English teachers in teaching Englishat Senior High Schools in Palangka Raya. Then, the data result of the students‟ perception describedby the writer based on the research type was descriptive quantitative research.
As the explanation above, it could be conclude that this research to uncover the “what” of students‟ perception of English as a medium of instruction used by the English teachers in teaching English, then the writer describing the data result of students‟ response of English as a Medium of instruction used by the English teachers in teaching English by descriptive research. The discussion of the results‟ of this study as follows:
English. There are 31,3% students state strongly agree, 65,7%students agree, and 3,0% students disagree.Item 2, English as a Medium of Instruction helps me more capable to speaks English. There are 22,4% students state strongly agree, 59, 7% students agree, 16,4%students disagree and 0,7 % students state strongly disagree.Item 3, English as a Medium of Instruction helps me to understand more easier about English textbook or article. There are 35,8% students state strongly agree, 51,5% agree, and 12, 7% disagree.Item 4, English as a Medium of Instruction facilitates me to understand international cultures. There are 29, 9% students state strongly agree, 54, 5% agree, and 15, 7% students disagree.
In the items 5 and 6 it shown that the students‟ ability and behavior of English as a medium of instruction. Item 5, it is easy to understand a teacher of English subject. There are 6.0% students state strongly agree, 47,0% students agree, 46,3% students state disagree and 0,7% students state strongly disagree.Item 6, I understand very well when the English teacher speaks English during the class is on going. There are 3,0% students state strongly agree, 41,0%studentsagree, 51,5% students disagree, 3,7% students state strongly disagree and 0, 7% student do not answer anything.
the teaching and learning of English. Item 7, English is applied as a Medium of Instruction in the English subject. There are 31,3% students state strongly agree, 47, 0% students state agree, 20,1 students state disagree, 1,5% students state strongly disagree.Item 8, the English teachers must use English when teaching English subject. There are 16,4% students state strongly agree, 41, 0% students agree, 38, 8% students disagree, 3,7% students strongly disagree.Item 9, Indonesian Language is applied as a Medium of Instruction in the teacher of English subject is needed. There are 41, 8% students state strongly agree, 51, 5% students agree, 4,5% disagree, and 0,7 studentsstrongly disagree and 1, 5% do not answer anything.Item 10, the combination between English and Indonesian language in English subject is appropriate with the condition of students in each class even school. There are 65,7% students state strongly agree, 30,6% students agree, and 3,7% students disagree.
The data above could be shown in the charts as follows:
Figure 4. 1
From the data describe and the discussion above, it can be answer the question in the problem of the study that what is the students‟ perception of English as a medium of instruction in teaching English at senior high schools in Palangka Raya? The result found that most students in this survey had positive response of English as a medium of instruction. It could be seen from from the percentage score of the data result that 50 % (67) students „agree‟ and 25 % (34) students „strongly agree‟. The data description previously that the score of Mode showed 3 frequently appeared or in the chart figure 4.1 was green, and also the median stated the same as mode, namely 3.
42
30 48
40
8 4
42
22 56
88 88
80
69 73
63 63 63
55 69
41
4 22
17 21
62 61
27 52
6 5
0 1 0 0 1
5
2 5 1 0
0 10 20 30 40 50 60 70 80 90 100
1 2 3 4 5 6 7 8 9 10
This survey also found that most students agree with all items that English as a Medium of Instruction increase my standard of English and motivate the students‟ to learn English, improve their confidence to speak up, helps them to understand more of English textbook or article and also international culture. These findings was in line with Sultan‟s theory state that the EMI students achieved a higher frequency of English language use both at home and at school, a more positive attitude toward English and higher motivation to learn English. Sahika Tarhan‟s theory state that a positive correlation was found between perceptions of English and perceptions of English-medium instruction for each group. Dornyei‟s theory state that evidence that EMI students more proactively seek opportunities to learn English, even though their motivation is more instrumental than integrative.