28
CHAPTER III
RESEARCH METHOD
A. RESEARCH DESIGN
The researcher uses Pre-Experimental design. The design of this study
is experimental design because the researcher wants to measure the effect of
comics media in the teaching story telling process. According to Arikunto,
Experimental study is a study which aimed to know there is or not the effect
of the variable studied.11 In line with this Ary says that experimental design refers to the conceptual framework within which the experiment is conducted.
The most important criteria that is the design be appropriate for testing the
particular hypothesis of the study.12
This research study uses quantitative approach. A quantitative
approach is one in which the investigatory primarily uses postpositive claim
for developing knowledge (i.e., cause and effect thinking, reduction to
specific variables and hypotheses and question, use of measurement and
observation, and the test of theories) employs strategies of inquiry such as
experiment and survey and collect data on predetermined instrument that
yield statistics data.13
According to Ary, “quantitative research is inquiry employing
operational definitions to generate numeric data to answer predetermined
11
Suharsimi Arikanto, Manajemen Penelitian, p.272 12
Donald Ary,dkk, Introduction to Research in Education Third Edition, New York : 1985, p.260
13
hypotheses or questions”.14
It is using quantitative approach because
quantitative is the data that of all number using statistic data.
The researcher uses the one-group pretest-posttest design usually
involves three steps : (1) administering a pretest measuring the dependent
variable; (2) applying the experimental treatment X to the subjects; (3)
administering a posttest, again measuring the dependent variable. Differences
attributed to aplication of the experimental treatment are then evaluated by
comparing the pretest and posttest score.15 Table 3.1
A population is all the organisms that both belong to the same group
or species and live in the same geographical area. In ecology the population
14
Donald Ary,Introduction to Research in Education Eight, United State : Wadsworth (Engange Learning, 2010) p.648.
15Ibid, p. 303
Pre-test Treatment Post-test
of a certain species in a certain area is estimated using the Lincoln Index. The
area that is used to define a sexual population is such that inter-breeding is
possible between any pair within the area and more probable than
cross-breeding with individuals from other areas. Normally cross-breeding is
substantially more common within the area than across the border.
According to Arikunto, population is the whole of research subject, if
someone wants to research all of the elements in research area his research is
called population research on census study. 16
In this research, population is eleventh-year students of SMAN 1
Sampit. The Population of the research is language class grade eleventh
students of SMAN 1 Sampit. Since there isonly one group of language class
of eleventh grade, so obiviously it will be taken as the population research.
2. Sample
Sample is a part of population. According to Ary, “ Sample is a group
selected from population for observation in a study.17 For the sample, the researcher takes a class to be the sample. The researcher used purposive
sampling for it. In this research, become sample are all the Students of
language class grade eleven.
16
Suharsimi Arikunto,procedure penelitian: suatu pendekatan praktek. Jakarta: PT.Rineka Cipta,2000, P. 108
17
The researcher chooses this class as the object of his research because
the duration of English Learning in this class is longer than others class. The
researcher hope this research is going to be finished earlier.
C. SETTING OF THE STUDY
This study will be taken from the eleventh grade of the students at
SMAN 1 Sampit which is located on Jalan A.Yani.
The researcher chooses this school as the object of his research for
some reasons. First, this school has become a favorite school of other senior
high schools in East Kotawaringin regency. The favorite school means that
the school becomes an example to be followed by other Senior High Schools
at the same level in the aspects of teaching and learning process, teachers’
profile, teaching facilities, school’s achievements and school management
and administration as well as its quality. Second, this school is located near
the highway so it easy to reach. Third, considering that the English teacher of
this school had implemented the group work before. So, it makes the
researcher easy to conduct his classroom observation. Fourth, this school has
D. RESEARCH INSTRUMENT
The data needed for this study will be gathered by test and research
instrument try out.
1. Test
There are some meaning of Test:
a. A procedure for critical evaluation; a means of determining the
presence, quality, or truth of something; a trial: a test of one's
eyesight; subjecting a hypothesis to a test; a test of an athlete's
endurance.
b.
A series of questions, problems, or physical responses designed todetermine knowledge, intelligence, or ability.
The researcher use the achivement test. Achivement test are widely
use in educational research, as well as in school system. It used to measure
what individual have learned. Achievement test measure mastery and
proficiency in different area of knowledge.18 The researcher construct the question by itself. The advantage of a researcher-made test is that it can be
tailored to be content specific.
2. Scoring Method
In assessment methods, researchers used inter-rater. researchers as
rater 1 and rater 2 as a teacher. For the assessment of student test results,
18
researchers used a scoring rubric that has been predetermined. The following
is the scoring rubric:
No Criteria Score
1 Content:
The content is relevant to the topic and easy to understand.
The content is almost complete, relevant to the topic.
The content is relevant to the topic but is not quite to understand.
3
2
1
2 Organization:
Ideas clearly stated, well organized.
Ideas clearly stated, but it is not quite well organized
Ideas are almost clearly stated, no logical sequencing
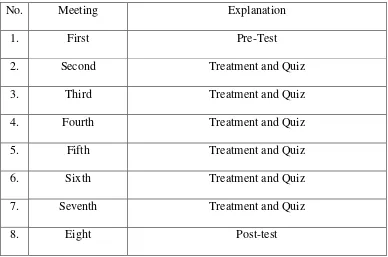
E. TIME
The research will conduct in two months. The experiment will do to
the sample in eight times of meeting, two meetings for the pre-test and
post-test. There are six meetings for the treatment and quiz. The reseacher takes
six meetings in order to take the data briefly. In addition, the school has their
own system in learning as implement in curriculum or syllabus. The reseacher
avoid the miscommunication between researcher and it institution. Next,
many experts recommend for treatment in experimental research at leats done
on six meetings.
Table 3.2 Research Schedule
No. Meeting Explanation
1. First Pre-Test
2. Second Treatment and Quiz
3. Third Treatment and Quiz
4. Fourth Treatment and Quiz
5. Fifth Treatment and Quiz
6. Sixth Treatment and Quiz
7. Seventh Treatment and Quiz
F. DATA COLLECTION PROCEDURES
To get the data that is need in the research, there are few of ways to do
it, they are :
1. Preparation
a) The researcher chooses the place of the study.
b) The researcher gives information for the instance that related to
show this study.
c) The researcher makes instrument try out.
d) The researcher shows the try out the class that has been
determine.
e) The researcher analyses try out
2. Implementation
a) The researcher give the treatment and quiz about comics until
six meeting.
3. Conclusion
a) The researcher gives the test to the students.
b) The researcher calculates the result of test.
G. DATA ANALYSIS PROCEDURE
The researcher analysis the data with a few of way, they are :
1. The researcher collects the result of test.
2. The researcher gives score for the students that suitable with the
criteria.
3. The researcher arranges into the table.19
4. The researcher determines the mean score with the formula:
Where :
Mx = Mean value
N = Number of case 20
5. The writer calculated the deviation score and standard deviation using
the formula:
a. Deviation Score
19 Suniati, Teaching Vocabulary trough total physical Respond (TPR) Method to the first Grade of MtsN-1 Model Palangka Raya Academic year 2005/2006, Thesis, palangka Raya: UNPAR,2006. p.31.
20
Anas Sudijono, Pengantar Statistik Pendidikan, Jakarta: PT. Raja Grafindo Persada, 2008, P. 85.
∑X
Mx =
N
b. Standard Deviation
6. The writer calculated the variance homogeneity21:
F =
7. The writer calculated the data by using t-test to test the hypothesis of
the study.
8. The writer used the level of significance at 5%. If the result of test is
higher than t table, it means Ha is accepted but if the result of test is
lower than t table, it means Ho is accepted.
9. The writer used t test to conclude the answer of the problem of the
study.
a. If the tobserved is equal or higher than t value in the table ( with t
table sign), so the null hypothesis stating that there is no Mean
21
difference from the both sample is rejected. It means the
difference is significant.
b. If the tobserved is lower than ttable, it means the null hypothesis
stating that there is no Mean difference from the both sample is
accepted22. It means the difference is not significant. 10. The writer calculated the degree of freedom with the formula23:
Df= ( N1 + N2- 2)
Where :
Df = degree of freedom
N = Number of cases
11. The writer determined the significant level of t observed by comparing
the tobserved with the ttable.
12. The writer interpreted the analysis result.
13. The writer gave conclusion.
22
Anas Sudijono, Pengantar Statistik Pendidikan , p. 284-285. 23