Intelligent Systems Reference Library 144
Boris Kovalerchuk
Visual Knowledge
Discovery and
Intelligent Systems Reference Library
Volume 144
Series editors
Janusz Kacprzyk, Polish Academy of Sciences, Warsaw, Poland e-mail: [email protected]
Lakhmi C. Jain, University of Canberra, Canberra, Australia; Bournemouth University, UK;
KES International, UK
The aim of this series is to publish a Reference Library, including novel advances and developments in all aspects of Intelligent Systems in an easily accessible and well structured form. The series includes reference works, handbooks, compendia, textbooks, well-structured monographs, dictionaries, and encyclopedias. It contains well integrated knowledge and current information in the field of Intelligent Systems. The series covers the theory, applications, and design methods of Intelligent Systems. Virtually all disciplines such as engineering, computer science, avionics, business, e-commerce, environment, healthcare, physics and life science are included. The list of topics spans all the areas of modern intelligent systems such as: Ambient intelligence, Computational intelligence, Social intelligence, Computational neuroscience, Artificial life, Virtual society, Cognitive systems, DNA and immunity-based systems, e-Learning and teaching, Human-centred computing and Machine ethics, Intelligent control, Intelligent data analysis, Knowledge-based paradigms, Knowledge management, Intelligent agents, Intelligent decision making, Intelligent network security, Interactive entertainment, Learning paradigms, Recommender systems, Robotics and Mechatronics including human-machine teaming, Self-organizing and adaptive systems, Soft computing including Neural systems, Fuzzy systems, Evolutionary computing and the Fusion of these paradigms, Perception and Vision, Web intelligence and Multimedia.
Boris Kovalerchuk
Visual Knowledge Discovery
and Machine Learning
Central Washington University Ellensburg, WA
USA
ISSN 1868-4394 ISSN 1868-4408 (electronic) Intelligent Systems Reference Library
ISBN 978-3-319-73039-4 ISBN 978-3-319-73040-0 (eBook) https://doi.org/10.1007/978-3-319-73040-0
Library of Congress Control Number: 2017962977 ©Springer International Publishing AG 2018
This work is subject to copyright. All rights are reserved by the Publisher, whether the whole or part of the material is concerned, specifically the rights of translation, reprinting, reuse of illustrations, recitation, broadcasting, reproduction on microfilms or in any other physical way, and transmission or information storage and retrieval, electronic adaptation, computer software, or by similar or dissimilar methodology now known or hereafter developed.
The use of general descriptive names, registered names, trademarks, service marks, etc. in this publication does not imply, even in the absence of a specific statement, that such names are exempt from the relevant protective laws and regulations and therefore free for general use.
The publisher, the authors and the editors are safe to assume that the advice and information in this book are believed to be true and accurate at the date of publication. Neither the publisher nor the authors or the editors give a warranty, express or implied, with respect to the material contained herein or for any errors or omissions that may have been made. The publisher remains neutral with regard to jurisdictional claims in published maps and institutional affiliations.
Printed on acid-free paper
This Springer imprint is published by Springer Nature The registered company is Springer International Publishing AG
Preface
Emergence of Data Science placed knowledge discovery, machine learning, and data mining in multidimensional data, into the forefront of a wide range of current research, and application activities in computer science, and many domains far beyond it.
Discovering patterns, in multidimensional data, using a combination of visual and analytical machine learning means are an attractive visual analytics opportu-nity. It allows the injection of the unique human perceptual and cognitive abilities, directly into the process of discovering multidimensional patterns. While this opportunity exists, the long-standing problem is that we cannot see the n-D data with a naked eye. Our cognitive and perceptual abilities are perfected only in the 3-D physical world. We need enhanced visualization tools (“n-D glasses”) to represent the n-D data in 2-D completely, without loss of information, which is important for knowledge discovery. While multiple visualization methods for the n-D data have been developed and successfully used for many tasks, many of them are non-reversible and lossy. Such methodsdo not represent the n-D data fullyand do not allow the restoration of the n-D data completely from their 2-D represen-tation. Respectively, our abilities to discover the n-D data patterns, from such incomplete 2-D representations, are limited and potentially erroneous. The number of available approaches, to overcome these limitations, is quite limited itself. The Parallel Coordinates and the Radial/Star Coordinates, today, are the most powerful reversible and lossless n-D data visualization methods, while suffer from occlusion. There is a need to extend the class of reversible and lossless n-D data visual representations, for the knowledge discovery in the n-D data. A new class of such representations, called the General Line Coordinate (GLC) and several of their specifications, are the focus of this book. This book describes the GLCs, and their advantages, which include analyzing the data of the Challenger disaster, World hunger, semantic shift in humorous texts, image processing, medical computer-aided diag-nostics, stock market, and the currency exchange rate predictions. Reversible methods for visualizing the n-D data have the advantages ascognitive enhancers,of the human cognitive abilities, to discover the n-D data patterns. This book reviews the state of the
art in this area, outlines the challenges, and describes the solutions in the framework of the General Line Coordinates.
This book expands the methods of the visual analytics for the knowledge dis-covery, by presenting thevisual and hybrid methods, which combine the analytical machine learning and the visual means. New approaches are explored, from both the theoretical and the experimental viewpoints, using the modeled and real data. The inspiration, for a new large class of coordinates, is twofold. Thefirst one is the marvelous success of the Parallel Coordinates, pioneered by Alfred Inselberg. The second inspiration is the absence of a“silver bullet”visualization, which is perfect for the pattern discovery, in the all possible n-D datasets. Multiple GLCs can serve as a collective“silver bullet.”This multiplicity of GLCs increases the chances that the humans will reveal the hidden n-D patterns in these visualizations.
The topic of this book is related to the prospects of both thesuper-intelligent
machines and the super-intelligent humans, which can far surpass the current
human intelligence, significantly lifting the human cognitive limitations. This book is about a technical way for reaching some of the aspects of super-intelligence, which are beyond the current human cognitive abilities. It is to overcome the inabilities to analyze a large amount of abstract, numeric, and high-dimensional data; and tofind the complexpatterns, in these data, with anaked eye, supported by the analytical means of machine learning. The new algorithms are presented for the reversible GLC visual representations of high-dimensional data and knowledge discovery. The advantages of GLCs are shown, both mathematically and using the different datasets. These advantages form a basis, for the future studies, in this super-intelligence area.
This book is organized as follows. Chapter1presents the goal, motivation, and the approach. Chapter 2 introduces the concept of the General Line Coordinates, which is illustrated with multiple examples. Chapter 3 provides the rigorous mathematical definitions of the GLC concepts along with the mathematical state-ments of their properties. A reader, interested only in the applied aspects of GLC, can skip this chapter. A reader, interested in implementing GLC algorithms, may find Chap.3useful for this. Chapter4describes the methods of the simplification of visual patterns in GLCs for the better human perception.
Chapter5presents several GLC case studies, on the real data, which show the GLC capabilities. Chapter6presents the results of the experiments on discovering the visual features in the GLCs by multiple participants, with the analysis of the human shape perception capabilities with over hundred dimensions, in these experiments. Chapter7presents the linear GLCs combined with machine learning, including hybrid, automatic, interactive, and collaborative versions of linear GLC, with the data classification applications from medicine to finance and image pro-cessing. Chapter8 demonstrates the hybrid, visual, and analytical knowledge dis-covery and the machine learning approach for the investment strategy with GLCs. Chapter9 presents a hybrid, visual, and analytical machine learning approach in text mining, for discovering the incongruity in humor modeling. Chapter 10 describes the capabilities of the GLC visual means to enhance evaluation of accuracy and errors of machine learning algorithms. Chapter11shows an approach,
to how the GLC visualization benefits the exploration of the multidimensional Pareto front, in multi-objective optimization tasks. Chapter12outlines the vision of a virtual data scientist and the super-intelligence with visual means. Chapter 13 concludes this book with a comparison and the fusion of methods and the dis-cussion of the future research. Thefinal note is on the topics, which are outside of this book. These topics are “goal-free” visualizations that are not related to the specific knowledge discovery tasks of supervised and unsupervised learning, and the Pareto optimization in the n-D data. The author’s Web site of this book is located at http://www.cwu.edu/*borisk/visualKD, where additional information and updates can be found.
Acknowledgements
First of all thanks to my family for supporting this endeavor for years. My great appreciation goes to my collaborators: Vladimir Grishin, Antoni Wilinski, Michael Kovalerchuk, Dmytro Dovhalets, Andrew Smigaj, and Evgenii Vityaev. This book is based on a series of conference and journal papers, written jointly with them. These papers are listed in the reference section in Chap.1under respective names. This book would not be possible without their effort; and the effort by the graduate and undergraduate students: James Smigaj, Abdul Anwar, Jacob Brown, Sadiya Syeda, Abdulrahman Gharawi, Mitchell Hanson, Matthew Stalder, Frank Senseney, Keyla Cerna, Julian Ramirez, Kyle Discher, Chris Cottle, Antonio Castaneda, Scott Thomas, and Tommy Mathan, who have been involved in writing the code and the computational explorations. Over 70 Computer Science students from the Central Washington University (CWU) in the USA and the West Pomeranian Technical University (WPTU) in Poland participated in visual pattern discovery and experi-ments described in Chap.6. The visual pattern discovery demonstrated its universal nature, when students at CWU in the USA, WPTU in Poland, and Nanjing University of Aeronautics and Astronautics in China were able to discover the visual pattern in the n-D data GLC visualizations during my lectures and challenged me with interesting questions. Discussion of the work of students involved in GLC development with the colleagues: Razvan Andonie, Szilard Vajda, and Donald Davendra helped, in writing this book, too.
I would like to thank Andrzej Piegat and the anonymous reviewers of our journal and conference papers, for their critical readings of those papers. I owe much to William Sumner and Dale Comstock for the critical readings of multiple parts of the manuscript. The remaining errors are mine, of course.
My special appreciation is to Alfred Inselberg, for his role in developing the Parallel Coordinates and the personal kindness in our communications, which inspired me to work on this topic and book. The importance of his work is in developing the Parallel Coordinates as a powerful tool for the reversible n-D data visualization and establishing their mathematical properties. It is a real marvel in its
Contents
1 Motivation, Problems and Approach . . . 1
1.1 Motivation . . . 1
1.2 Visualization: From n-D Points to 2-D Points. . . 2
1.3 Visualization: From n-D Points to 2-D Structures. . . 4
1.4 Analysis of Alternatives . . . 7
1.5 Approach. . . 10
References . . . 12
2 General Line Coordinates (GLC) . . . 15
2.1 Reversible General Line Coordinates . . . 15
2.1.1 Generalization of Parallel and Radial Coordinates . . . . 15
2.1.2 n-Gon and Circular Coordinates . . . 18
2.1.3 Types of GLC in 2-D and 3-D . . . 21
2.1.4 In-Line Coordinates . . . 23
2.1.5 Dynamic Coordinates. . . 26
2.1.6 Bush and Parallel Coordinates with Shifts . . . 28
2.2 Reversible Paired Coordinates. . . 29
2.2.1 Paired Orthogonal Coordinates . . . 29
2.2.2 Paired Coordinates with Non-linear Scaling. . . 33
2.2.3 Partially Collocated and Non-orthogonal Collocated Coordinates . . . 34
2.2.4 Paired Radial (Star) Coordinates . . . 35
2.2.5 Paired Elliptical Coordinates. . . 38
2.2.6 Open and Closed Paired Crown Coordinates . . . 40
2.2.7 Clutter Suppressing in Paired Coordinates . . . 44
2.3 Discussion on Reversible and Non-reversible Visualization Methods. . . 45
References . . . 47
3 Theoretical and Mathematical Basis of GLC . . . 49
3.1 Graphs in General Line Coordinates . . . 49
3.2 Steps and Properties of Graph Construction Algorithms . . . 55
3.3 Fixed Single Point Approach. . . 58
3.3.1 Single Point Algorithm. . . 58
3.3.2 Statements Based on Single Point Algorithm. . . 59
3.3.3 Generalization of a Fixed Point to GLC. . . 62
3.4 Theoretical Limits to Preserve n-D Distances in 2-D: Johnson-Lindenstrauss Lemma. . . 64
3.5 Visual Representation of n-D Relations in GLC . . . 65
3.5.1 Hyper-cubes and Clustering in CPC . . . 67
3.5.2 Comparison of Linear Dependencies in PC, CPC and SPC . . . 68
3.5.3 Visualization of n-D Linear Functions and Operators in CPC, SPC and PC . . . 71
References . . . 75
4 Adjustable GLCs for Decreasing Occlusion and Pattern Simplification . . . 77
4.1 Decreasing Occlusion by Shifting and Disconnecting Radial Coordinates . . . 77
4.2 Simplifying Patterns by Relocating and Scaling Parallel Coordinates . . . 78
4.2.1 Shifting and Tilting Parallel Coordinates . . . 78
4.2.2 Shifting and Reordering of Parallel Coordinates . . . 80
4.3 Simplifying Patterns and Decreasing Occlusion by Relocating, Reordering, and Negating Shifted Paired Coordinates . . . 82
4.4 Simplifying Patterns by Relocating and Scaling Circular and n-Gon Coordinates. . . 86
4.5 Decreasing Occlusion with the Expanding and Shrinking Datasets . . . 90
4.5.1 Expansion Alternatives. . . 90
4.6 Case Studies for the Expansion E1 . . . 92
4.7 Discussion . . . 99
References . . . 99
5 GLC Case Studies. . . 101
5.1 Case Study 1: Glass Processing with CPC, APC and SPC. . . 101
5.2 Case Study 2: Simulated Data with PC and CPC . . . 103
5.3 Case Study 3: World Hunger Data. . . 105
5.4 Case Study 4: Challenger USA Space Shuttle Disaster with PC and CPC. . . 107
5.5 Case Study 5: Visual n-D Feature Extraction from Blood Transfusion Data with PSPC. . . 109
5.6 Case Study 6: Health Monitoring with PC and CPC. . . 111
5.7 Case Study 7: Iris Data Classification in Two-Layer Visual Representation . . . 114
5.7.1 Extended Convex Hulls for Iris Data in CPC. . . 115
5.7.2 First Layer Representation . . . 116
5.7.3 Second Layer Representation for Classes 2 and 3. . . 118
5.7.4 Comparison with Parallel Coordinates, Radvis and SVM. . . 119
5.8 Case Study 8: Iris Data with PWC. . . 122
5.9 Case Study 9: Car Evaluation Data with PWC . . . 127
5.10 Case Study 10: Car Data with CPC, APC, SPC, and PC. . . 130
5.11 Case Study 11: Glass Identification Data with Bush Coordinates and Parallel Coordinates. . . 133
5.12 Case Study 12: Seeds Dataset with In-Line Coordinates and Shifted Parallel Coordinates . . . 135
5.13 Case Study 13: Letter Recognition Dataset with SPC . . . 137
5.14 Conclusion. . . 140
References . . . 140
6 Discovering Visual Features and Shape Perception Capabilities in GLC . . . 141
6.1 Discovering Visual Features for Prediction. . . 141
6.2 Experiment 1: CPC Stars Versus Traditional Stars for 192-D Data. . . 145
6.3 Experiment 2: Stars Versus PC for 48-D, 72-D and 96-D Data . . . 147
6.3.1 Hyper-Tubes Recognition. . . 147
6.3.2 Feature Selection . . . 149
6.3.3 Unsupervised Learning Features for Classification . . . . 151
6.3.4 Collaborative N-D Visualization and Feature Selection in Data Exploration . . . 152
6.4 Experiment 3: Stars and CPC Stars Versus PC
for 160-D Data. . . 153
6.4.1 Experiment Goal and Setting . . . 153
6.4.2 Task and Solving Hints . . . 155
6.4.3 Results . . . 156
6.5 Experiment 4: CPC Stars, Stars and PC for Feature Extraction on Real Data in 14-D and 170-D. . . 158
6.5.1 Closed Contour Lossless Visual Representation . . . 158
6.5.2 Feature Extraction Algorithm . . . 161
7 Interactive Visual Classification, Clustering and Dimension Reduction with GLC-L. . . 173
7.1 Introduction . . . 173
7.2 Methods: Linear Dependencies for Classification with Visual Interactive Means . . . 174
7.2.1 Base GLC-L Algorithm . . . 174
7.2.2 Interactive GLC-L Algorithm . . . 177
7.2.3 Algorithm GLC-AL for Automatic Discovery of Relation Combined with Interactions. . . 179
7.2.4 Visual Structure Analysis of Classes . . . 181
7.2.5 Algorithm GLC-DRL for Dimension Reduction. . . 181
7.2.6 Generalization of the Algorithms for Discovering Non-linear Functions and Multiple Classes . . . 182
7.4.1 Software Implementation, Time and Accuracy . . . 203
7.4.2 Comparison with Other Studies. . . 206
7.5 Conclusion. . . 212
8 Knowledge Discovery and Machine Learning for Investment
8.3 Visual Method for Building Investment Strategy in 2D Space . . . 228
9 Visual Text Mining: Discovery of Incongruity in Humor Modeling. . . 249
9.1 Introduction . . . 249
9.2 Incongruity Resolution Theory of Humor and Garden Path Jokes . . . 250
9.3 Establishing Meanings and Meaning Correlations. . . 252
9.3.1 Vectors of Word Association Frequencies Using Web Mining. . . 252
9.3.2 Correlation Coefficients and Differences. . . 253
9.4 Dataset Used in Visualizations. . . 255
9.5 Visualization 1: Collocated Paired Coordinates. . . 255
9.6 Visualization 2: Heat Maps . . . 258
9.7 Visualization 3: Model Space Using Monotone Boolean Chains . . . 259
9.8 Conclusion. . . 262
References . . . 263
10.3.1 Case Study 1: Linear SVM and LDA in 2-D
on Modeled Data. . . 270
10.3.2 Case Study 2: GLC-AL and LDA on 9-D on Wisconsin Breast Cancer Data . . . 271
10.4 Discussion and Conclusion . . . 274
References . . . 276
11 Pareto Front and General Line Coordinates. . . 277
11.1 Introduction . . . 277
11.2 Pareto Front with GLC-L . . . 279
11.3 Pareto Front and Its Approximations with CPC . . . 282
References . . . 286
12 Toward Virtual Data Scientist and Super-Intelligence with Visual Means . . . 289
12.1 Introduction . . . 289
12.2 Deficiencies . . . 290
12.3 Visual n-D ML Models: Inspiration from Success in 2-D . . . 292
12.4 Visual n-D ML Models at Different Generalization Levels . . . . 294
12.5 Visual Defining and Curating ML Models . . . 298
12.6 Summary on the Virtual Data Scientist from the Visual Perspective. . . 301
12.7 Super Intelligence for High-Dimensional Data . . . 301
References . . . 305
13 Comparison and Fusion of Methods and Future Research. . . 307
13.1 Comparison of GLC with Chernoff Faces and Time Wheels . . . 307
13.2 Comparison of GLC with Stick Figures. . . 309
13.3 Comparison of Relational Information in GLCs and PC . . . 312
13.4 Fusion GLC with Other Methods. . . 313
13.5 Capabilities . . . 313
13.6 Future Research . . . 315
List of Abbreviations
APC Anchored Paired Coordinates
ATC Anchored Tripled Coordinates
CF Chernoff Face
CPC Collocated Paired Coordinates
CTC Collocated Tripled Coordinates
CV Cross Validation
DM Data Mining
GLC General Line Coordinates
GLC-AL GLC-L algorithm for automatic discovery GLC-B Basic GLC graph-constructing algorithm
GLC-CC1 Graph-constructing algorithm that generalizes CPC GLC-CC2 Graph-constructing algorithm that generalizes CPC and SC GLC-DRL GLC-L algorithm for dimension reduction
GLC-IL Interactive GLC-L algorithm
GLC-L GLC for linear functions
GLC-PC Graph-constructing algorithm that generalizes PC
GLC-SC1 Forward graph-constructing algorithm that generalizes SC GLC-SC2 Backward graph-constructing algorithm that generalizes
SC
ILC In-Line Coordinates
IPC In-Plane Coordinates
LDA Linear Discriminant Analysis
MDF Multiple Disk Form
MDS Multidimensional Scaling
ML Machine Learning
MOO Multiobjective Optimization
PC Parallel Coordinates
PCA Principal Component Analysis
PCC Partially Collocated Coordinates
PF Pareto Front
P-to-G representation Mapping an n-D point to a graph P-to-P representation Mapping an n-D point to a 2-D point
PWC Paired Crown Coordinate
SC Star Coordinate
SF Stick Figure
SME Subject Matter Expert
SOM Self-Organized Map
SPC Shifted Paired Coordinate
STP Shifted Tripled Coordinate
SVM Support Vector Machine
Abstract
This book combines the advantages of the high-dimensional data visualization and machine learning for discovering complex n-D data patterns. It vastly expands the class of reversible lossless 2-D and 3-D visualization methods which preserve the n-D information for the knowledge discovery. This class of visual representations, called the General Lines Coordinates (GLCs), is accompanied by a set of algorithms for n-D data classification, clustering, dimension reduction, and Pareto optimiza-tion. The mathematical and theoretical analyses and methodology of GLC are included. The usefulness of this new approach is demonstrated in multiple case studies. These case studies include the Challenger disaster, the World hunger data, health monitoring, image processing, the text classification, market prediction for a currency exchange rate, and computer-aided medical diagnostics. Students, researchers, and practitioners in the emerging Data Science are the intended read-ership of this book.
Chapter 1
Motivation, Problems and Approach
The noblest pleasure is the joy of understanding. Leonardo da Vinci
1.1
Motivation
High-dimensional data play an important and growing role in knowledge discovery, modeling, decision making, information management, and other areas. Visual representation of high-dimensional data opens the opportunity for understanding, comparing and analyzing visually hundreds of features of complicated multidi-mensional relations of n-D points in the multidimultidi-mensional data space. This chapter presents motivation, problems, methodology and the approach used in this book for Visual Knowledge Discovery and Machine Learning. The chapter discussed the difference between reversible lossless and irreversible lossy visual representations of n-D data along with their impact on efficiency of solving Data Mining/Machine Learning tasks. The approach concentrates on reversible representations along with the hybrid methodology to mitigate deficiencies of both representations. This book summarizes a series of new studies on Visual Knowledge Discovery and Machine Learning with General Line Coordinates, that include the following conference and journal papers (Kovalerchuk 2014, 2017; Kovalerchuk and Grishin 2014, 2016, 2017; Grishin and Kovalerchuk2014; Kovalerchuk and Smigaj2015; Wilinski and Kovalerchuk 2017; Smigaj and Kovalerchuk 2017; Kovalerchuk and Dovhalets 2017). While visual shape perception supplies 95–98% of information for pattern recognition, the visualization techniques do not use it very efficiently (Bertini et al. 2011; Ward et al.2010). There are multiple long-standing challenges to deal with high-dimensional data that are discussed below.
Many procedures for n-D data analysis, knowledge discovery and visualization have demonstrated efficiency for different datasets (Bertini et al.2011; Ward et al. 2010; Rübel et al. 2010; Inselberg 2009). However, the loss of information and
occlusion, in visualizations of n-D data, continues to be a challenge for knowledge discovery (Bertini et al.2011; Ward et al.2010). The dimension scalability chal-lenge for visualization of n-D data is already present at a low dimension ofn = 4.
©Springer International Publishing AG 2018
B. Kovalerchuk,Visual Knowledge Discovery and Machine Learning, Intelligent Systems Reference Library 144,
https://doi.org/10.1007/978-3-319-73040-0_1
Since only 2-D and 3-D data can be directly visualized in the physical 3-D world, visualization of n-D data becomes more difficult with higher dimensions. Further progress in data science require greater involvement of end users in constructing machine learning models, along with more scalable, intuitive and efficient visual discovery methods and tools that we discuss in Chap.12.
In Data Mining (DM), Machine Learning (ML), and relatedfields one of these challenges is ineffective heuristic initialselection of a class of models. Often we do not have both (1)prior knowledgeto select a class of these models directly, and (2)visualization toolsto facilitate model selection losslessly and without occlusion. In DM/ML often we are in essenceguessingthe class of models in advance, e.g., linear regression, decision trees, SVM, linear discrimination, linear programming, SOM and so on. In contrast the success is evident in model selection in low-dimensional 2-D or 3-D data that we can observe with a naked eye as we illustrate later. While iden-tifying a class of ML models for a given data is rather an art than science, there is a progress in automating this process. For instance, a method to learn a kernel function for SVM automatically is proposed in (Nguyen et al.2017).
In visualization of multi-dimensional data, the major challenges are (1) occlusion, (2) loss of significant n-D information in 2-D visualization of n-D data, and (3) dif fi-culties offinding visual representation with clear and meaningful 2-D patterns.
While n-D data visualization is a well-studied area, none of the current solutions fully address these long-standing challenges (Agrawal et al.2015; Bertini, et al.2011; Ward et al.2010; Inselberg2009; Simov et al.2008; Tergan and Keller2005; Keim et al.2002; Wong and Bergeron1997; Heer and Perer2014; Wang et al.2015). In this book, we consider the problem of the loss of information in visualization as a problem of developing reversible lossless visual representation of multidimensional (n-D) data in 2-D and 3-D. This challenging task is addressed by generalizing Parallel and Radial coordinates with a new concept ofGeneral Line Coordinates (GLC).
1.2
Visualization: From n-D Points to 2-D Points
The simplest method to represent n-D data in 2-D is splitting n-D space X1X2…Xninto all 2-D projections XiXj,i,j= 1,…,nand showing them to the user. It produces a large number of fragmented visual representations of n-D data anddestroys the integrityof n-D data. In each projection XiXj, this method maps each n-D point to a single 2-D point. We will call such mapping as n-D point to 2-D-pointmapping and denote is as P-to-P representation for short. Multidimensional scaling (MDS) and other similar nonreversible lossy methods are such point-to-point representations. These methods aim preserving theproximityof n-D points in 2-D using specific metrics (Jäckle et al.2016; Kruskal and Wish1978; Mead
1992). It means that n-D information beyond proximity can belostin 2-D in general, because its preservation is not controlled. Next, the proximity captured by these methods may or may not be relevant to the user’s task, such as classification of n-D points, when the proximity measure is imposed on the task externally not derived from
it. As a result, such methods can drasticallydistortinitial data structures (Duch et al. 2000) that were relevant to the user’s task. For instance, a formal proximity measure such as the Euclidean metric can contradict meaningful similarity of n-D points known in the given domain. Domain experts can know that n-D pointsaandbare closer to each other than n-D pointscandd, |a,b| < |c,d|, but the formal externally imposed metricFmay set up an opposite relation,F(a,b) >F(c,d). In contrast, lossless data displays presented in this book provide opportunity to improve interpretability of visualization result and its understanding by subject matter experts (SME).
The common expectation of metric approaches is that they will produce relatively simpleclouds of 2-D points on the plane with distinct lengths, widths, orientations, crossings, and densities. Otherwise, if patterns differ from such clouds, these methods do not help much to use other unique human visual perception and shape recognition capabilities in visualization (Grishin 1982; Grishin et al. 2003). Together all these deficiencies lead to ashallow understandingof complex n-D data.
To cope with abilities of the vision system to observe directly only 2-D/3-D spaces, many other common approaches such as Principal Components Analysis (PCA) also project every n-D data point into a single 2-D or 3-D point. In PCA and similar dimension reduction methods, it is done by plotting the two main components of these n-D points (e.g., Jeong et al.2009). These two components show only afractionof all information contained in these n-D points. There is no way to restore completely n-D points from these two components in general beyond some very special datasets. In other words, these methods do not provide anisomorphic (bijective, lossless, rever-sible)mappingbetween an n-D dataset and a 2-D dataset. These methods provide only aone-way irreversible mappingfrom an n-D dataset to a 2-D data set.
Such lossy visualization algorithms may notfind complex relationseven after multiple time-consuming adjustments of parameters of the visualization algorithms, because they cut out needed information from entering the visualization channel. As a result, decisions based on such truncated visual information can be incorrect. Thus, we have two major types of 2-D visualizations of n-D data available to be combined in the hybrid approach:
(1) each n-Dpoint is mapped to a 2-Dpoint (P-to-P mapping), and
(2) each n-Dpoint is mapped to a 2-D structure such as agraph(we denote this mapping as P-to-G), which is the focus of this book.
Both types of mapping have their own advantages and disadvantages.
Principal Component Analysis (PCA) (Jolliffe1986; Yin2002), Multidimensional Scaling (MDS) (Kruskal and Wish 1978), Self-Organized maps (SOM) (Kohonen 1984), RadVis (Sharko et al. 2008) are examples of (1), and Parallel Coordinates (PC) (Inselberg2009), and General Line Coordinates (GLC) presented in this book are examples of (2). The P-to-P representations (1) are not reversible (lossy), i.e., in general there is no way to restore the n-D point from its 2-D representation. In contrast, PC and GLC graphs are reversible as we discuss in depth later.
their representations in 2-D. PCA minimizes the mean-square difference between the original points and the projected ones (Yin 2002). For individual points, the difference can be quite large. For a 4-D hypercube SOM and MDS have Kruskal’s stress values SSOM= 0.327 and SMDS= 0.312, respectively, i.e., on average the distances in 2-D differ from distances in n-D over 30% (Duch et al.2000).
Such high distortion of n-D distances (loss of the actual distance information) can lead to misclassification, when such corrupted 2-D distances are used for the classification in 2-D. This problem is well known and several attempts have been made to address by controlling and decreasing it, e.g., for SOM in (Yin2002). It can lead to disasters and loss of life in tasks with high cost of error that are common in medical, engineering and defense applications.
In current machine learning practice, 2-D representation is commonly used for illustration and explanation of the ideas of the algorithms such as SVM or LDA, but much less for actual discovery of n-D rules due to the difficulties to adequately represent the n-D data in 2-D, which we discussed above. In thehybrid approach that combined analytical and visual machine learning presented in this book the visualization guides both:
• Getting the information about the structureof data, and pattern discovery, • Finding most informative splits of data into the training–validation pairs for
evaluation of machine learning models. This includesworst, best and median split of data.
1.3
Visualization: From n-D Points to 2-D Structures
While mapping n-D points to 2-D points provides an intuitive and simple visual metaphor for n-D data in 2-D, it is also a major source of the loss of information in 2-D visualization. For visualization methods discussed in the previous section, this mapping is a self-inflicted limitation. In fact, it isnot mandatoryfor visualization of n-D data to represent each n-D point as a single 2-D point.
Each n-D point can be represented as a2-D structureor aglyph. Some of them can be reversible and lossless. Several such representations are already well-known for a long time, such asradial coordinates(star glyphs),parallel coordinates(PC), bar-and pie-graphs, andheat maps. However, these methods have different lim-itations on the size and dimension of data that are illustrated below.
Figure1.1shows two 7-D pointsAandBin Bar (column)-graph chart and in Parallel Coordinates. In a bar-graph each value of coordinates of an n-D point is represented by the height of a rectangle instead of a point on the axis in the Parallel Coordinates.
The PC lines in Fig.1.1b can be obtained by connecting tops of the bars (columns) 7-D points A and B. The backward process allows getting Fig.1.1a from Fig.1.1b.
The major difference between these visualizations is inscalability. The length of the Bar-graph will be 100 times wider than in Fig.1.1a if we put 100 7-D points to the Bar graph with the same width of the bars. It will notfit the page. If we try to keep the same size of the graph as in Fig.1.1, then the width of bars will be 100 times smaller, making bars invisible.
In contrast, PC and Radial coordinates (see Fig.1.2a) can accommodate 100 lines without increasing the size of the chart, but with significant occlusion. An alternative Bar-graph with bars for point B drawn on the same location as A (on the top of Awithout shifting to the right) will keep the size of the chart, but with severe occlusion. The last three bars of pointA will be completely covered by bars from point B. The same will happen if lines in PC will be represented as filled areas. See Fig.1.2b. Thus, when we visualize only asinglen-D point a bar-graph is equivalent to the lines in PC. Both methods are lossless in this situation. For more n-D points, these methods are not equivalent in general beyond some specific data.
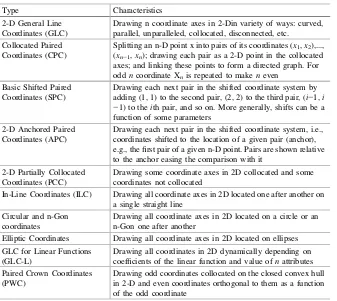
Figure1.2a shows points A and B in Radial (star) Coordinates and Fig. 1.3 shows 6-D point C= (2, 4, 6, 2, 5, 4) in the Area (pie) chart and Radial (star) Coordinates. The pie-chart uses the height of sectors (or length of the sectors) instead of the length of radii in the radial coordinates.
Tops of the pieces of the pie in Fig.1.3a can be connected to get visualization of point C in Radial Coordinates. The backward process allows getting Fig.1.3a from Fig.1.3b. Thus, such pie-graph is equivalent to its representation in the Radial Coordinates.
As was pointed out above, more n-D points in the same plot occlude each other very significantly, making quickly these visual representations inefficient. To avoid
X1 X2 X3 X4 X5 X6 X7 X1 X2 X3 X4 X5 X6 X7
(b) 7-D points A and B in Parallel Coordinates. (a) 7-D points A and B in Bar-graph
Fig. 1.1 7D pointsA= (7, 9, 4, 10, 8, 3, 6) in red andB= (6, 8, 3, 9, 10, 4, 6) in blue in a Bar-graph chart (a) and in Parallel coordinates (b)
occlusion, n-D points can be shownside-by-side in multiple plots not in a single plot. In this case, we are limited by the number of the plots that can be shown side-by-side on the screen and by perceptual abilities of humans to analyze multiple plots at the same time.
Parallel and radial coordinates have fundamental advantage over bar- and pie-charts allowing the visualization of larger n-D datasets with less occlusion. However parallel and radial coordinates suffer from occlusion just for larger datasets.
To visualize each n-D data pointx = (x1,x2,…xn) theheat mapuses a line ofn -bars (cells) of the same size with values of color intensity of the bar (cell) matched to the value of xi. While the heat map does not suffer from the occlusion, it is limited in the number of n-Dpoints anddimension nthat can be presented to the user on a single screen. It is also unable to showalln-D points that are close to the given n-D point next to that n-D point. Only two n-D points can be shown on the adjacent rows.
The discussed visualization approaches can be interpreted as specific glyph -based approaches where each glyph is a sequence of bars (cells), segments, or connected points specifically located on the plane in the parallel or radial way. These visual representations provide homomorphismorisomorphismof each n-D data point into visual features of somefigures, e.g., a“star”.
Homomorphic mapping is a source of one of the difficulty of these visualiza-tions, because it maps two or more equal n-D points to a single visual representation (e.g., to a single polyline in the parallel coordinates). As a result, the information about frequencies of n-D points in the dataset is lost in 2-D visualization. Commonly it is addressed by drawing wider lines to represent more often n-D points, but with higher occlusion. In the heat map all equal points can be preserved at the cost of less number of different n-D points shown.
(a)6-D point C in Pie-chart. (b)6-D point C=(2,4,6,2,5,4) in Radial Coordinates.
The capabilities of lossless visual analytics based on shape perception have been shown in (Grishin1982; Grishin et al.2003), and are widely used now in technical and medical diagnostics, and other areas with data dimensions up to a few thou-sands with the use of a sliding window to show more attributes than can be represented in a static screen.
In this book, Chap.6demonstrates shape perception capabilities in experimental setting. While moving to datasets with millions of records and many thousands of dimensions is a challenge for both lossless and lossy algorithms, lossless repre-sentations are very desirable due to preservation of information. The combination of both types of algorithms is most promising.
1.4
Analysis of Alternatives
An important advantage of lossless visualizations is that an analyst can compare much more data attributes than in lossy visualizations. For instance, multidimen-sional scaling (MDS) allows comparing only a few attributes such as a relative distance, because other data attributes are not presented in MDS.
Despite the fundamental difference between lossy and lossless visual represen-tations of n-D data and needs in more lossless represenrepresen-tations, the research pub-lications on developing new lossless methods are scarce.
The positive moment is that the importance of this issue is recognized, which is reflected in appearance of both terms “lossy”and “lossless” in the literature and conference panel discussions (Wong and Bergeron 1997; Jacobson et al. 2007; Ljung et al.2004; Morrissey and Grinstein2009; Grinstein et al.2008; Belianinov et al.2015).
In (Morrissey and Grinstein 2009) the term lossless is specifically used for Parallel Coordinates. In (Belianinov et al.2015) the termlossless visualizationis also applied to parallel coordinates and its enhancement, to contrast it with PCA and similar techniques (“Parallel coordinates avoid the loss of information afforded by dimensionality reduction technique”). Multiple aspects of dimension reduction for visualization are discusses in (Gorban et al.2008).
There is a link between lossy image/volume compression and lossy visualiza-tion. In several domains such as medical imaging and remote sensing, large subsets of the image/volume do not carry much information. This motivates lossy com-pression of some parts of them (to a lower resolution) and lossless representation of other parts (Ljung et al. 2004). Rendering such images/volumes is a form of visualization that is partially lossy.
The loss can be controlled by selecting an appropriate fused color (3-D point) depending on the task. In the passive radar data, the noisy background is visualized as a lossy textured gray area. In both these examples, the visualization method does not cause the loss of information. The uncontrolled lossy image/volume compres-sion that precedes such visualization/rendering could be the cause. This is the major difference from lossy visualizations considered above.
A common main idea behind Parallel, Radial and Paired Coordinates defined in Chap.2is the exchangeof a simple n-D point that has no internal structure for a 2 -D line (graph) that has the internal structure. In short, this is the exchange of the dimensionalityfor astructure. Every object with an internal structure includes two or more points. 2-D points do not overlap if they are not equal. Any other unequal 2-D objects that contain more than one point can overlap. Thus, clutter is a direct result of this exchange.
The only way to avoid clutter fundamentally is locating structured 2-D objects side-by-side as it is done with Chernoff faces (Chernoff1973). The price for this is more difficulty in correlating features of the faces relative to objects that are stacked (Schroeder2005).
Amultivariate datasetconsists of n-tuples (n-D points), where each element of an n-D point is a nominal or ordinal value corresponding to an independent or dependent variable. The techniques to display multivariate data are classified in (Fua et al.1999) as it is summarized below:
(1) Axis reconfiguration techniques, such as parallel coordinates (Inselberg2009; Wegman1990) and radial/star coordinates (Fienberg1979),
(2) Glyphs(Andrews 1972; Chernoff1973; Ribarsky et al.1994; Ward2008), (3) Dimensional embedding techniques, such as dimensional stacking (LeBlanc
et al.1990) and worlds within worlds (Feiner and Beshers1990),
(4) Dimensional subsetting, such as scatterplots (Cleveland and McGill1988), (5) Dimensional reductiontechniques, such as multidimensional scaling (Kruskal
and Wish 1978; Mead 1992; Weinberg 1991), principal component analysis (Jolliffe1986) and self-organizing maps (Kohonen1984).
Axis reconfiguration and Glyphs map axis into another coordinate system. Chernoff faces map axis onto facial features (icons).Glyphs/Icons are a form of multivariate visualization in orthogonal 2-D coordinates that augment each spatial point with a vector of values, in the form of a visual icon that encodes the values coordinates (Nielson et al. 1990). The glyph approach is more limited in dimen-sionality than parallel coordinates (Fua et al.1999).
There is also a type of glyph visualization where each number in the n-D point is visualized individually. For instance, an n-D point (0, 0.25, 0.5, 0.75, 1) is represented by a string of Harvey balls or by color intensities. This visualization is not scaled well for large number of points and large dimensions, but it is interesting conceptually because it is does not use any line to connect values in the visualization. These lines are a major source of the clutter in visualizations based on Parallel and Radial coordinates. It is easy to see that Harvey balls are equivalent to heat maps.
Parallel and Radial coordinates areplanar representationsof an n-D space that map points to polylines. The transformation to the planar representation means that axis reconfiguration andglyphs trade a structurally simple n-D object to a more complex object, but in a lower dimension (complex 2-D face, or polyline versus a simple n-D string of numbers). Pixel oriented techniques map n-D points to a pixel-based area of certain properties such as color or shape (Ankerst et al.1996). Dimensional subsetting literally means that a set of dimensions (attributes) is sliced into subsets, e.g., pairs of attributes (Xi, Xj) and each pair is visualized by a scatterplot with total n2 of scatterplots that form a matrix of scatterplots. Dimensional embeddingalso is based on subsets of dimensions, but with specific roles. The dimensions are divided into those that are in the slice and those that create thewrappingspace where these slices are then embedded at their respective position (Spence2001).
Technically (1)–(3) are lossless transformations, but (4) can be a lossy or a lossless transformation depending on completeness of the set of subsets, and the dimensional reduction (5) is a lossy transformation in general. Among lossless representations, only (1) and (2)preserve n-D integrity of data. In contrast, (3) and (4) split each n-D record adding a new perceptual task of assembling low-dimensional visualized pieces of each record to the whole record. Therefore, we are interested in enhancing (1) and (2).
The examples of (1) and (2) listed above fundamentally try to represent visually actual values ofall attributes of an n-D point. While this ensures lossless repre-sentation, it fundamentallylimits the sizeof the dataset that can be visualized (Fua et al. 1999). The good news is that visualizingall attributes is not necessary for lossless representation. The position of the visual element on 2-D plane can be sufficientto restore completely the n-D vector as it was shown for Boolean vectors in (Kovalerchuk and Schwing2005; Kovalerchuk et al.2012).
The major advantage of PC and related methods is that they are lossless and reversible. We can restore an n-D point from its 2-D PC polyline. This ensures that we do not throw the baby out with the bathwater. i.e., we will be able to discover n-D patterns in 2-D visualization that are present in the n-D space. This advantage comes with the price.
The number of pixels needed to draw a polyline is much more than in“n-D point to 2-D point”visualizations such as PCA. For instance, for 10-D data point in PC, the use of only 10 pixels per line that connects adjacent nodes will require 1010 = 100 pixels, while PCA may require only one pixel. As a result, rever-sible methods suffer from occlusion much more than PCA. For some datasets, the existing n-D pattern will be completely hidden under the occlusion (e.g., (Kovalerchuk et al.2012) for breast cancer data).
Parallel and Radial Coordinates provide lossless representation of each n-D point visualized individually. However, their ability to represent losslessly a set of n-D points in a single coordinate plot is limited by occlusion and overlapping values. The same is true for other General Line Coordinates presented in this book. While full losslessness is an ideal goal, the actual level of losslessness allows discovering complex patterns as this book demonstrates.
1.5
Approach
The approach taken in this book to enhance visual discovery in n-D data consists of three major components:
(A1) Generatingnew reversible lossless visualization methodsof n-D data. (A2) Combining lossless and lossy visualizations for the knowledge discovery,
when each of them separately is not sufficient.
(A3) Combininganalytical and visual data mining/machine learning knowledge discoverymeans.
Thegenerationof new reversible lossless visual representations includes:
(G1) Mapping n-D data points into separate 2-Dfigures(graphs) providing better pattern recognition in correspondence with Gestalt laws and recent psychological experiments with more effective usage of human vision capabilities of shape perception.
(G2) Ensuring interpretation of features of visual representations in the original n-D data properties.
(G3) Generatingn-D data of givenmathematical structuressuch as hyper-planes, hyper-spheres, hyper–tubes, and
(G4) Discovering mathematical structures such as hyper-planes, hyper-spheres, hyper–tubes and others in real n-D data in individual and collaborative settings by using a combination of visual and analytical means.
The motivation for G3 is that visualization results for n-D data withknown in advance structure(modeled data) are applicable for a whole class of data with this structure. In contrast, a popular approach of inventing visualizations for specific empirical datawithunknown math propertiesmay not be generalizable.
In other words, inventions of specific visualization for specific data do not help much for visualization of other data. In contrast, if we can establish that new data have the same structure that was explored on the modeled data we can use the derived properties for these new data to construct the efficient visualization of these new data. The implementation of this idea is presented in Chap.6 with hyper-cylinders (hyper-tubes).
Example Consider modeled n-D data with the following structural property. All n-D points of class 1 are in the one hypercube and all n-D points of class 2 are in
another hypercube, and the distance between these hyper-cubes is greater or equal toklengths of these hyper-cubes.
Assume that it was established by amathematical proofthat, for any n-D data with this structure, a lossless visualization methodV, produces visualizations of n-D points of classes 1 and 2, which do not overlap in 2-D. Next, assume also that this property was tested on new n-D data and was confirmed. Then the visualization method V can be applied with the confidence that it will produce a desirable visualization without occlusion.
Thecombinationof lossless and lossy visual representations includes
(CV1) Providing means for evaluating the weaknesses of each representation and (CV2) Mitigating weaknesses by sequential use of these representations for
knowledge discovery.
The results of this combination, fusion of methods are hybrid methods. The motivation for the fusion is in the opportunity to combine the abilities of lossy methods to handle larger data sets and of larger dimensions with abilities of the lossless methods to preserve better n-D information in 2-D.
The goal of hybrid methods is handling the same large data dimensions as lossy methods, but with radically improved quality of results by analyzing more infor-mation. It is possible by applyingfirst lossy methods to reduce dimensionality with acceptable and controllable loss of information, from, say, 400 dimensions to 30 dimensions, and then applying lossless methods to represent 30 dimensions in 2-D losslessly. This approach is illustrated in Chap. 7 in Sect.7.3.3, where 484 dimensions of the image were reduced to 38 dimensions by a lossy method and then then 38-D data are visualized losslessly in 2-D and classified with high accuracy. The future wide scope of applications of hybrid methods is illustrated by the large number of activities in lossless Parallel Coordinates and lossy PCA captured by Google search: 268,000 records for “Parallel Coordinates” and 3,460,000 records for“Principal Component Analysis”as of 10/20/2017.
The progress in PC took multiple directions (e.g., Heinrich and Weiskopf2013; Viau et al.2010; Yuan et al.2009) that include unstructured and large datasets with millions of points, hierarchical, smooth, and high order PC along with reordering, spacing andfiltering PC, and others. The GLC and hybrid methods can progress in the same way to address Big Data knowledge discovery challenges. Some of these ways are considered in this book.
References
Agrawal, R., Kadadi, A., Dai, X., Andres, F.: Challenges and opportunities with big data visualization. In Proceedings of the 7th International Conference on Management of computational and collective intElligence in Digital EcoSystems 2015 Oct 25 (pp. 169–173). ACM
Andrews, D.: Plots of high dimensional data. Biometrics28, 125–136 (1972)
Ankerst, M., Keim, D.A., Kriegel, H.P.: Circle segments: a technique for visually exploring large multidimensional data sets. In: Visualization (1996)
Belianinov, A., Vasudevan, R., Strelcov, E., Steed, C., Yang, S.M., Tselev, A., Jesse, S., Biegalski, M., Shipman, G., Symons, C., Borisevich, A.: Big data and deep data in scanning and electron microscopies: deriving functionality from multidimensional data sets. Adv. Struct. Chem. Imag.1(1) (2015)
Bertini, E., Tatu, A., Keim, D.: Quality metrics in high-dimensional data visualization: an overview and systematization, IEEE Tr. on Vis. Comput. Graph.17(12), 2203–2212 2011 Chernoff, H.: The use of faces to represent points in k-dimensional space graphically. J. Am. Stat.
Assoc.68, 361–368 (1973)
Cleveland, W., McGill, M.: Dynamic graphics for statistics. Wadsworth, Inc. (1988)
Duch, W., Adamczak, R., Grąbczewski, K., Grudziński, K., Jankowski, N., Naud, A.: Extraction of knowledge from Data using Computational Intelligence Methods. Copernicus University, Toruń, Poland (2000).https://www.fizyka.umk.pl/*duch/ref/kdd-tut/Antoine/mds.htm Feiner, S., Beshers, C.: Worlds within worlds: metaphors for exploring n-dimensional virtual
worlds. In Proceedings of the 3rd annual ACM SIGGRAPH symposium on User interface software and technology, pp. 76–83 (1990)
Fienberg, S.E.: Graphical methods in statistics. Am. Stat.33, 165–178 (1979)
Fua, Y.,Ward, M.O., Rundensteiner, A.: Hierarchical parallel coordinates for exploration of large datasets. Proc. of IEEE Vis. 43–50 (1999)
Gorban, A.N., Kégl, B., Wunsch, D.C., Zinovyev, A.Y. (eds.): Principal Manifolds for Data Visualization and Dimension Reduction. Springer, Berlin (2008)
Grinstein G., Muntzner T., Keim, D.: Grand challenges in information visualization. In: Panel at the IEEE 2008 Visualization Conference (2008). http://vis.computer.org/VisWeek2008/ session/panels.html
Grishin V., Kovalerchuk, B.: Stars advantages vs, parallel coordinates: shape perception as visualization reserve. In: SPIE Visualization and Data Analysis 2014, Proc. SPIE 9017, 90170Q, p. 8 (2014)
Grishin V., Kovalerchuk, B.: Multidimensional collaborative lossless visualization: experimental study, CDVE 2014, Seattle, Sept 2014. Luo (ed.) CDVE 2014. LNCS, vol. 8683, pp. 27–35. Springer, Switzerland (2014)
Grishin, V., Sula, A., Ulieru, M.: Pictorial analysis: a multi-resolution data visualization approach for monitoring and diagnosis of complex systems. Int. J. Inf. Sci.152, 1–24 (2003) Grishin, V.G.: Pictorial analysis of Experimental Data. pp. 1–237, Nauka Publishing, Moscow
(1982)
Heer, J., Perer, A.: Orion: a system for modeling, transformation and visualization of multidimensional heterogeneous networks. Inf. Vis.13(2), 111–133 (2014)
Heinrich, J., Weiskopf, D.: State of the Art of Parallel Coordinates, EUROGRAPHICS 2013/ M. Sbert, L Szirmay-Kalos, 95–116 (2013)
Inselberg, A.: Parallel coordinates: Visual Multidimensional Geometry and its Applications. Springer, Berlin, (2009)
Jäckle, D., Fischer, F., Schreck, T., Keim, D.A.: Temporal MDS plots for analysis of multivariate data. IEEE Trans. Vis. Comput. Graph.22(1), 141–150 (2016)
Jacobson, N., Gupta, M., Cole, J.: Linear fusion of image sets for display. IEEE Trans. Geosci. Remote Sens.45(10), 3277–3288 (2007)
Jeong, D.H., Ziemkiewicz, C., Ribarsky, W., Chang, R., Center, C.V.: Understanding Principal Component Analysis Using a Visual Analytics Tool. Charlotte visualization center, UNC Charlotte (2009)
Jolliffe, J.: Principal of Component Analysis. Springer, Berlin (1986)
Keim, D.A., Hao, M.C., Dayal, U., Hsu, M.: Pixel bar charts: a visualization technique for very large multi-attribute data sets. Information Visualization.1(1), 20–34 (2002 Mar)
Keim, D., Mansmann, F., Schneidewind, J., Thomas, J., Ziegler, H.: Visual analytics: scope and challenges. In: Visual Data Mining, pp. 76–90 (2008)
Kohonen, T.: Self-organization and Associative Memory. Springer, Berlin (1984)
Kovalerchuk, B.: Visualization of multidimensional data with collocated paired coordinates and general line coordinates. In: SPIE Visualization and Data Analysis 2014, Proc. SPIE 9017, Paper 90170I, 2014,https://doi.org/10.1117/12.2042427, 15 p
Kovalerchuk, B.: Super-intelligence Challenges and Lossless Visual Representation of High-Dimensional Data. International Joint Conference on Neural Networks (IJCNN), pp. 1803–1810. IEEE (2016)
Kovalerchuk, B.: Visual cognitive algorithms for high-dimensional data and super-intelligence challenges. Cognitive Systems Research45, 95–108 (2017)
Kovalerchuk, B, Schwing, J, eds.: Visual and Spatial Analysis: Advances in Data Mining, Reasoning, and Problem Solving. Springer Science & Business Media (2005)
Kovalerchuk B., Grishin V., Collaborative lossless visualization of n-D data by collocated paired coordinates, CDVE 2014, Seattle, Sept 2014, Y. Luo (ed.) CDVE 2014, LNCS vol. 8683, pp. 19–26, Springer, Switzerland (2014)
Kovalerchuk, B., Smigaj A.: Computing with words beyond quantitative words: in-congruity modelling. In Proc. of NAFIPS, 08–17-19, 2015, Redmond, WA, pp. 226–233. IEEE (2015) Kovalerchuk, B., Grishin V.: Visual Data Mining in Closed Contour Coordinates, IS&T International Symposium on Electronic Imaging 2016, San Francisco, CA, Visualization and Data Analysis 2016, VDA-503.1- VDA-503.10
Kovalerchuk, B., Dovhalets, D.: Constructing Interactive Visual Classification, Clustering and Dimension Reduction Models for n-D Data. Informatics4(3), 23 (2017)
Kovalerchuk, B., Grishin, V.: Adjustable general line coordinates for visual knowledge discovery in n-D data. Inf. Vis. (2017).10.1177/1473871617715860
Kovalerchuk, B., Kovalerchuk, M.: Toward virtual data scientist. In Proceedings of the 2017 International Joint Conference On Neural Networks, Anchorage, AK, USA, 14–19 May 2017 (pp. 3073–3080)
Kovalerchuk, B., Perlovsky, L., Wheeler, G.: Modeling of phenomena and dynamic logic of phenomena. J. Appl. Non-class. Log.22(1), 51–82 (2012)
Kruskal, J., Wish, M.: Multidimensional scaling. SAGE, Thousand Oaks, CA (1978) LeBlanc, J., Ward, M., Wittels, N.: Exploring n-dimensional databases. Proc. Vis.’90. pp. 230
–237 (1990)
Ljung, P., Lundstrom, C., Ynnerman, A., Museth, K.: Transfer function based adaptive decompression for volume rendering of large medical data sets. In: IEEE Symposium on Volume Visualization and Graphics, pp. 25–32 (2004)
Mead, A.: Review of the development of multidimensional scaling methods. J. Roy. Stat. Soc. D: Sta.41, 27–39 (1992)
Morrissey, S. Grinstein, G.: Visualizing firewall configurations using created voids. In: Proceedings of the IEEE 2009 Visualization Conference, VizSec Symposium, Atlantic City, New Jersey
Nguyen, T.D., Le, T., Bui, H., Phung, D.: Large-scale online kernel learning with random feature reparameterization. In: Proceedings of the 26th International Joint Conference on Artificial Intelligence (IJCAI-17) 2017 (pp. 2543–2549)
Nielson, G., Shriver, B., Rosenblum, L.: Visualization in scientific computing. IEEE Comp. Soc. (1990)
Rübel, O., Ahern, S., Bethel, E.W., Biggin, M.D., Childs, H., Cormier-Michel, E., DePace, A., Eisen, M.B., Fowlkes, C.C., Geddes, C.G., et al.: Coupling visualization and data analysis for knowledge discovery from multi-dimensional scientific data. Procedia Comput. Sci.1, 1757–1764 (2010) Schroeder, M.: Intelligent information integration: from infrastructure through consistency
management to information visualization. In: Dykes, J., MacEachren, A.M., Kraak, M.J. (eds.) Exploring Geovisualization, pp. 477–494, Elsevier, Amsterdam, (2005)
Sharko, J., Grinstein, G., Marx, K.: Vectorized radviz and its application to multiple cluster datasets. IEEE Trans. Vis. Comput. Graph.14(6), 1427–1444 (2008)
Simov, S., Bohlen, M., Mazeika, A. (Eds), Visual data mining, Springer, Berlin (2008).https://doi. org/10.1007/978-3-540-71080-61
Smigaj, A., Kovalerchuk, B.: Visualizing incongruity and resolution: Visual data mining strategies for modeling sequential humor containing shifts of interpretation. In: Proceedings of the 19th International Conference on Human-Computer Interaction (HCI International). Springer, Vancouver, Canada (9–14 July 2017)
Spence, R., Information Visualization, Harlow, London: Addison Wesley/ACM Press Books, 206 pp., (2001)
Tergan, S., Keller, T. (eds.) Knowledge and information visualization, Springer, Berlin (2005) Viau, C., McGuffin, M.J., Chiricota, Y., Jurisica, I.: The FlowVizMenu and parallel scatterplot
matrix: hybrid multidimensional visualizations for network exploration. IEEE Trans. Visual Comput. Graph.16(6), 1100–1108 (2010)
Wang, L., Wang, G., Alexander, C.A.: Big data and visualization: methods, challenges and technology progress. Digit. Technol.1(1), 33–38 (2015)
Ward, M.: Multivariate data glyphs: principles and practice, handbook of data visualization, pp. 179–198. Springer, Berlin (2008)
Ward, M. Grinstein, G., Keim, D.: Interactive data visualization: foundations, techniques, and applications. A K Peters, Natick (2010)
Wegman, E.: Hyperdimensional data analysis using parallel coordinates. J. Am. Stat. Assoc.411
(85), 664 (1990)
Weinberg, S.: An introduction to multidimensional Scaling. Meas. Eval. Couns. Dev.24, 12–36 (1991)
Wilinski, A., Kovalerchuk, B.: Visual knowledge discovery and machine learning for investment strategy. Cognitive Systems Research44, 100–114 (2017)
Wong, P., Bergeron, R.D.: 30 Years of multidimensional multivariate visualization. In: Nielson, G.M., Hagan, H., Muller, H. (Eds.), Scientific Visualization—Overviews, Methodologies and Techniques, vol. 3–33, IEEE Computer Society Press (1997)
Yin, H.: ViSOM-a novel method for multivariate data projection and structure visualization. IEEE Trans. Neural Netw.13(1), 237–243 (2002)
Yuan, X., Guo, P., Xiao, H., Zhou, H., Qu, H.: Scattering points in parallel coordinates. IEEE Trans. Visual Comput. Graph.15(6), 1001–1008 (2009)
Chapter 2
General Line Coordinates (GLC)
Descartes lay in bed and invented the method of co-ordinate geometry.
Alfred North Whitehead
This chapter describes various types of General Line Coordinates for visualizing multidimensional data in 2-D and 3-D in a reversible way. These types of GLCs include n-Gon, Circular, In-Line, Dynamic, and Bush Coordinates, which directly generalize Parallel and Radial Coordinates. Another class of GLCs described in this chapter is a class of reversible Paired Coordinates that includes Paired Orthogonal, Non-orthogonal, Collocated, Partially Collocated, Shifted, Radial, Elliptic, and Crown Coordinates. All these coordinates generalize Cartesian Coordinates. In the consecutive chapters, we explore GLCs coordinates with references to this chapter for definitions. The discussion on the differences between reversible and non-reversible visualization methods for n-D data concludes this chapter.
2.1
Reversible General Line Coordinates
2.1.1
Generalization of Parallel and Radial Coordinates
The radial arrangement ofncoordinates with a common origin is used in several 2-D visualizations of n-D data. The first has multiple names [e.g., star glyphs
(Fanea et al.2005), andstar plot(Klippel et al.2009)], the nameRadar plotis used in Microsoft Excel. We call this lossless representation of n-D data as the
Traditional Radial (Star) Coordinates (TRC). In the TRC, the axes for variables
radiate in equal angles from a common origin. A line segment can be drawn along each axis starting from the origin and the length of the line (or its end) represents the value of the variable (Fig.2.1).
Often the tips of the star’s beams are connected in order to create a closed
contour, star (Ahonen-Rainio and Kraak2005). In the case of the closed contour, we will call the Traditional Radial Coordinates asTraditional Star Coordinates
©Springer International Publishing AG 2018
B. Kovalerchuk,Visual Knowledge Discovery and Machine Learning, Intelligent Systems Reference Library 144,
https://doi.org/10.1007/978-3-319-73040-0_2
(TSC), or Star Coordinates for short if there is no confusion with others. The closed contour is not required to have a full representation of the n-D point. A link betweenxnand x1can be skipped.
Without closing the line, TRC and Parallel Coordinates (PC) (Fig.2.2) are
mathematically equivalent(homomorphic). For every pointpon radial coordinate X, a pointq exists in the parallel coordinate X that has the same value asp. The difference is in the geometric layout (radial or parallel) of n-D coordinates on the 2D plane. The next difference is that sometimes, in the Radial Coordinates, each n-D point is shown as aseparate small plot, which serves as an iconof that n-D point.
In the parallel coordinates, all n-D points are drawn on the same plot. To make the use of the radial coordinates less occluded at the area close to the common origin of the axis, a non-linear scale can be used to spread data that are close to the origin as is shown later in Chap.4. Radial and Parallel Coordinates above are examples of generalized coordinates, calledGeneral Line Coordinates (GLC).
These GLC coordinates can be of different length, curvilinear, connected or
disconnected, and oriented to any direction (see Fig.2.3a, b). The methods for constructing curves with Bezier curves are explained later for In-Line Coordinates.
Fig. 2.1 7-D pointD= (5, 2, 5, 1, 7, 4, 1) in radial coordinates
X1 X2 X3 X4 X5 X6 X7
Fig. 2.2 7-D pointD= (5, 2, 5, 1, 7, 4, 1) in parallel coordinates
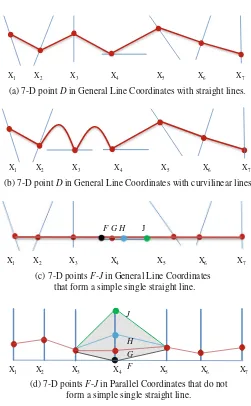
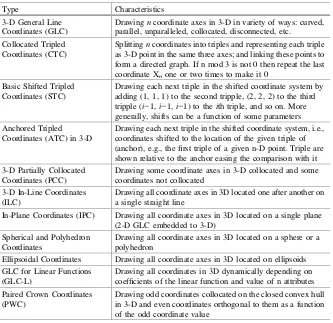
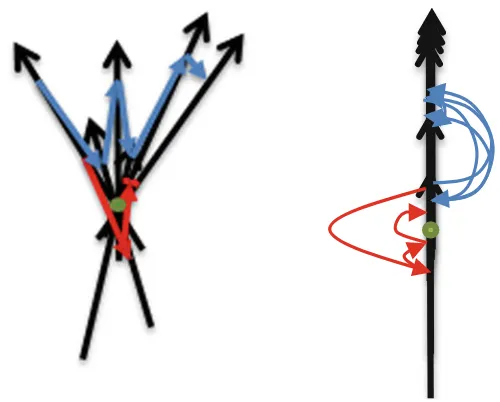
The 7-D points shown in Fig.2.3are
F¼ð3;3:5;2;0;2:5;1:5;2:5Þ; G¼ð3;3:5;2;2;2:5;1:5;2:5Þ;
H¼ð3;3:5;2;4;2:5;1:5;2:5Þ; J¼ð3;3:5;2;8;2:5;1:5;2:5Þ;
whereGis shown with red dots. HereF,GandJdiffer fromGonly in the values of
x4. Now let {(g1, g2, g3, x4, g5, g6, g7)} be a set of 7-D points with the same coordinates as inG, butx4can take any value in [0, 8].
(a) 7-D point Din General Line Coordinates with straight lines.
(b) 7-D point Din General Line Coordinates with curvilinear lines.
(c) 7-D points F-Jin General Line Coordinates that form a simple single straight line.
(d) 7-D points F-Jin Parallel Coordinates that do not form a simple single straight line.
X1 X2 X3 X4 X5 X6 X7
X1 X2 X3 X4 X5 X6 X7
J
H G F
X1 X2 X3 X4 X5 X6 X7
X1 X2 X3 X4 X5 X6 X7
F G H J
This set is fully represented in Fig.2.3c by the simple red line with dots com-pletely covering X4coordinate. In contrast, this dataset is more complex in Parallel
Coordinates as Fig.2.3d shows.
This example illustrates the important issue that each GLC has its own set of n-D data that are simpler than in other GLC visualizations. This explains the need for developing:
(1) MultipleGLCs to get options for simpler visualization of a wide variety of n-D datasets,
(2) Mathematical description of classes of n-D data, where particular GLC is simpler than other GLCs, and
(3) Algorithmsto visualize those n-D sets in simpler forms.
Several chapters of this book address these needs for a number of GLCs and can serve as a guide for development (1)–(3) for other GLCs in the future.
2.1.2
n-Gon and Circular Coordinates
The lines of some coordinates in the generalized coordinates can also form other shapes and continue straight after each other without any turn between them.
Figure2.4shows a form of the GLC, where coordinates are connected to form
the n-Gon Coordinates. The n-Gon is divided into segments and each segment
encodes a coordinate, e.g., in a normalized scale within [0, 1]. Ifxi= 0.5 in an n-D
point, then it is marked as a point on Xisegment. Next, these points are connected
to form the directed graph starting fromx1.
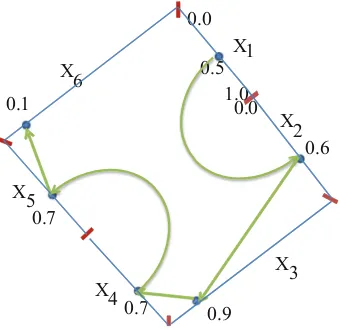
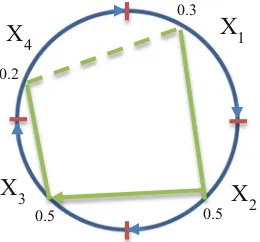
Figure2.5shows examples of circular coordinates in comparison with Parallel Coordinates. Circular Coordinates is a form of the GLC where coordinates are connected to form a circle. Similarly, to n-Gon the circle is divided into segments,
X1
each segment encodes a coordinate, and points on the coordinates are connected to form the directed graph starting fromx1.
Circular coordinates also can be used with splitting coordinates, where two coordinates out ofncoordinates identify thelocationof the center of the circle and remainingn-2 coordinates are encoded on the circle (Fig.2.5).
This is a way to represent geospatial data. Multiple circles can be scaled to avoid their overlap. The size of the circle can encode additional coordinates (attributes). In the same way, n-Gon can be used in locational setting for representing geospatial information.
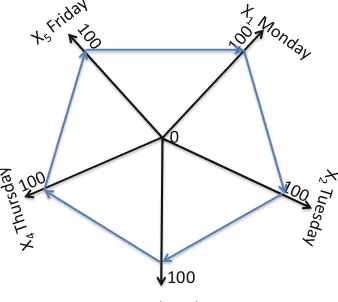
Figure2.6shows other examples of n-Gon coordinates, where the n-Gon is not arbitrary selected, but the use of a pentagon that reflects 5 trading days of the stock market.
(a) Parallel Coordinates display. (b) Circular Coordinates display.
(c) Spatially distributed objects in circular coordinates with two coordinates X5 and X6used as a location in 2-D and X7is encoded by the sizes of circles.
X1
Figure2.7 shows stock data in Radial Coordinates. While visuals in Figs.2.6
and2.7are different, both show that in this example the stock price did not change significantly during the week.
This circular setting of coordinates provides a convenient way to observe the change from thefirst trading data (Monday) to the last trading data (Friday) that are located next to each other. Parallel coordinates lack this ability due to linear location of coordinates.
Figure2.8 presents 3-D pointA = (0.3, 0.7, 0.4) in 3-Gon (triangular) and in radial coordinates. It shows that they have the same expressiveness and can be used equally in the same applications.
(a) Example in n-Gon coordinates with curvi-linear edges of a graph.
(b) Example in n-Gon coordinates with straight edges of a graph.
100 0
X3 Wednesday 100X3 Wednesday 0
Fig. 2.6 Example of weekly stock data in n-Gon (pentagon) coordinates
0
100
X3 Wednesday
Fig. 2.7 Weekly stock data in radial coordinates