27
EEG CLASSIFICATION FOR EPILEPSY BASED ON WAVELET PACKET DECOMPOSITION AND RANDOM FOREST
Yuna Sugianela, Qonita Luthfia Sutino, and Darlis Herumurti
Department of Informatics, Faculty of Information and Communication Technology, Sepuluh Nopember Institute of Technology, Surabaya, 60111, Indonesia
[email protected], [email protected], [email protected]
Abstract
EEG (electroencephalogram) can detect epileptic seizures by neurophysiologists in clinical practice with visually scan long recordings. Epilepsy seizure is a condition of brain disorder with chronic noncommunicable that affects people of all ages. The challenge of study is how to develop a method for signal processing that extract the subtle information of EEG and use it for automating the detection of epileptic with high accuration, so we can use it for monitoring and treatment the epileptic patient. In this study we developed a method to classify the EEG signal based on Wavelet Packet Decomposition that decompose the EEG signal and Random Forest for seizure detection. The result of study shows that Random Forest classification has the best performance than KNN, ANN, and SVM. The best combination of statisctical features is standard deviation, maximum and minimum value, and bandpower. WPD is has best decomposition in 5th level.
Keywords: EEG, epilepsy, seizure, wavelet, random forest
Abstrak
EEG (electroencephalogram) dapat mendeteksi serangan epilepsi oleh ahli neurofisiologi dalam praktik klinis dengan memindai rekaman secara visual. Kejang epilepsi adalah kondisi gangguan otak kronis yang tidak dapat berkomunikasi, menyerang orang dari segala umur. Tantangan penelitian yang dapat dilakukan adalah bagaimana mengembangkan metode untuk pemrosesan sinyal yang mengekstrak informasi EEG halus dan menggunakannya untuk mengotomatisasi deteksi epilepsi dengan akurasi tinggi, sehingga kita dapat menggunakannya untuk memantau dan mengobati pasien epilepsi. Dalam penelitian ini kami mengembangkan sebuah metode untuk mengklasifikasikan sinyal EEG berdasarkan Dekomposisi Packet Wavelet yang menguraikan sinyal EEG dan Random Forest untuk deteksi kejang. Hasil penelitian menunjukkan bahwa performa Random Forest lebih baik dibandingakna dengan metode klasifikasi. Kombinasi fitur statistika terbaik adalah standar deviasi, nilai maksimum dan minimum, serta bandpower. WPD memiliki dekomposisi terbaik pada level 5.
Kata Kunci:EEG, epilepsi, kejang, wavelet, random forest
1. Introduction
Epilepsy seizure is a condition of brain disorder with chronic noncommunicable that affects people of all ages. The intricate chemical changes in brain nerve cells lead to sudden activity of electric current and magnetic fields during seizures [1]. EEG (electroencephalogram) can detect epileptic seizures by neurophysiologists in clinical practice with visually scan long recordings [2].
There are many various of EEG analysis and classification methods use the fact that the processing of information in the EEG signal as dynamical changes of the electrical activity [3]. The challenge of study is how to develop a method for signal processing that extract the subtle
information of EEG and use it for automating the detection of epileptic with high accuration, so we can use it for monitoring and treatment the epileptic patient.
Related work
Some research have proposed epilepsy diagnosis by using wavelet transformation (WT) for processing signal and feature extraction. Compared to Fourier Transform, WT has smoother representation, because it captures changes of EEG signals in details [3].
Discrete Wavelet Transformation (DWT) is one of wavelet analysis used in common. DWT processes the EEG signal into approximations (low frequency) in every levels and detail coefficients (high frequency) only in first level. The output of this analysis is wavelet coefficients. Xie and Krishnan [11] proposed research to detect seizure and diagnose epilepsy using DWT for EEG signal feature extraction with Haar wavelet.
The performance in detecting epilepsy has been evaluated using Wavelet Packet Decomposition (WPD), DWT, and Empirical Mode Decomposition (EMD) [4]. DWT and WPD are wavelet based methods which the difference with EMD is EMD has no decrease in the number of features. Because WPD has developed DWT capabilities which WPD decomposes signal into both approximations and detail coefficients, it results better frequency resolution. It has been proved that overall accuracy in three classes case using Random Forest classifier and WPD to process signal results 99.66% where using DWT and EMD to process signal results 98.4% and 90.4% [4]. For other dataset classification that has more than 3 classes case, WPD has lower accuracy than DWT [5].
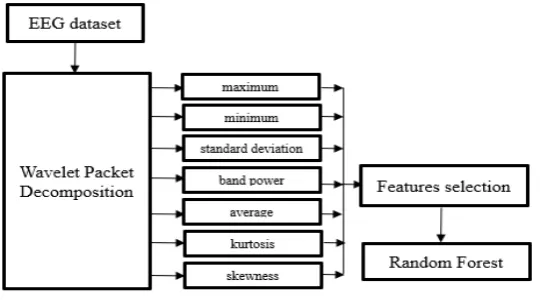
2. Methods
The proposed method in this study is the classification of EEG signal based on Random
Forest method, and the decomposition of signal EEG is based on Wavelet Packet Decomposition.
We select the statistical features from the coefficent’s result in WPD. Figure 1 shows the block diagram of proposed method.
Dataset
The dataset of EEG was downloaded from The Epileptologie, Univertat Bonn. The dataset consists of 5 EEG records set, those are A, B, C, D, and E. Each EEG dataset contains 100 single-channel brain, they were taken from different people recording process of dataset A and B were taken from healthy volunteers but with different conditions. Dataset A was recorded with open eyes but B with close eyes. Dataset C, D, and E were taken from epileptic patients. Same with A and B, the recording process of dataset C, D, and E were taken from different conditions. Dataset C was recorded from epileptic patients with no seizure and open eyes, but D with close eyes. Dataset E were taken from seizure epileptic patients.
As mentioned before, we can conclude that there are 200 healthy people’s brain signal data, 200 epileptics with no seizure patient’s brain signal data, and 100 seizure epileptic patient’s brain signal data [6].
Mother Wavelet
To get information from EEG signals, there are tools called wavelets. Part of wavelets that is called Mother Wavelet has been used to extract frequency and time information smoother [12]. Daubechies is one of orthogonal wavelet families that is able to get optimal set of EEG signal [13]. Some researches have been found using DWT based on Daubechies 4 (db4) as mother wavelet. They show that db4 is commonly suitable for detecting epilepsy case [3].
Wavelet packet decompostion
The wavelet packet decomposition (WPD) extends the capabilities of the WD (wavelet decom-position) and DWT (discrete wavelet transform). Whereas DWT decomposes the approximations records only, WPD does the decomposition of both approximation and detail records into sublevels. WD only partitions the frequency axis finely toward low frequency, and WPD is a generalized version, which also decomposes the high frequency bands that are kept intact in wavelet decomposition [4].
WPD applies a complete wavelet package tree, it delivers better frequency resolution for the signal being decomposed. Another benefit of the WPD is that it represents the reconstruction of the original signal by combining various decomposition level [4]. In this study, daubechies4 (db4) mother wavelet function is used as previous research with DWT for detecting epilepsy .
Feature selection
Wavelet packet decomposition can be used for denoising and feature extraction [3]. In this study, we select seven different statistical features for EEG classification, aiming at decreasing the dimensionality of dataset. The signal statistics are used in order to capture important information while keeping the low data dimensions. The seven statistical features are mean, standard deviation (Std), minimum value (Min), maximum value (Max), bandpower (Bp), skewness (Skw), and kurtosis (Krt).
In this experiment, we combine statistic features that have been mentioned. The number of features each combination used is 4 statistical features. There are 14 experimental combinations of statistical features performed.
The purpose of combining statistic features is to find the best accuracy between combinations made. Beside statistic features, we also evaluate the level of decomposition based on WPD. The number of sub-bands every level is 2k, where k is TABLE1
STATISTIC FEATURES COMBINATION
No Statistical Features
1 2 3 4
1 Mean Max Min Bp
2 Mean Max Min Krt
3 Max Min Bp Krt
4 Skw Max Min Bp
5 Std Max Min Bp
6 Mean Bp Krt Skw
7 Max Bp Krt Skw
8 Min Bp Krt Skw
9 Std Bp Krt Skw
10 Mean Krt Skw Std
11 Max Krt Skw Std
12 Min Krt Skw Std
13 Min Max Mean Std
14 Max Min Bp Krt
TABLE2
COMPARISON DWT AND WPD WITH DB4 Classi
fi-cation
Meth od
Decomposition Level
3 4 5
DWT WPD DWT WPD DWT WPD
KNN 88.91% 86.37% 86.46% 85.61% 86.87% 85.39%
ANN 91.58% 91.50% 91.46% 91.37% 92.97% 91.96%
SVM 73.31% 79.13% 77.73% 85.39% 81.47% 90.33%
number of level. In level 3 decomposition, there are
21+ 22+ 23= 14 sub-bands. So, there are 15 ×
4 statistic features = 60 features in level 3. In
the level 4 are (14 + 24) × 4 statistic features =
120 features and in level 5 there are (30 +
25) × 4 statistic features = 248 features.
EEG classification based on random forest (RF)
Random forest (RF) are an ensemble-based learning technique for classification [7], consists of many individual classification trees, where each tree is a classifier by itself that is given a certain weight for its classification output. The classification outputs from all trees is used to
determine the overall classification output is done by choosing the mode of all trees classification [8]. In the case of classification, a large number of classification trees is generated, whereby each tree is asigned an input vector sampled independently from the same distribution using bootstrap samples. In the present case, one third of the observations (out-of-bag (OOB) set) were used for cross-validation. The OOB data are also used to obtain estimates of feature importance. Specifically, during the forest building process, an internal unbiased estimate of the generalization error (OOB error) is generated and used to identify the most important features. The final OOB prediction is the average score achieved from the TABLE3
EVALUATION OF WPD’S DECOMPOSITION LEVEL
Statistical Features
RF Decomposition Level Best Acc
3 4 5
1 96.60% 97.40% 98% 5
2 95% 95.80% 97.20% 5
3 97.20% 97.20% 97.80% 5
4 97.40% 97% 97.80% 5
5 97.80% 98.20% 98.40% 5
6 97.20% 97.20% 98.20% 5
7 97.60% 97.40% 98.20% 5
8 96.60% 97.40% 98% 5
9 98.60% 98% 98.60% 3 and 5
10 97.80% 97.80% 98.40% 5
11 97.80% 98% 98.20% 5
12 97% 98.20% 98.20% 4 and 5
13 97.20% 97.80% 98.20% 5
14 97.40% 97.20% 98% 5
TABLE4
EVALUATION OF STATISTICAL FEATURES
Statistical Features
Decomposition Level
3 4 5
1 87.55% 90.00% 93.65%
2 89.45% 90.65% 92.65%
3 91.20% 92.25% 93.75%
4 88.55% 90.55% 89.27%
5 93.25% 94.15% 96.40%
6 79.65% 81.10% 81.90%
7 87.45% 88.25% 89.30%
8 86.75% 88.25% 88.80%
9 89.90% 91.15% 90.75%
10 87.85% 89.80% 90.85%
11 87.85% 89.80% 90.85%
12 90.25% 91.35% 92.55%
13 90.55% 92.25% 94.60%
majority vote within the forest, excluding trees that included this observation during their training phase. The features that yield large score values are ranked as more important. The subset of the most important features was selected by sequential RF classification, i.e. by using labelled data to remove the least important feature in each run. By doing this, the minimum number of features required to achieve good classification accuracy was eventually selected [9].
Performance evaluation
In order to evaluate the proposed method, we use 10-fold cross-validation. This k-fold (in this study k=10) technique is implemented to create the training set and testing set for evaluation. With this technique, the feature vector set is divided into 10 subsets of equal size [10]. Of the 10 subsets, a single subset is retained as the validation data for testing the model and the remaining (k-1 or 9 in this study) subsets are used as training data. Then, the cross-validation process is repeated 10 times (the folds), with each of the 10 subsets used exactly once as the validation data. The average accuracy across all 10 trials is computed for consideration. The accuracy (Acc) are defined as:
𝐴𝑐𝑐 = 𝑇𝑃+𝑇𝑁+𝐹𝑃+𝐹𝑁𝑇𝑃+𝑇𝑁 × 100 (1)
TP (true positive) was determined when the epilepsy signals classfication as epilepsy signal. FP (false positive) was determined when the normal signals are classification as epileptic signals. TN (true negative) was determined when the normal signals are classified as an epilepsy signals. FN (false negative) was determined when the epilepsy signals are classified as normal signal as ilustrated in the confusion matrix [11].
3. Results and Analysis
Results
In this study we use the dataset for input in WPD process. We decomposed the signal of dataset and
selected statistical features from each coefisiens. We compared the number of level in signal decomposition. In this experiment, we applied different combination of statistical features.
There were 7 statistical features that selected in this study. From 7 features, we combined them into 4 for each experiment. There were 14 experiments of statistical features. In this study we got the best performance of statistical features combination.
The statistical features were used for classification process based on Random Forest method. We also compare the performance of Random Forest with other classification methods, i.e. ANN (Artificial Neural Network), KNN (K-nearest Neighbor), and SVM (Support Vector Machine).
Comparison DWT and WPD decomposition with db4 mother wavelet
Daubechies4 (db4) mother wavelet function is used as previous research with DWT for detecting epilepsy. We also used db4 mother wavelet with WPD in this study. To compare the performa of DWT and WPD with db4, we try these decomposition methods to extract signal data and use them to classify data. We use statistical features from extracting data with the combination in Table 1.
The evaluation of classification use accuracy. In this comparison, we use the average value of accuracy from 14 statistical features combination. Table 2 shows that in KNN and ANN classification, DWT has better performance than WPD, but in SVM and Random Forest classification, WPD has better performance than DWT.
Evaluation of WPD’s decomposition level
The number of decomposition level effects the number of features that are used for classification process. In this study we try 14 tests with different statistical features. From the experiment of decomposition level’s number, we get the result that is shown in Table 3. The table presents that the TABLE5
COMPARISON WITH OTHER CLASSIFICATION METHODS
Classification
KNN 86.37 6.21 85.61 35.92 85.39 110.31
ANN 91.50 0.00 91.37 0.00 91.96 0.00
SVM 79.13 0.12 85.39 0.13 90.33 0.16
best performance of decomposition is in level 5. But in some test cases, we get the fact that there are 4 test cases that the accuration of 4thlevel is less that the 5th. Those test cases are combination of statistical features in number 4, 7, 9, and 14 in Table 1.
Evaluation of statistical features
In this study we combine 7 statistical features to get the best performance. Table 4 shows the average of 4 test cases based on 4 classification methods (ANN, KNN, SVM, and RF). The result shows that the best combination of statistical features for 3 level are same, number 5 (standard deviation, maximum value, minimum value, and bandpower).
Comparison with other classification methods
To eval the performance of classification proposed method, we compare with ANN, KNN, and SVM. From the average of 14 statiscical features combination shown in Table 5, we get the high accuracy average of level 3, 4, 5 are in RF classification methods. Furthermore, based on running time average, level 5 shows more significant increase than level 4 in KNN, SVM, and RF classification methods. It indicates level 3 and 4 using RF classification method result the better performance. analysis. To evaluate the performance of proposed method, we use 10-fold cross validation and compute the accuration of classification’s result.
In this study we analyze the decomposition level of WPD and the result is 5th level has the
highest average of accuration which is 91.44%. On the other hand, according to the average of running time, result of 3rd level has more efficient running
time average which is 1.60 s. It shows that the less decomposition level of WPD results the the less time of running and the more decomposition level of WPD results the higher accuracy in several classification methods.
We extracted 7 statistical features from decomposition process based on WPD. The best combination of statistical features for classification process is standard deviation, maximum value, minimum value, and bandpower. The combination has 93.25% accuration in 3th level, 94.15% in 4th,
and 96.40% in 5th level. Classification that is based
on RF has the better performance than ANN, KNN, and SVM. The accuration of RF is 97.23% in 3th
level, 97.50% in 4th level, and 98.11% in 5th level.
References
[1] A. Zahra, N. Kanwal, S. Ehsan, and K. D. Mcdonald-maier, “Seizure detection from EEG signals using Multivariate Empirical Mode Decomposition,” Comput. Biol. Med., vol. 88, no. June, pp. 132–141, 2017. [2] J. Malmivuo and R. Plonsey, “Bioelectromagnetism: Principles and Applications of Bioelectric and Biomagnetic Fields.”
[3] O. Faust, U. R. Acharya, H. Adeli, and A. Adeli, “Wavelet-based EEG processing for computer-aided seizure detection and epilepsy diagnosis,” Seizure Eur. J.
Epilepsy, vol. 26, pp. 56–64, 2015.
[4] E. Alickovic, J. Kevric, and A. Subasi, “Biomedical Signal Processing and Control Performance evaluation of empirical mode decomposition , discrete wavelet transform , and wavelet packed decomposition for automated epileptic seizure detection and prediction,” Biomed.
Signal Process. Control, vol. 39, pp. 94–
102, 2018.
[5] S. Sunny, D. P. S, and K. P. Jacob, “A Comparative Study of Wavelet Based Feature Extraction Techniques in Recognizing Isolated Spoken Words.” [6] V. Bajaj and R. B. Pachori, “EEG Signal
Classification using Empirical Mode Decomposition and Support Vector Machine,” pp. 581–592, 2012. frequency analysis of a single EEG channel and random forest classifier,” Comput.
Methods Programs Biomed., vol. 108, no.
1, pp. 10–19, 2011.
[9] M. N. Anastasiadou, M. Christodoulakis, E. S. Papathanasiou, S. S. Papacostas, and G. D. Mitsis, “Clinical Neurophysiology Unsupervised detection and removal of muscle artifacts from scalp EEG recordings using canonical correlation analysis , wavelets and random forests,”
Clin. Neurophysiol., vol. 128, no. 9, pp.
1755–1769, 2017.
seizure detection using improved correlation-based feature selection with random forest classifier,” vol. 241, pp. 204–214, 2017.
[11] D. Rahmawati, U. C. N. R, and R. Sarno, “Classify Epilepsy and Normal Electroencephalogram ( EEG ) Signal Using Wavelet Transform and K-Nearest ... Classify Epilepsy and Normal Electroencephalogram ( EEG ) Signal
Using Wavelet Transform and K- Nearest Neighbor,” no. November, 2017.