PENERAPAN MISSOURI MATHEMATICS PROJECT (MMP) PADA POKOK BAHASAN DIMENSI TIGA DITINJAU DARI HASIL BELAJAR
MATEMATIKA BERDASARKAN TAKSONOMI BLOOM
NASKAH PUBLIKASI
Untuk Memenuhi Sebagian Persyaratan Guna Mencapai Derajat Sarjana S-1 Program Studi Pendidikan Matematika
Oleh:
FITRI ARIANI SANTOSA A 410 090 178
FAKULTAS KEGURUAN DAN ILMU PENDIDIKAN
UNIVERSITAS MUHAMMADIYAH SURAKARTA
THE IMPLEMENTATION OF MISSOURI MATHEMATICS PROJECT (MMP) MODEL TO MATHEMATICS STUDENT
ACHIEVEMENT BASED ON BLOOM TAXONOMY ON MATERIAL OF THREE DIMENTION
By
Fitri Ariani Santosa1, Idris Harta,MA.P.hD.2 1
Mahasiswa Pendidikan Matematika FKIP UMS, [email protected]
2
Staff Pengajar UMS, [email protected]
ABSTRACT
The purpose of this research is to analyze: (1) the influence of the use of Missouri Mathematics Project (MMP) model to student’s mathematics achievement, and (2) the interaction between the use of Missouri Mathematics Project (MMP) model and cognitive dimension on bloom taxonomy to student’s mathematics achievement. The populations are all students of grade X of 2012/2013 academic year in SMA IKIP Veteran III Tambakromo. Sample taken in this research as many as two classes, consist of X 1 as experiment class with 25 students and X 2 as control class with 26 students. The sampling technique used in this research is cluster random sampling. Data collection methods used are method of test and documentation method. Data analysis techniques use two ways analysis of variance with unequal cells, a prerequisite test used the Lilliefors method to normality test and the Barlett method to homogeneity test. From the analysis of data with 5% of significant level, it is satisfied that : (1) there is influence of the use of Missouri Mathematics Project (MMP) model to student’s mathematics achievement with FA = 11,76 and use of conventional model to
student’s mathematics achievement with FB = 23,81, and (2) there is no
interaction between the use of Missouri Mathematics Project (MMP) model and bloom taxonomy to student’s mathematics achievement with FAB= 1,59.
1. INTRODUCTION
In this competitive era of globalization, every country should have been able to explore its human resources for the betterment of the nation as a maximum. According M.Jumali (2008:22), education as a learning activity has been done the same age as the man himself educational actors. So men as the actors perform a process of education which is called the learning process.
At this stage there is a process to achieve a holistic behavior change. Changes not only focus on the addition of knowledge because this process can touch individual dimension in the long process (Aunurrahman, 2012:109). These changes are called achieved learning outcomes. Furthermore, the study with the instructional goals, concerns about the expected behavior of the learning process and result is expressed as achievement.
improvements in learning can make all the students in Indonesian to compete in the international arena.
http://timssandpirls.bc.edu/timss2011/index.html
Based on this statement it is necessary to innovation in teaching and learning in the classroom so that students are not just listening to the material submitted by teachers. Such innovations as applied to the learning model used. One of the innovative learning model that is able to create an atmosphere conducive to learning mathematics is learning models Missouri Mathematics Project (MMP). This statement is supported by research Dyah Musitowati (2009) which states that learning models Missouri Mathematics Project (MMP) has developed measures of well-structured. Besides models Missouri Mathematics Project (MMP) has many advantages in the study of mathematics in the classroom, including a lot of material that can be delivered to students because not much time consuming. Besides, students can work on the problems due to the large skilled training provided.
Based on these results we can conclude that the model of Missouri Mathematics Project (MMP) is effective in improving student learning outcomes, but so far the success rate has not been studied using models of Missouri Mathematics Project (MMP) on learning. As stated Benjamin Samuel Bloom (2010: 46) on revised Bloom's taxonomy of education there are six categories of assessment of learning success on the dimensions of cognitive processes. The categories include: remembering, understanding, applying, analyzing, evaluating, and creating.
From the above statement compelled researchers to conduct research on the implementation model of Missouri Mathematics Project (MMP) in the learning of mathematics is based on the cognitive dimension of Bloom's taxonomy of education.
This study used an experimental research, that is research procedures conducted to reveal a causal link two or more variables to control the influence of other variables. In this research, the independent variables are model of learning. Meanwhile, the dependent variable is student’s mathematics achievement. In this case, the influence of application of Missouri Mathematics Project (MMP)
model will be controlled and viewed to other variables that are mathematics achievement based on bloom taxonomy.
The research is conducted by dividing the subjects into two groups, experiment and control groups. The experiment group is given
Missouri Mathematics Project (MMP) model through in learning process, while the control group will be subject to conventional model.
The research is conducted in SMA IKIP Veteran III Tambakromo located at Jalan Gunung Panggung, Tambakromo, Ponjong, Gunung Kidul, D.I.Yogyakarta. The population in this study is students of grade ten of SMA IKIP Veteran III Tambakromo in the even semester, which consists of three classes with an average of students every class is 26 people. The researcher takes samples two classes of grade X that are class X 1 as an experiment class uses Missouri Mathematics Project (MMP) model and class X 2 as a control class uses conventional model in mathematics learning.
The sampling technique used in this study is cluster random sampling, this technique using to find sampel if object that will be selecting so many ( Sugiyono, 2012: 83). Before being given a treatment, both groups should be used to test whether the experiment class and the control class in a state of balance.
Correlation formula. Whereas, the level of reliability of achievement test use Alpha Cronbach formula.
The technique of data analysis uses two-way analysis of variance with unequal cells. Before doing analysis of variance, prerequisites analysis test must be conducted. It consists of normality test uses the Liliefors and homogeneity test uses Bartlett.
3. THE RESULT OR RESEARCH AND DISSCUSION
Normality test is a test that determines whether the data were analyzed on a normal distribution. The method used in the test is method Liliefors normality at significance level of 5%. Data is said to be normal if L obs<ܮ∝. From the calculations, the following results:
Table 4.4
Normality Test Results Analysis
Source Lobs La Conclusion
A1 0,168 0,171 Normal
A2 0,149 0,171 Normal
Description:
A1 = Model Missouri Mathematics Project (MMP) for the experimental class
A2 = conventional model for the control class
From table 4.4 above shows that the significance level of 5% was obtained L calculate < L table we can conclude H0 means that samples come from normally distributed population.
Homogeneity test is a test to determine whether two independent variables have the same variance or not. The homogeneity test in this study by using method of Barlett with significance level of 5%. From the calculations, the homogeneity test results as follows: Tabel 4.5
Hasil Analisis Uji Homogenitas
Source X²calculate X²tabel Conclusion
Learning Method (between A1and A2)
From table 4.5 with a significance level of 5% is obtained X²obs = X² tabel. This means that the independent variables have the same variance or in other words the data analyzed came from the same population or
homogeneous.
With the fulfillment of the nature of normality and homogeneity of variance analysis can be performed. Analysis of variance was used two-way variance with unequal cells obtained summary as follows:
Table.4.6
Summary Analysis of Two Variance Unequal Cells
MODEL JK DK RK Fa Fobs P
Decision
Rule
MMP 96.89256 1 96.89256 3.84 11.7663 < Rejected
Conventional 980.4639 5 196.0928 2.21 23.81284 < Rejected
Interaction 65.79949 5 13.1599 2.21 1.598093 > Accepted
Error 2198.678 267 8.234749
Total 3341.834 278
Based on Table 4.6 above, the two-way analysis of test results with different cells can be interpreted as follows:
1. Test between rows (A)
Calculation results obtained by analysis of variance FA = 9.35 and F table = 6.61 at significance level of 5%. Because FA > F then H0A rejected. H0A rejected then it can be stated that there are significant use of models Missouri Mathematics Project (MMP) on learning outcomes of students in high school mathematics III Tambakromo Veteran Teachers' Training College.
2. Test between column (B)
taxonomy bloom on learning outcomes of students in high school mathematics III Tambakromo Veteran Teachers' Training College.
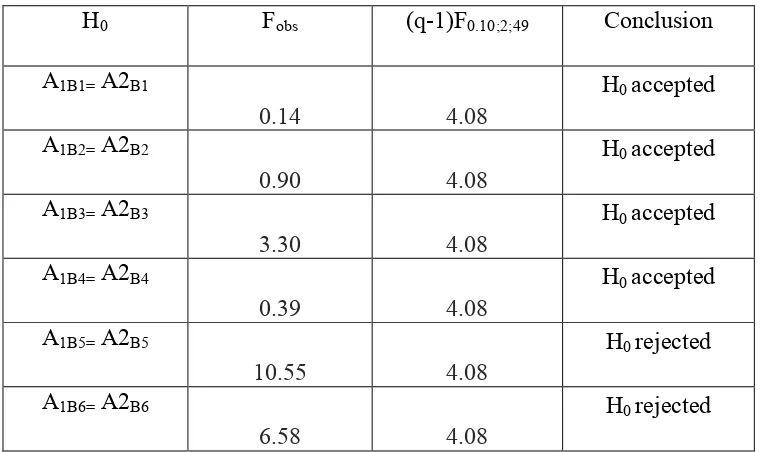
H0B rejected, this means that not all the categories in the cognitive taxonomy bloom dimensions (memorize, understand, apply, analyze, evaluate and create) gives the same effect on students' mathematics learning outcomes. At least two flats are not the same, then the multiple comparison test done to see which one had significantly different mean. Schefe method used for multiple comparison test. Multiple comparison test results are presented in the summary of the multiple comparison test between the field below:
Table 4.7
Summary analysis Comparison test meanwhile
H0 Fobs (q-1)F0.10;2;49 Conclusion
A1B1=A2B1
From the results of hypothesis testing is known that there are significant uses of learner models Missouri Mathematics Project (MMP) for mathematics learning outcomes based on the dimensions of cognitive taxonomy bloom. The above conditions can be presented in tables and graphs mean mathematics achievement results as follows:
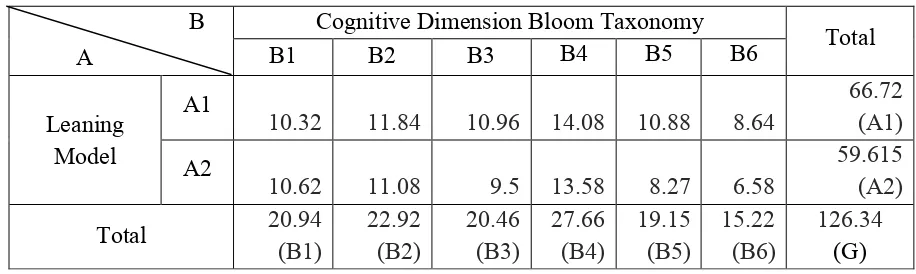
Table 4.8
Average of student Achievement on Experiment Class and Control classs Based on Bloom Taxonomy
10.32 11.84 10.96 14.08 10.88 8.64
66.72 (A1)
A2
10.62 11.08 9.5 13.58 8.27 6.58
Picture 4.3
Average of student Achievement on Experiment Class and Control classs Based on Bloom Taxonomy
1. The first hypothesis
From the results of two-way analysis of variance with unequal cells with a significance level of 5% was obtained FA = 11.766 and F table = 3.84. . Then the test is also obtained from FB = 23.813 and F table = 2.21. Due FA> F and FB> F then H0A H0B rejected, meaning that there are significant learning model uses Missouri Mathematics Project (MMP) and the conventional model of the learning outcomes of students in mathematics high School Teachers' Training College Veteran III Tambakromo.
2. The second hypothesis
From the results of two-way analysis of variance with unequal cells with a significance level of 5% was obtained FAB = 1.59 and F table = 2.21. Because FAB <F table then H0AB accepted, meaning that there is no interaction between learning models Missouri Mathematics Project with conventional models that were reviewed based on the dimensions of cognitive taxonomy bloom on high school students in the Teachers'
0 2 4 6 8 10 12 14 16
1 2 3 4 5 6
mmp
4. CONCLUSION
Based on the result of analysis and discussion done in the previous chapter with 5% of significant level, it can be concluded that:
1) There is no influence of the use of Missouri Mathematics Project (MMP) model with FA = 11,766 and influence of conventional model with FB= 23,213 to student’s mathematics achievement based on cognitive dimension bloom taxonomy in SMA IKIP Veteran III Tambakromo. From the result of multiple comparison test show that evaluation categories and create category on using Missouri Mathematics Project (MMP) model more better than using conventional model. They are known from the average, Missouri mathematics Project (MMP) model have the average which is obtained better than conventional model of cognitive dimension bloom taxonomy. 2) There is no interaction between the use of two learning model to student’s
mathematics achievement based on bloom taxonomy in SMA IKIP Veteran III Tambakromo with FAB= 1,59.
5. BIBLIOGRAPHY
Abdurrahman, Mulyono. 2003. Pendidikan Bagi Anak Berkesulitan Belajar. Jakarta: Rineka Cipta.
aunurrahman. 2012. Belajar dan Pembelajaran. Bandung: Alfabeta.
Asshaari, Izamarlina, et al. 2011. Appraisal on Bloom’s Separation in Final Examination Question of Engineering Mathematics Courses using Rasch Measurement. Procedia, 6 (2012): 172- 178
Bloom, Benjamin Samuel dkk. 1956.Kerangka Landasan untuk Pembelajaran, Pengajaran, dan Assesmen. Terjemahan oleh Agung Prihantoro. 2010. Yogyakarta: Pustaka Pelajar
Omar , Nazlia, et al. 2011. Automated Analusis of Exam Question According to Bloom’s Taxonomy. Procedia, 59 (2012): 297- 303
Wicaksono, Hafid. 2013. Kontribusi Model RME dan MMP terhadap Prestasi Belajar Matematika Ditinjau dari Kemampuan Awal Siswa
Skripsi. Surakarta: Universitas Muhammadiyah Surakarta.
Widyastuti, Sri. 2013. Pengaruh Pembelajaran MMP terhadap Kemampuan Penalaran Matematis Siswa SMK. Portal publikasi. Bandung: STKIP Siliwangi Bandung.