Assessment of Groundwater Contamination Hazard by Nitrate in Samas
Area, Bantul District, Yogyakarta, Indonesia
Thilavanh Souvannachith∗1, Doni Prakasa Eka Putra2, and Heru Hendrayana2
1Department of Water Resources Engineering, Faculty of Engineering, National University of Lao
2Department of Geological Engineering, Faculty of Engineering, Gadjah Mada University, Yogyakarta, Indonesia
ABSTRACT. Groundwater resource is an essential for various purposes in Bantul district, Yogyakarta Special Province, Indonesia, especially on Poncosari village where the water supply are depending on shallow groundwater resources. On this village, most of the houses using dug wells to provide their water needs and applying inappropriate on-site sanitation system, however there are also difference land uses. This condition increase the hazard of groundwater contamination by fecal coli bacteria and nitrate. Therefore, this research aims in term of three main objectives: firstly, to know the level of nitrate concen-tration in groundwater, secondly, to assess groundwater vulnerability and thirdly, to assess the level of groundwater contaminant hazard. Hydrogeology observation was conducted and 47 water samples (44 groundwater samples and 3 surface water samples) were col-lected from different land use type and analyze for nitrate (NO−
3) content. Methodology
used to assess the groundwater vulnerability was Simple Vertical Vulnerability method and the groundwater contamination hazard built based on the combination of groundwa-ter vulnerability and nitrate loading potential map. Results show that groundwagroundwa-ter con-centrations of nitrate range from 0.09–74.80 mg/L and the highest concentration found in the settlement area. Assessment of groundwater vulnerability reveals three areas of mod-erate, moderate high and high classes of vulnerability due to shallow groundwater and the sandy dominated overlying material in the study area. Combination of groundwater vulnerability and nitrate loading potential map indicated that groundwater contaminant hazard of nitrate range from low to high class. High class of hazard located in the settle-ment area, and low hazard of nitrate contamination found in the irrigated rice field area..
Keywords: Nitrate · Groundwater vulnerability · Groundwater contaminant loading ·
Groundwater contaminant hazard·Bantul·Indonesia.
1 INTRODUCTION
Poncosari village is located on Samas area, Srandakan Sub-District, Bantul District, Yo-gyakarta Province, in which water supply for communities are depending on shallow groundwater resources. Abstraction of ground-water commonly using dug wells due to very shallow groundwater condition of less than 4 m from the ground surface (Kabahari, 2014). The land uses in the research area are dominated by
∗Corresponding author: T. SOUVANNACHITH, De-partment of Water Resources Engineering, Faculty of Engineering, National University of Lao. E-mail: [email protected]
The potential of nitrate hazard to groundwater can be worst as the study area is located in Wates Formation and coastal sand dunes (Mac-Donald & Partners, 1984). Wates Formation consist of clay, silt, fine to medium sand and gravel. Moreover coastal sand dunes consist of fine to coarse sand sediment. Those litho-logical formation allow high vertical velocity of contaminant movement in the unsaturated zone. However, recent report relate to nitrate content on groundwater under settlement area in the study area are only beween 0.014 to 3.919 mg/L (Gunadarma, 2016). Based on the above facts, the aim of this research are: (1) to know the level of nitrate concentration in ground-water under different land uses, (2) to assess groundwater vulnerability and (3) to assess the groundwater contaminant hazard in the research area.
2 STUDYAREA
The study area is located in Samas area, Pon-cosari village, Srandakan sub-district on the southern part of Bantul dstrict, Special Province of Yogyakarta, Indonesia (Figure 1). The study area covered approximately 6.60 km2. The
boundary is next to the Progo River at the west side, Sanden sub-district at the east and the In-dia Ocean at the south.
Land use in the study area were simply clas-sified into four categories: settlement, irrigation rice field area, non-irrigation agricultural area and sand dune area (beach area) (se Figure 2). Settlement refers mainly to area where people are settling down which covered around 32 % of study area. Irrigation rice field covered from the north to the middle part around 36 % of the study area. Non- irrigation agricultural area are composed of rice field, plantation field, corn field and shrimp ponds which covered around 20 % of the study area and the rest 12 % is the natural sand dune area or beach area.
3 THEORETICALBACKGROUND
3.1 Groundwater vulnerability
Groundwater vulnerability is a term to show a susceptibility of aquifer from contamination. There are two terms of groundwater vulnera-bility; intrinsic and specific vulnerability. The intrinsic vulnerability depends on the natural attenuation capacity of the unsaturated and
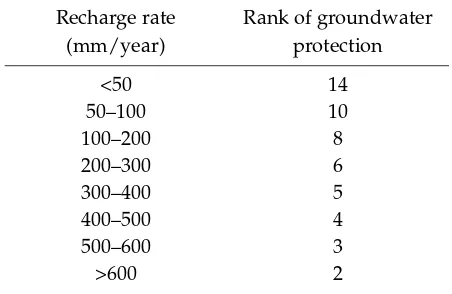
sat-Table 1: SVV values for percolation rate factor (Wu) according to the class of recharge rate
(Pu-tra, 2007).
urated zone. Meanwhile the specific vulnerabil-ity is being used to determine the vulnerabilvulnerabil-ity of groundwater as the combination between in-trinsic factor and specific land uses or specific contaminant or group of contaminants. The ef-fectiveness of unsaturated zone to reduce the contamination can be estimated based on the residence time of percolating water in the un-saturated zone. This is the main behind the development of Simple Vertical Vulnerability (SVV) method to assess groundwater vulnera-bility (Putra, 2007).
The SVV method is useful on shallow groundwater condition (depth to groundwa-ter <20 m) and the aquifer built by quargroundwa-ternary deposits. This method is based on three pa-rameters, which are: depth to groundwater, overlying materials and groundwater recharge rate. Detail explanation of SVV method can be found on Putra (2007). To classify groundwater vulnerability class, this method applying point count system for each parameters (See Table
??,??and??). The formula of calculation is as following:
PT = La+Z+Wu (1)
Where: PT: Final score of protective
effec-tiveness of the unsaturated zone; La:
Av-erage points of the soil/rock cover; La = L1+L2+L3+···+Ln
N ; Z: Points of the thickness of
unsaturated zone; Wu: Points of the recharge
Figure 1: Location of the study area.
Figure 2: Land uses in the research area.
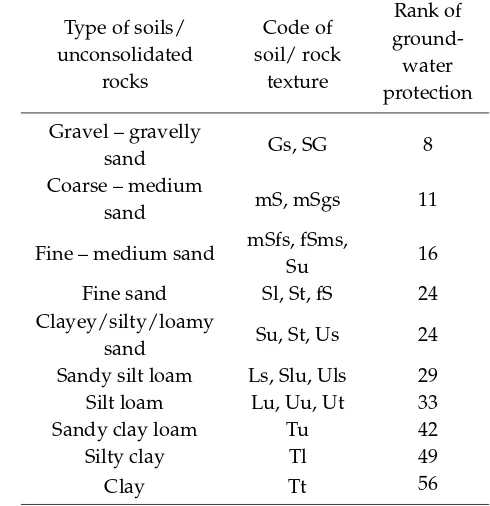
Table 2: SVV values for overlying material fac-tor (L) according to soils/unconsolidated rock type (Putra, 2007).
Type of soils/ unconsolidated
rocks
Code of soil/ rock
texture
Rank of ground-water protection Gravel – gravelly
sand Gs, SG 8
Coarse – medium
sand mS, mSgs 11
Fine – medium sand mSfs, fSms,
Su 16
Fine sand Sl, St, fS 24
Clayey/silty/loamy
sand Su, St, Us 24
Sandy silt loam Ls, Slu, Uls 29
Silt loam Lu, Uu, Ut 33
Sandy clay loam Tu 42
Silty clay Tl 49
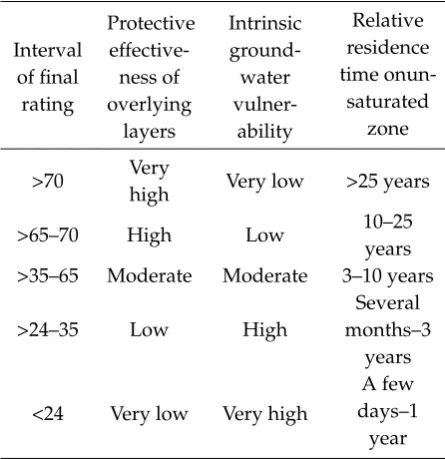
Table 3: Final rating of SVV method and its clas-sification of groundwater vulnerability (Putra, 2007).
high Very low >25 years
>65–70 High Low 10–25
years >35–65 Moderate Moderate 3–10 years
>24–35 Low High
Several months–3
years
<24 Very low Very high
A few days–1
year
3.2 Assessment of groundwater contamina-tion hazard
The groundwater contamination hazard can be defined as the probability of groundwater in the aquifer to experience negative impacts from given anthropogenic activities to such level re-sulting the groundwater is unacceptable for human consumptions. Therefore, the most logical approach to assess the occurrence of groundwater contamination is to regard it as an interaction between the contaminant load-ing and groundwater vulnerabiilty at location concerned (Foster & Hirata, 1988; Morriset al., 2003).
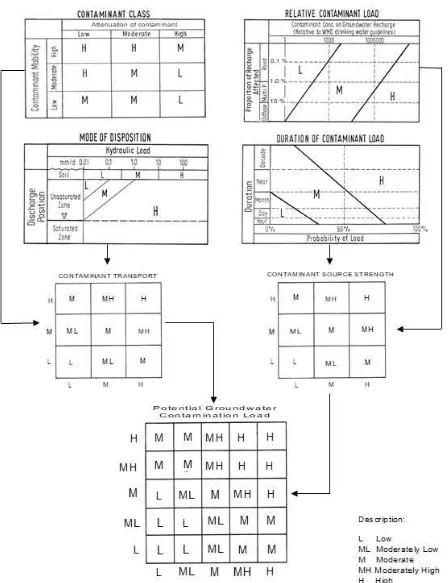
Quantification of contaminant loading po-tential considers four important factors which are class of contaminants, intensity of contami-nants, mode of disposition and duration of con-taminant application (Foster & Hirata, 1998; Jo-hansson & Hirata, 2002; Chiltonet al., 2006). On this study, modified method from Johansson & Hirata (2002) as conducted by Putra (2007) is applied. The stepwise process of obtaining class of contaminant loading potential based on this method is shown in Figure 3. In order to pro-vide groundwater contamination hazard map, a simple matrix evaluation is used to combine between map of groundwater vulnerability and
contaminant loading potential in the research area.
4 RESEARCHMETHODS
In order to achieve the objectives of research, field observation was conducted to collect primary data of groundwater condition, un-saturated lithology materials and land use type/activities. Regarding the unsaturated lithology materials, 12 locations of observa-tion were selected (see Figure 4) and grain size analysis of samples were conducted in the Soil Mechanic Laboratory of Civil Engineering, Universitas Gadjah Mada. In case of ground-water, 47 water samples were taken from dif-ferent land use in the study area, consisting of 44 groundwater samples and 3 surface wa-ter samples (see Figure 4). The analysis of the nitrate concentration in groundwater sam-ples were conducted on the Balai Besar Teknik Kesehatan Lingkungan dan Pemberantasan Penyakit Menular Yogyakarta (BBTKL & PPM) by applying the method Standard (APHA 2012, Section 4500 NO−
3B). During the water
sam-pling campaign, field measurement was also conducted to measure pH, temperature, TDS, EC, Eh of water and depth to groundwater level. Relate to land use, random observation of land use activities were conducted to collect parameters of contaminant loading potential. Only climatology and groundwater recharge data were collected from previous research.
5 RESULTS
5.1 Nitrate concentration in groundwater
Figure 4: Map of soil and groundwater samples points.
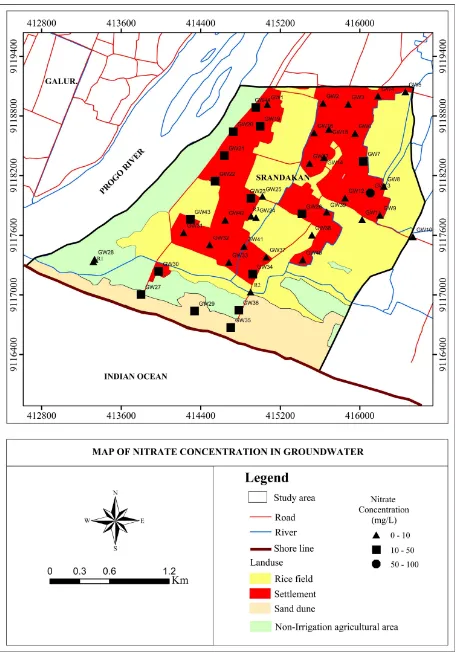
Figure 5: Nitrate concentration in groundwater of the research area.
5.2 Groundwater wulnerability
will be moderate to very high vulnerability as shown in Figure 6.
Based on the groundwater vulnerability map in study area (Figure 6), moderate vulnerability class is the dominant class of vulnerability fol-lowed by very high and high vulnerability area, respectively. In the SVV method, the class of vulnerability also represents the average move-ment of water in the unsaturated zone. Moder-ate class means an average vertical movement of water from 3 to 10 years, high class means several months to 3 years and very high means few days to 1 year.
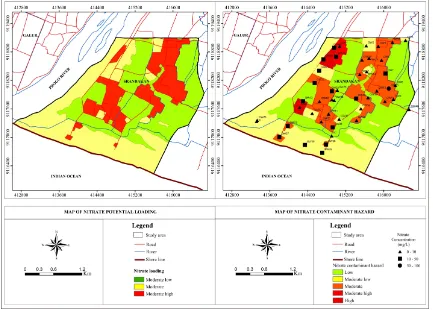
5.3 Nitrate loading potential
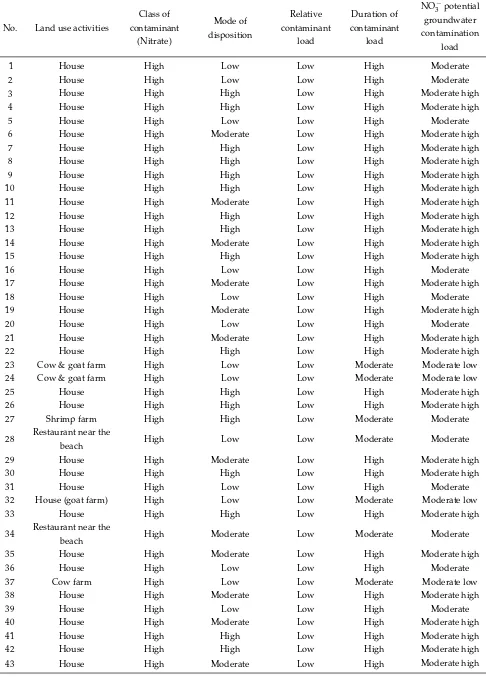
To assess the nitrate loading potential, four pa-rameters of contaminant loading potential were classified depending on their land use type and activities. Different class of parameter (low, moderate, high) are applied on similar land use as the result of 43 field observation on land use site as shown in Appendix 4. Final class of nitrate loading potential from each of land uses are adjusted by following the flow-chart method in the Figure 3, and the results is shown in Figure 7. Based on Figure 7, similar land use type, for example settlement can be classi-fied into several class of nitrate loading poten-tial. This condition occurs due to different type of housing, activities, distance from sanitation and practice of sanitation which found during the field observation.
5.4 Nitrate contamination hazard
By combining the map of nitrate loading poten-tial and groundwater vulnerability map of the study area, a map of nitrate contamination haz-ard can be constructed (see Figure 7). The result of nitrate contamination hazard shows a vary class of low to high hazard (see Table 5). The settlement area commonly fall into moderate low to high hazard. In the non-irrigation agri-cultural and sand dune area are mostly repre-sented by moderate low hazard class and some location of the sand dune area shows also mod-erate class. In addition, the rice field area clas-sified as low hazard class of nitrate contamina-tion to groundwater.
6 DISCUSSION
Based on the result of nitrate analysis, dug wells in the settlement area have the lowest and
the highest value of nitrate content on ground-water. The highest value is 74.80 mg/L was only found in one dug well in the settlement area. This is the only well which contain nitrate above the maximum acceptable concentration level of nitrate in drinking water. According to WHO (2003), maximum concentration of ni-trate in drinking water is 50 mg/L. Based on the field observation on the dug well contain the highest concentration of nitrate, the dug well is located very closed to the on-site sanitation system. However, most concentration of nitrate on groundwater under settlement area are less than 10 mg/L which is quite similar to the re-sult of Gunadarma (2016). For non irrigated and sand dunes area, the nitrate concentration on groundwater are commonly 10 to 50 mg/L, and according to the field observation this can be relate to agriculture practice of shrimp pond in the non irrigated area and tourism activities along the beaches where there are a lot of small kiosk or restaurants providing food and drink also toilet which presumably built with inap-propriate on-site sanitation system. In the case of irrigated rice field, it is found that the dug wells on this land use contain low nitrate of less than 10 mg/L. Explanation on this may be re-late to the small amount of chemical fertilizer that used by the farmer as common in Indone-sia (Putra, 2007).
Regarding the groundwater vulnerability, the dominance moderate class of vulnerability may become the reason why in the settlement area, the content of nitrate is commonly low despite most of the villagers on this area are using on-site sanitation system and shallow groundwa-ter system. The wide distribution of sandy loam and loamy sand which part of Wates Forma-tion in the study area, become an important parameter to protect the shallow groundwater from contamination although the groundwater is very shallow on this region.
Figure 6: Class of depth to groundwater and groundwater vulnerability map of the study area.
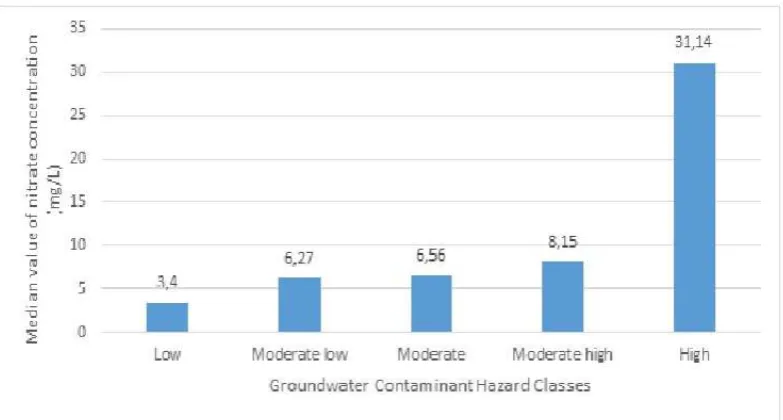
median value of nitrate content in groundwa-ter. In the high hazard area, the median value is 31.14 mg/L. In addition, the median value for other classes in order are moderate high 8.15 mg/L, moderate 6.56 mg/L, moderate low 6.27 mg/L and low 3.4 mg/L, respectively. Although the comparison shows positive cor-relation, but the value of nitrate on each classes are actually not very differ for moderate low to moderate high. This can be occurred due to problem on defining the class of parameters in the nitrate loading potential method. Even though, there are 43 observations site of land use in the study area, it is presumably a lot of difference activities on other unobserved locations. Another reason may be the combina-tion of groundwater vulnerability and nitrate loading potential may not be easily taken as a simple matrix relationship as already show by Putra (2007). Despite all of this weakness, this research has successfully show that even by applying simple approach as explained on this paper, the map of nitrate contamination hazard can predict the relative concentration of nitrate in different classes of contamination hazard.
7 CONCLUSIONS
According to the result and discussion, some conclusion can be drawn with respect to the ob-jectives as following: 1) Nitrate concentration in the groundwater of the study area ranging from 0.09–74.80 mg/L, high content of nitrate on groundwater is found in the settlement area and low content of nitrate commonly found in the irrigated rice field area. 2) Groundwater vulnerability assessment by SVV method is suc-cessfully reveal moderate, high and very high class of vulnerability from contamination in the study area, in which moderate class is the dom-inance one, followed by very high and high vul-nerability due to shallow groundwater and the sandy dominated overlying material. 3) Finally, the assessment of nitrate contaminant hazard show that the study area are classified into five zones of low, moderate low, moderate, moder-ate high and high hazard. The classes of haz-ard are correlate with the median value of ni-trate concentration in groundwater. The high and moderate high hazard area are distributed commonly in the settlement area.
ACKNOWLEDGEMENTS
The first author’s like to thanks to Indone-sian Government whose support for the master study and research activities in the Universitas Gadjah Mada, Indonesia.
REFERENCES
ARGOSS (2001) Guidelines for Assessing the Risk to Groundwater from On Site Sanitation, British Geological Survey Commisioned Report, CR/01/142, 97p.
Chilton, J., Schmoll, O and Appleyard, S. (2006) As-sessment of Groundwater Pollution Potential, In: Schmoll, O, Howard, G, Chilton, J and Chorus, I. (ed) Protecting Groundwater for Health: Man-aging Quality of Drinking Water Sources, WHO Drinking Water Quality Series, IWA Publishing, p. 375–410.
Fathmawati, Fachiroh, J., Gravitiani, E., Sarto and Husodo, A.H. (2017), Nitrate in drinking water and risk of colorectal cancer in Yogyakarta, In-donesia, Journal of Toxicology and Environmen-tal Health; Part A, Vol.80, Issue-2, 2017.
Foster, S., and Hirata, R. (1988) Groundwater Pol-lution Risk Assessment; A Methodology Using Available Data, PAN American Center For San-itary Engineering and Environmental Sciences (CEPIS), Lima, Peru.
Gunadarma, A.E. (2016) Identifikasi Pencemaran Air Tanah di Wilayah Samas dan Sekitarnya, Srandakan, Kab. Bantul, Daerah Istimewa Yo-gyakarta, Indonesia., Skripsi, Universitas Gadjah Mada.
Johansson, P.O., and Hirata, R. (2002) Groundwater Contaminant Inventory: rating of contamination source, Prepared for the international hydrologi-cal program, UNESCO. 5:63-73.
Kabahari, H. (2014) Regional Groundwater flow modeling in Samas area, Bantul district, Yo-gyakarta Special Region, Indonesia (Bachelor thesis), Gadjah Mada University.
MacDonald and Partners (1984) Greater Yogyakarta groundwater resources study: Groundwater (Vol. 3). Groundwater Development Project (P2AT). Ministry of Public Works, Government of the Re-public of Indonesia.
Morris, B.L., Lawrence, A.R., Chilton, P.J.C., Adams, B., Calow, R.C., and Klinck, B.A. (2003) Ground-water and its susceptibility to degradation: A global assesment of the problem and options for management. Early Warning and Assesment Re-port Series, RS.03-3. United Nations Environment Programme, Nairobi, Kenya.
Figure 8: Correlation between median value of nitrate concentration and groundwater contaminant hazard class.
Putra, D. P. E. (2007) The Impact of urbanization on groundwater quality: A case study in Yogyakarta City-Indonesia. In: Mitteilungen zur Ingeneiur-geologie und Hydrogeology, 96, Aachen.
Putra, D.P.E. (2010) Estimation, reality and trend of groundwater nitrate concentration under un-sewered area of Yogyakarta City, Indonesia,
Jour-nal of Southeast Asian Applied Geology, Jan-Apr 2010, Vol. 2(1). p 20-27.
Table 4: Potential of groundwater contaminant loading.
No. Land use activities
Class of contaminant
(Nitrate)
Mode of disposition
Relative contaminant
load
Duration of contaminant
load
NO−
3 potential
groundwater contamination
load
1 House High Low Low High Moderate
2 House High Low Low High Moderate
3 House High High Low High Moderate high
4 House High High Low High Moderate high
5 House High Low Low High Moderate
6 House High Moderate Low High Moderate high
7 House High High Low High Moderate high
8 House High High Low High Moderate high
9 House High High Low High Moderate high
10 House High High Low High Moderate high
11 House High Moderate Low High Moderate high
12 House High High Low High Moderate high
13 House High High Low High Moderate high
14 House High Moderate Low High Moderate high
15 House High High Low High Moderate high
16 House High Low Low High Moderate
17 House High Moderate Low High Moderate high
18 House High Low Low High Moderate
19 House High Moderate Low High Moderate high
20 House High Low Low High Moderate
21 House High Moderate Low High Moderate high
22 House High High Low High Moderate high
23 Cow & goat farm High Low Low Moderate Moderate low
24 Cow & goat farm High Low Low Moderate Moderate low
25 House High High Low High Moderate high
26 House High High Low High Moderate high
27 Shrimp farm High High Low Moderate Moderate
28 Restaurant near the
beach High Low Low Moderate Moderate
29 House High Moderate Low High Moderate high
30 House High High Low High Moderate high
31 House High Low Low High Moderate
32 House (goat farm) High Low Low Moderate Moderate low
33 House High High Low High Moderate high
34 Restaurant near the
beach High Moderate Low Moderate Moderate
35 House High Moderate Low High Moderate high
36 House High Low Low High Moderate
37 Cow farm High Low Low Moderate Moderate low
38 House High Moderate Low High Moderate high
39 House High Low Low High Moderate
40 House High Moderate Low High Moderate high
41 House High High Low High Moderate high
42 House High High Low High Moderate high
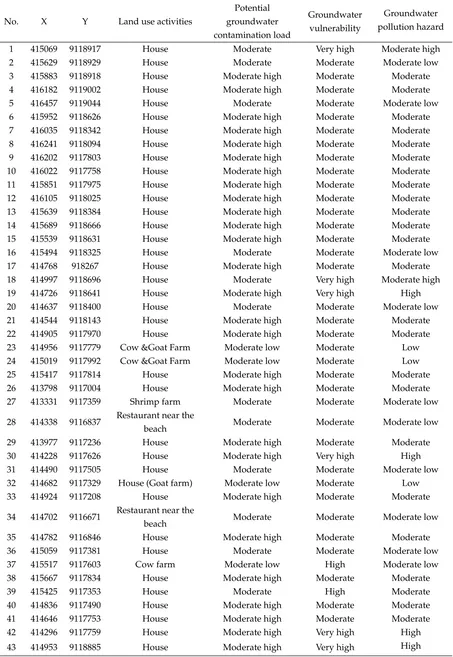
Table 5: Result of groundwater contaminant hazard assessment.
No. X Y Land use activities
Potential groundwater contamination load
Groundwater vulnerability
Groundwater pollution hazard
1 415069 9118917 House Moderate Very high Moderate high 2 415629 9118929 House Moderate Moderate Moderate low 3 415883 9118918 House Moderate high Moderate Moderate 4 416182 9119002 House Moderate high Moderate Moderate 5 416457 9119044 House Moderate Moderate Moderate low 6 415952 9118626 House Moderate high Moderate Moderate 7 416035 9118342 House Moderate high Moderate Moderate 8 416241 9118094 House Moderate high Moderate Moderate 9 416202 9117803 House Moderate high Moderate Moderate 10 416022 9117758 House Moderate high Moderate Moderate 11 415851 9117975 House Moderate high Moderate Moderate 12 416105 9118025 House Moderate high Moderate Moderate 13 415639 9118384 House Moderate high Moderate Moderate 14 415689 9118666 House Moderate high Moderate Moderate 15 415539 9118631 House Moderate high Moderate Moderate 16 415494 9118325 House Moderate Moderate Moderate low 17 414768 918267 House Moderate high Moderate Moderate 18 414997 9118696 House Moderate Very high Moderate high 19 414726 9118641 House Moderate high Very high High 20 414637 9118400 House Moderate Moderate Moderate low 21 414544 9118143 House Moderate high Moderate Moderate 22 414905 9117970 House Moderate high Moderate Moderate 23 414956 9117779 Cow &Goat Farm Moderate low Moderate Low 24 415019 9117992 Cow &Goat Farm Moderate low Moderate Low 25 415417 9117814 House Moderate high Moderate Moderate 26 413798 9117004 House Moderate high Moderate Moderate 27 413331 9117359 Shrimp farm Moderate Moderate Moderate low
28 414338 9116837 Restaurant near the
beach Moderate Moderate Moderate low 29 413977 9117236 House Moderate high Moderate Moderate 30 414228 9117626 House Moderate high Very high High 31 414490 9117505 House Moderate Moderate Moderate low 32 414682 9117329 House (Goat farm) Moderate low Moderate Low 33 414924 9117208 House Moderate high Moderate Moderate
34 414702 9116671 Restaurant near the
beach Moderate Moderate Moderate low 35 414782 9116846 House Moderate high Moderate Moderate 36 415059 9117381 House Moderate Moderate Moderate low 37 415517 9117603 Cow farm Moderate low High Moderate low 38 415667 9117834 House Moderate high Moderate Moderate
39 415425 9117353 House Moderate High Moderate