The Influence of Seismic Parameters on Site Response
Asakereh, A.1, Jamali, H.1*, and Naderi, E.1
Abstract: Geotechnical earthquake engineers have been trying to determine the most appropriate solution techniques for ground response analysis under earthquake loadings. This paper presents the importance of the adequate soil behavior model to simulate earthquake site response analysis. The influence of nonlinearity and linearity of soils on the site response is also investigated. Many methods have been proposed for the analysis of one-dimensional ground response such as nonlinear methods and equivalent linear with reduced modulus. Using 13 well known earthquake records and geotechnical information of sand in the Qeshm Island (Iran) and classification of earthquakes based on seismic parameters, the influence of each parameter on the Response spectra and Fourier Spectrum of surface of ground becomes evident. Analysis was done using two softwares; EERA (equivalent linear analysis) and NERA (nonlinear analysis) and compared. Finally, output of the software is compared with the reference result on site.
Keywords: Site response; EERA; NERA.
Introduction
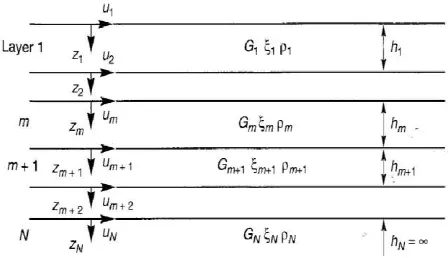
The earthquake motions at bedrock level can be modified in frequency contents and amplitude as the seismic waves are transmitted through a soil deposit. Thus, it is important to consider the soil effect in the evaluation of earthquake ground motions for the design of structures. Analytical methods for site response analysis incorporating nonlinear soil behavior have been shown to yield results in reasonably close agreements with field observa-tions. The main purpose of site response analysis is to determine the wave amplitude at the top of soil layers based on a rock outcropping motion. Ground response analysis can be one-dimensional, two-dimensional, and three-dimensional. In this study, because site condition is relatively horizontal and soil layers are parallel, one-dimensional analysis has been conducted. In this analysis, it is assumed that the soil surface and bedrock continue infinitely in the horizontal direction. In the following, different methods of ground response analysis will be exa-mined briefly. One-dimensional site response ana-lysis shown in Figure 1, specifies engineering appli-cations to evaluate the characteristics of earthquake ground motions.
1 Department of Civil Engineering, Hormozgan University, Bandar -e- Abbas, IRAN.
* Corresponding author; e-mail: [email protected]
Note: Discussion is expected before November 1st 2015, and will be
published in the “Civil Engineering Dimension” volume 18, number
1, March 2016.
Received 04 December 2014; revised 09 April 2015; accepted 04 July 2015.
Figure 1. One Dimensional Model used for Site Response Analysis of Soil Deposit
earthquake. A seismic geotechnical based computer code named "Abbas Convertor"[5] was proposed and the applicability of Abbas Converter on evaluation of site response with bedrock type was shown. Reyes et al [6] introduced a hypoplastic model for site response analysis. A method for the calibration of hypoplastic parameter for dynamic loading is proposed. Yang et al [7], conducted a systematic investigation to understand the effects of permafrost on the ground motion characteristics using one-dimensional equivalent linear analysis. The results showed that the presence of permafrost can significantly alter the ground motion characteristics and it may not be wise to ignore the effects of permafrost in the seismic design of civil structures. Phanikanth, et al [8] studied the effect of local soil sites in modifying ground response by performing one dimensional equivalent-linear ground response analysis for some of the typical Mumbai soil sites. Mohamedzein, et al [9] studied the effect of alluvial deposits in Central Khartoum on propagation of seismic motion parameters to the ground surface. The Equivalent-Linear Earthquake Response Ana-lyses (EERA) Model was used to study the effect of local soil conditions on ground motion parameters. Wang et al. [10] performed a parametric study on two hypothetical soil profiles that consist of sand and clay, respectively. The site parameters investigated are the secant shear modulus, low-strain damping ratio, types of sand or clay, location of water table, and depth of bedrock. From the results of the parametric studies, it appears that the secant shear modulus, depth of bedrock, and types of sand or clay have a significant effect on the results of site response analysis. Conversely, the low-strain damp-ing ratio and variations of water tables have only a minor influence on site response analysis. Mammo [11] used 1-D equivalent-linear analysis to propagate the input motions through the soil columns to determine the ground motions at the ground surface. The goal was to determine the seismic responses of the sites chosen for bridge construction in the framework of the Addis Ababa City Ring Road Project.
Ground Motion Parameters
Ground motion parameters are qualitative description of the basic characteristics of strong ground. Many parameters to specify the amplitude, frequency content, and duration of strong ground motions have been proposed, some of which describe just one of the features above, while others have two or even three attributes. Due to the complexity of the ground movement during an earthquake, defining a single parameter that describes all the important features of the ground motion specifically would be impossible. Kramer [12] proposed three important parameters to describe ground motion. They are:
Amplitude parameters Frequency parameters Time parameters.
Ground motion is commonly described as utilization of time history that employs motion parameters such as: acceleration, velocity, displacement, or all of these parameters. Usually one of these parameters is measured directly and the other parameters are calculated by integration or differential. The maximum horizontal acceleration (PGA) is the most common measure of the amplitude of the ground motion. For a moving component, PGA is absolute acceleration of the horizontal component of an accelerogram. Horizontal accelerations, usually beca-use of having a natural relationship with the inertia force, are used to describe ground motion. The strongest dynamic forces for a variety of very rigid structures are closely related to PGA. PGA also correlates with the severity of the earthquake, although this relationship is not very accurate. In earthquake engineering, vertical accelerations are less important than the horizontal accelerations. Ground motions with high PGAs are usually, but not always, more destructive than lower maximum acceleration. Large maximum accelerations with a very short interval of time create less damage in a variety of structures. Many earthquakes with peak acceleration greater than 0.5g have occurred but there has never been a major breakdown in struc-tures because maximum acceleration occurred with high frequency and short duration Although the maximum acceleration is an important parameter, no information about frequency content or duration of strong motion have been given. By a simple analysis the dynamic response of structures such as buildings, bridges, gradients or embankments can be realized, structures are sensitive with the frequency that have been loaded.
return to their previous primary level. For engineer-ing purposes, only the strong motion portion of the accelerogram is of interest. Bracketed duration is defined as the time between the first and last excess of threshold acceleration. Another definition of duration is based on the time interval between the points at which more 5% of the total energy has been recorded. In Figure 2 time duration of an earthquake is shown. Time duration is interval between first and last exceedance of a certain limit (e.g. 0.05g).
Earthquakes create moving complex components in a wide range of frequencies. Frequency content describes the ground motion amplitude distribution at different frequencies. Because the frequency content of earthquake motions is strongly influenced by the effects of movements, therefore, characteriza-tion of the movement, regardless of its frequency content is not possible. Frequency content is shown by different parameters, the most important of which are Fourier spectra and response spectra. They are described as follows.
A plot of Fourier amplitude versus frequency is known as a Fourier amplitude spectrum. The Fourier amplitude spectrum of strong ground motion shows how the amplitude of the motion is distributed with respect to frequency (or period). It expresses the frequency content of a motion clearly. The Fourier frequencies that produce a jagged, irregular time history. For example, Fourier spectra in a rocky environment in a short period are stronger, while Fourier spectra in soil in longer periods are stronger.
Response spectrum is the most useful and important tool for understanding the characteristics of strong ground motions and is widely used in earthquake engineering. Response spectrum describes the maximum response of a single degree of freedom (SDOF) system to a particular input motion as a function of the natural frequency (or natural period) and damping ratio of the SDOF system.
Figure 2. Time Duration of an Earthquake
It is important to remember that response spectrum represents only the maximum response of a number of different structures. However, the response of structure is of great importance in earthquake engineering, and the response spectrum has proven to be an important and useful tool for charac-terization of strong ground motion. Site response spectra calculated in this study (for Qeshm Island) due to various earthquakes was compared to response spectra of Gheshm Island presented in the National Building Code of Iran [14] named “stan -dard response spectra” in this paper.
Methods of Grounds Response Analysis
To analyze ground response three practical methods are used as follow:
Linear approach
Equivalent linear approach Nonlinear Approach
Linear approach: In this method, by calculating the transfer function of site soil, the different response parameters such as displacement, velocity, accelera-tion, shear stress, and shear strain based on the input motion parameters such as accelerated bed rock are determined. Because this method is based on the superposition forces principle it is limited to linear systems analysis. Nevertheless, Non-linear behavior can be approximated using an iterative procedure with equivalent linear soil properties.
Equivalent linear approach: Equivalent Linear approximation approach of nonlinear response is one of the most widely used approaches to model soil nonlinearity. Equivalent linear approach was pro-posed by Baret et al [4]. In the equivalent linear approach, linear analyses are performed with soil properties that are iteratively adjusted to be consis-tent with an effective level of shear strain induced in the soil. The actual non-linear hysteretic stress-strain behavior of cyclically loaded soils can be determined by considering the soil equivalent linear properties. The equivalent linear shear modulus, G, is generally taken as a secant shear modulus and the equivalent linear damping ratio, ξ, as the damping ratio that produces the same energy loss in a single cycle as the actual hysteresis loop.
Data and Analysis
Qeshm island is located a few kilometers off the Southern coast of Iran (Persian Gulf), opposite the port cities of Bandar Abbas and Bandar Khamir. The island, which hosts a 300 square kilometer free zone jurisdiction, is 135 km long, and lies stra-tegically in the Strait of Hormuz, just 60 kilometers from the Omani port of Khasab, and about 180 kilometers from the United Arab Emirates's (UAE) Port Rashid. The island, at its widest point, located near the center of the island, spans 40 kilometers. The island has a surface area of 1491 square kilometers, 2.5 times the size of Bahrain (Figure 3).
In this article two common programs are used, EERA [4] and NERA [15]. In 1998, the computer program EERA was developed in FORTRAN 90 [16] starting from the same basic concepts as SHAKE 91 [17]. EERA stands for Equivalent linear Earthquake Response Analysis. EERA is a modern implemen-tation of the well known concepts of equivalent linear earthquake site response analysis. EERA’s implementation takes full advantage of the dynamic array dimensioning and matrix operations in FORTRAN 90. In 2001, the implementation prin-ciples used for EERA were applied to NERA, a nonlinear site response analysis program based on the material model developed by Iwan [13]. NERA stands for Nonlinear Earthquake Response Analysis and takes full advantage of FORTRAN 90 and the spreadsheet program through Excel [18].
By selecting twelve powerful and well known earthquakes as ground input motion, the authors tried to cover a wide range of seismic parameters. Selected earthquakes are shown in Table 1.
The three major seismic parameters (duration, maxi-mum acceleration, effective frequency) of the listed earthquakes acceleration records are determined using the Seismo signal software [19].
Figure 3. Location of Site (Qeshm Island)
Earthquake names with seismic parameters are presented in Table 1. The most important part is classification of earthquake according to the range of their seismic parameters. These Earthquake records are divided into three main groups. Group 1 contains earthquakes with approximately equal effective frequency and duration but unequal PGA. Group 2 contains earthquakes with approximately equal effective frequency and PGA values but unequal duration values. Group 3 contains earthquakes with approximately equal PGA and duration values but unequal effective frequency values.
Earthquakes in each group have two approximately equal parameters and one unequal parameter. Each group consists of several subgroups consisting of two members. For example, two earthquakes, Spitak and Santa Barbara, with approximately equal effective frequency and maximum acceleration, but their duration is unequal. They are presented in group no 2-1. Where 2 is the number of main group and 1 is number of subgroup. According to definition for different groups of earthquakes, a single earthquake can be simultaneously similar to both groups of earthquakes (see Table 1).
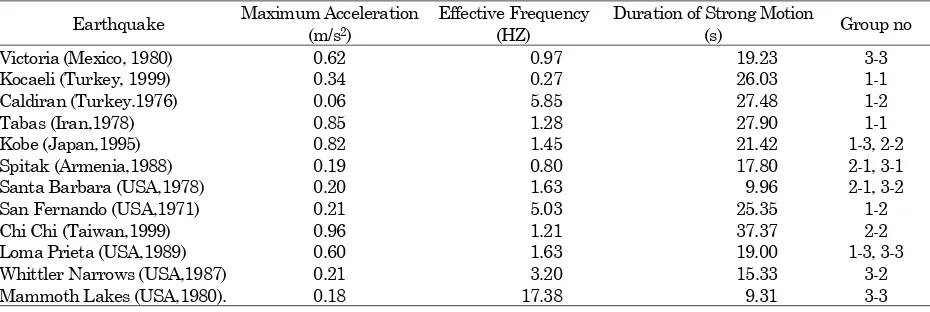
Table 1. Seismic Parameters of Earthquakes
Earthquake Maximum Acceleration (m/s2)
Effective Frequency (HZ)
Duration of Strong Motion
(s) Group no
Victoria (Mexico, 1980) 0.62 0.97 19.23 3-3
Kocaeli (Turkey, 1999) 0.34 0.27 26.03 1-1
Caldiran (Turkey.1976) 0.06 5.85 27.48 1-2
Tabas (Iran,1978) 0.85 1.28 27.90 1-1
Kobe (Japan,1995) 0.82 1.45 21.42 1-3, 2-2
Spitak (Armenia,1988) 0.19 0.80 17.80 2-1, 3-1
Santa Barbara (USA,1978) 0.20 1.63 9.96 2-1, 3-2
San Fernando (USA,1971) 0.21 5.03 25.35 1-2
Chi Chi (Taiwan,1999) 0.96 1.21 37.37 2-2
Loma Prieta (USA,1989) 0.60 1.63 19.00 1-3, 3-3
Whittler Narrows (USA,1987) 0.21 3.20 15.33 3-2
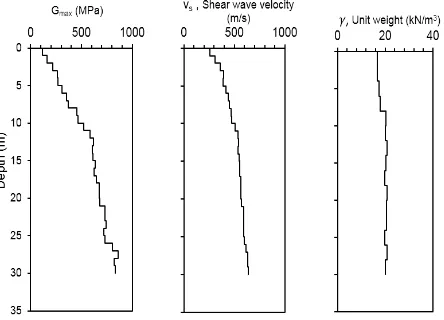
Geotechnical explorations of this article were carried out in 2011 at the request of the Hormozgan Urban and Housing Organization in Qeshm Island [20]. In this project five boreholes with 30 m length were drilled in different locations. Grain size test, specific gravity test, and some tests for determination of the soil dynamic properties were carried out on the soil samples. In these tests, shear wave velocity (vs) [21],
maximum shear modulus (Gmax), Young’s modulus
(E), Poison’s ratio (v), Atterberg limits, and Standard Penetration Test (SPT) number for every meter of the borehole were obtained [22]. In this article borehole number 2 with (0426650E, 2981665N) Universal Transverse Mercator coordinate (UTM) was chosen and studied. The parameters required in the EERA and NERA programs are depth and thickness of each layer, shear wave velocity in each layer, underground water depth, material of each layer (cohesive or granular), dry unit weight of each layer, and depth of the bedrock. Bedrock is the hard, solid rock beneath surface materials such as soil and gravel. Kashkuli et al [23] estimated Depth of bedrock between 70 and 125 meters and this study the lower boundary of the model is the bedrock which is about 100 meters deep. Dynamic para-meters of soil and bedrock depth at the site are determined using geophysical experiments (Down-hole survey). In the following parameters of model-ing are described:
a) Soil unit weights: These values fall within conventionally accepted ranges of unit weights for sandy and clayey soils. The depth of the water table, which characterizes the separation bet-ween total and saturated unit weights, is deter-mined from the compression wave velocity profiles.
b) Variation of shear modulus and damping ratio with shear strain amplitude: The variation of shear modulus and damping ratio with shear strain amplitude are assumed to be described by the standardized G/Gmax and damping curves
recommended for peninsular deep cohesionless soils by Seed [24]. Due to lack of additional information, the G/Gmax and damping curves
pro-perties are assumed to vary only with depth. c) Soil layering: The depth and thickness of soil
layers were systematically defined based on the changes with depth of:
(1) shear wave velocity (2) unit weight
(3) G/Gmax and damping ratio curves as
recom-mended by Seed [24]
d) Soil sub layering: In the calculations, soil layers were subdivided into sub layers of identical pro-perties.
e) Bedrock properties: The actual depth of the bedrock was not exactly known at the location of the vertical arrays. The bedrock was assumed to be at the same depth as the bottom accelero-meters in the vertical array. Below that depth, the bedrock is assumed to be an infinite elastic half space with the shear wave velocity and unit weights more than shear wave velocity and unit weights of soil layers. In Figure 4 the stratigra-phy of site for borehole is shown.
To analyze with EERA and NERA programs, classification of soils based on their behavior in loading is needed. This classification is based on the relation between the damping and shear modulus versus strain. Many researches have been conducted to determine this algebraic relation, the best of which was done by Seed et al [24]. After analyzing and testing of different samples of sand and clay, Seed concluded that sand and clay soils have two different types of diagrams. Therefore, in this project all clay soils are classified in the group number one and all non-cohesive soils in the group number two. The diagrams of the shear modulus and damping ratio versus strain for each type of soil are provided in the assumptions of the software and these diagrams are very close to those of Seed. So there is no need to change these diagrams. These diagrams are shown in Figure 5.
As mentioned in the introduction, the main objective of this study was to measure the impact of site on the change rate of seismic parameters of inputted earthquake. After entering the properties of soil profile sand physics modeling, seismic records (Accelerograms) are entered and the analysis is performed. Finally, the seismic parameters on the surface are obtained.
Result
It is necessary to obtain the seismic parameters of each earthquake on the ground surface. In order to compare the frequency content of the earthquakes, Fourier spectra of each group of the earthquakes on the bedrock and on the surface (in both the EERA and NERA programs) was plotted in one plot and these diagrams were then adjusted with Matlab program [25]. In Figure 6, Fourier spectra diagrams of bedrock and surface level for each group of earthquakes has been drawn. To understand the seismic behavior of soil, exact values of seismic parameters (amax, ΔT, ω ) have been obtained by both
software at the ground level and on the bed rock.
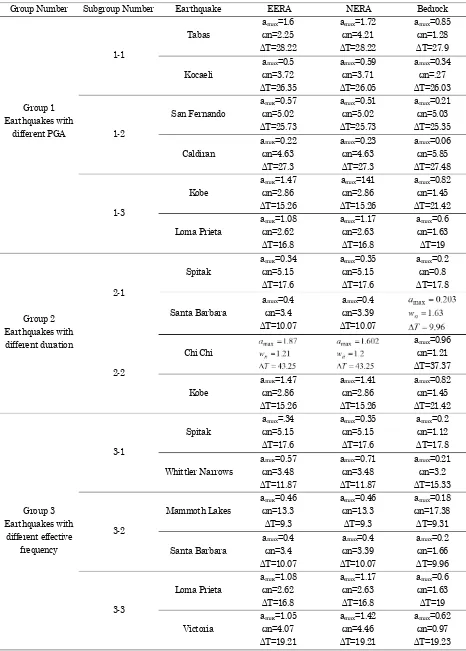
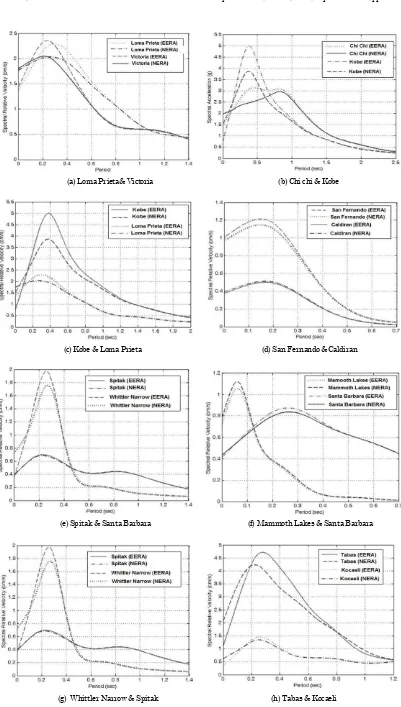
In addition to amplitude Fourier spectra and the acceleration versus time diagram of ground surface, the analysis of response spectrum is very useful. In this part of the article a comparison between earthquake response spectra at surface level for 5% damping was carried out with EERA and NERA software. This comparison is between maximum acceleration and effective period specifically shown in Table 2 and 3. To understand the behavior of response spectra, response spectra of each earth-quake group was plotted (see Figures 7 and 8).
With the help of these figures and comparison between response spectra of earthquakes in one group and also the comparison between results obtained from the two softwares: Most of the output effective frequencies of surface level are changed in the range 3.5 to 4.5 Hz. It is because the Fourier frequency spectrum of ground surface tends to be close to the natural frequency of site [26]. It means that construction of buildings with natural frequency of about 3 to 5 Hz, is not recommended.
The output figure for Fourier spectra of above 5 Hz in NERA software was greater than output from EERA software; this corresponds to research of
Kaklamanos et al [27]. They found that the accu-racies of equivalent-linear and nonlinear models were generally similar, but the predictions differ when maximum shear strains exceed 0.3%. It means for linear method at higher frequencies, the results will be more conservative.
In all earthquakes, the acceleration of maximum output on the surface increased in comparison to maximum acceleration of inputted earthquake. Kramer [12] described this phenomenon as effect of site that increases the intensity of earthquakes. Lower acceleration of earthquake leads to greater intensity of earthquake.
It seems that for earthquakes that had low effective frequency on bedrock (e.g. less than 2 Hz), after passing soil layers, can reach higher frequency, that can lead to more damages to buildings. Frequency of the Fourier spectrum of ground surface tends to be close to the natural frequency of affected site.
The effect of soil layers on the duration of these earthquakes is quite negligible. Since ground response analysis is carried out in frequency-domain effect of time cannot be seen clearly. It seems that the type of ground response analysis (linear or non-linear equivalent), although at high frequencies, makes little difference, but there is no difference in the value of effective frequency. The type of analysis had more effect on the maximum acceleration and in the accelerations higher than 1g, the difference between values obtained from EERA and NERA software is more.
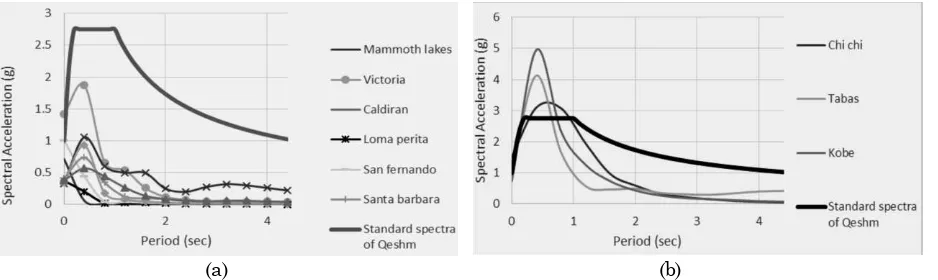
By plotting the standard response spectra in the Qeshm Island region and comparing that with EERA and NERA output spectra (Figure 5), the difference between effect of various earthquakes and standard response spectra is measurable. Finally, with the help of Standard No. 2800 [14], the stan-dard response spectrum of Qeshm Island was achieved.
a) Chi Chi & Kobe b) Loma Prieta & Kobe
c) Victoria & Loma Prieta d) Spitak & Whittler Narrow
e) Kocaeli & Tabas f) Santa Barbara & Mammoth Lakes
Table 2. Results of Analysis on Bedrock and Surface from Software
Group Number Subgroup Number Earthquake EERA NERA Bedrock
(a) Loma Prieta& Victoria (b) Chi chi & Kobe
(c) Kobe & Loma Prieta (d) San Fernando &Caldiran
(e) Spitak & Santa Barbara (f) Mammoth Lakes & Santa Barbara
(g) Whittler Narrow & Spitak (h) Tabas & Kocaeli
The standard response spectrum can be drawn as is shown in Figure 8. By drawing the earthquake response spectra with EERA software (Figures 5), and comparing them with the standard response spectrum of Qeshm Island, the following results are obtained: Although the frequency content of the
response spectra of both of the software was close, the values of maximum acceleration of response spectra in EERA software were somewhat higher than the same results of NERA software (especially for accelerations above 0.5g). It means linear method to predict the maximum acceleration is conservative.
(a) (b)
Figure 8. Response Spectra of Earthquakes of Software and Qeshm Standard Spectra, (a) Response spectra of earthquakes that does not intersect standard spectra (b) Response spectra of earthquakes that intersect standard spectra
Table 3. Results of Site Response Spectraon Bedrock and Surface from Software, amax = Maximum Acceleration (m/s2), Tn =
Effective Period
Group number Subgroup
number Earthquake
Seismic parameters on surface of ground
(by NERA)
Seismic parameters on surface of ground
(by EERA).
San Fernando amax=2.36 Tn=0.2
amax=2.62
Tn=0.2
Caldiran amax=1.02
Tn=0.18
Earthquakes with lower frequency content had a narrower or more compact shape of response spectra. This issue is not considered in standard response spectra of Qeshm Island. This means that the earthquakes with the same inputted acceleration may have the same maximum acceleration but their response spectra were quite different because of their different frequency content.
For all the earthquakes shown in the Figures 6 and 7, the frequency content and maximum acceleration value of response spectra was less than the standard spectra of Qeshm Island. This means that if these earthquakes happen, the design that is based on the standard response spectra would be conservative. But for the Kobe and Tabas earthquakes, although their frequency content is not that different from the standard response spectra, their maximum accele-rations are much higher than those of the standard response spectra.
The Chi Chi earthquake was the most critical earthquake. It is clear that for this earthquake both frequency content and maximum acceleration were higher than the same values of the standard response spectra. Therefore, if such an earthquake happens, structures with the period of 0.5 to 1.5 seconds, which were designed according to the standard response spectra will be severely damaged.
Recommendation
Although results show that accuracy of software in low frequencies are the same, but if access to the real data of ground response under earthquake loading (by vertical seismometer in a borehole), a unique comparison between observed and predicted (linear, equivalent-linear, and nonlinear) ground motions, will be possible. This comparison can be so helpful for evaluating and comparing site response models.
References
1. Arslan, H. and Siyahi, B., A Comparative Study on Linear and Nonlinear Site Response Ana-lysis, Environ Geol, 50, 2006, pp. 1193–1200. 2. Cavallaro, A., Grasso, S., and Maugeri, M., Site
Response Analysis for Tito Scalo Area (PZ) in the Basilicata Region, Geotechnical Earthquake and Engineering and Soil Dynamics IV Congress, Italy, 2008, pp. 1-11.
3. Frenna, S.M. and Maugeri, M., GEODIN: A Computer Code for Seismic Soil Response, 9th
Italian Conference of Computational Mechanics,
Catania, Italy, 20-22 June, (in Italian), 1995, pp. 145 - 148.
4. Bardet, J.P., Ichii, K., and Lin, C.H., EERA: A Computer Program for Equivalent-Linear
Earth-quake Site Response Analyses of Layered Soil Deposits. User Manual, University of Southern California, 2000.
5. Abbaszadeh Shahri, A. and Behzadafshar, K., A Case Study on Nonlinear Seismic Geotechnical Site Response Analysis Subjected to Bam Earth-quake Incites (Sirdjan Balvavard bridge-Kerman province-Iran), Arab J Geosci, 4, 2011, pp. 1103–1116.
6. Reyes, D.K., A Hypoplastic Model for Site Response Analysis, Soil Dynamics and Earth-quake Engineering , 29, 2009, pp.173–184. 7. Yang, Z., Numerical Analysis of Permafrost
Effects on the Seismic Site Response, Soil Dynamics and Earthquake Engineering, 31, 2011, pp. 282–290.
8. Phanikanth, V.S. and Rami Reddy, G., Equiva-lent Linear Seismic Ground Response Analysis of Some Typical Sites in Mumbai, Geotech Geol Eng , 29, 2011, pp. 1109–1126.
9. Mohamedzein, J.A. and Abdelwahab, A., Site Response and Earthquake Design Spectra for Central Khartoum, Bull Earthquake Eng, 4, 2006, pp. 277-293.
10. Hwang, H. and Chen, S.L., Parametric Study of Site Response Analysis, Soil Dynamics and Earthquake Engineering, 10, 1991, pp. 282-290. 11. Mammo, T., Site-Specific Ground Motion
Simu-lation and Seismic Response Analysis at the Proposed Bridge Sites, Engineering Geology, 79, 2005, pp.127–150.
12. Kramer, S.L., Geotechnical Earthquake Engi-neering, Prentice Hall, New Jersey, 1996. 13. Iwan, W.D., On A Class of Models for the
Yielding Behavior of Continuous and Composite Systems, Journal of Applied Mechanics, 34(3), 1967, pp. 612-617.
14. BHRS (Building and Housing Research Center),
Iranian Code of Practice for Seismic Resistance Design of Buildings, Standard No. 2800, Third Edition, 2005. (in Farsi) http://www.bhrc.ac.ir 15. Bardet, J.P. and Tobita, T., NERA: A Computer
Program for Nonlinear Earthquake Site Res-ponse Analyses of Layered Soil Deposits. User Manual, University of Southern California, 2001.
16. Fortran 90: Imperative Programming Language that is Especially Suited to Numeric Computa-tion and Scientific Computing. The International Business Machines Corporation (IBM), USA, 1991.
17. Schnabel, P.M., Lysmer, J., and Seed, H.B.,
SHAKE: A Computer Program for Conducting Equivalent Linear Seismic Response Analyses for Horizontally Layered Soil Deposits, EERI, Uni-versity of California, Berkeley, 1992.
19. SeismoSignal - A Computer Program for Signal Processing of Strong-motion Data, 2004, ver. 3.1.0, http://www.seismosoft.com.
20. Soil Mechanics and Seismic Studies of the Qeshm Island, Hormozgan Urban and Housing Organization, 2011, (In Farsi).
21. ASTM D1586-11, Standard Test Method for Standard Penetration Test (SPT) and Split-Barrel Sampling of Soils, ASTM International, West Conshohocken, PA, 2011.
22. ASTM D-4428 M-84, Standard Test Method for Crosshole Seismic Testing, ASTM, West Consho-hocken, PA, 1984.
23. Kashkuli, H.A., Nekoamal, M., and Heidarnejad, M., Investigation and Modeling of Buchir-Homeyran Plain, Hormozgan Province, Iran,
Middle-East Journal of Scientific Reserch, 7(6) 2011, pp. 924-930.
24. Report No. EERC 70-10., Soil Moduli and Damping Factors for Dynamic Response Ana-lysis, Earthquake Engineering Research Center, University of California, Berkeley, 1970.
25. Math Works Inc., The Student Edition of
MATLAB, User’s Guide, Version 4. Prentice
Hall, Englewood, Cliffs, New Jersey, 1995. 26. Kim, B. and Hashash, Y.M.A., Site Response
Analysis using Downhole Array Recordings during the March 2011 Tohoku-Oki Earthquake and the Effect of Long-duration Ground Motions.
Earthq Spectra, 29, 2013, pp. 37–54

![Figure 5. Modulus and Damping [24] for (a) Sand and (b) Clay](https://thumb-ap.123doks.com/thumbv2/123dok/3649360.1465290/6.595.98.513.91.229/figure-modulus-and-damping-for-sand-and-clay.webp)