Technical Note
METHODOLOGY OF SITE-SPECIFIC SEISMIC HAZARD
ANALYSIS FOR IMPORTANT CIVIL STRUCTURE
Masyhur Irsyam1, 2, Donny T. Dangkua1, Dyah Kusumastuti1, Engkon K. Kertapati3
1Faculty of Civil Engineering and Environmental, Institut Teknologi Bandung 2Owner Expert at Suramadu Bridge Project
3Geological Research and Development Center, Indonesia
Corresponding author: Masyhur Irsyam, Tel: +62-812 238 4873; Email: [email protected]
Note from the Editor
The Indonesian archipelago is one of the most active tectonic zones in the world. Therefore, to design an important (and dangerous) structure such as a nuclear power plan, knowledge of the seismicity of the site is very important. This could be achieved by doing a site-specific seismic hazard analysis. A site-specific seismic hazard analysis is required in the design state in order to determine the recommended seismic design criteria of the structure. A complete and thorough explanation of the methodology to do a site-specific seismic hazard analysis is presented in this Technical Note
INTRODUCTION
The Indonesian archipelago has several distinct features that make the region one of the most active tectonic zones in the world. Three tectonic plates converge in the region leading to complicated geolo-gical and tectonics mechanism. Moreover, as a result of the tectonic condition, the archipelago is highly decorated with volcanoes, along with their abundant volcanic activities.
Therefore, a site-specific seismic hazard analysis is required in the design of important civil structure
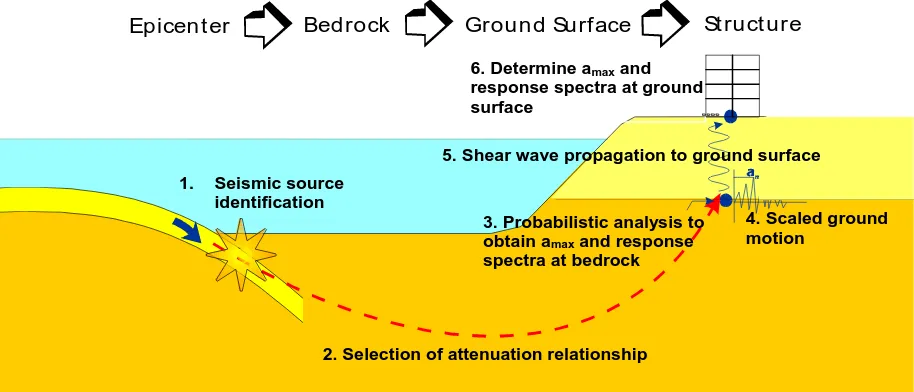
such as power plant, long-spanned bridge, hi-rise building, etc. (for example; PLTU Cilacap, LNG Storage Tank, PLTU 2 Banten–Labuan, Suramadu Cable-stayed Bridge). A thorough examination of the geological and seismological history is required along with the collection of the seismic secondary data. The seismic secondary data is then processed to minimize systematical error and to obtain reliable result of seismic hazard parameters. A probabilistic seismic hazard analysis (PSHA) and local site effect analysis are then performed to develop recommended site-specific response spectra. Generally, these proce-dures are illustrated in Figure 1.
2. Selection of attenuation relationship 3. Probabilistic analysis to obtain amax and response
spectra at bedrock 6. Determine amaxand
response spectra at ground surface
Epicent er Bedrock Ground Surface St ruct ure
1. Seismic source identification
4. Scaled ground motion
5. Shear wave propagation to ground surface
Figure 0. The procedures for Site-Specific Seismic Hazard Analysis
IDENTIFICATION AND EVALUATION
OF SEISMIC SOURCES
The site evaluation for engineering solutions should generally be available to mitigate, by mean of identifying certain design geological features, the potential of vibratory effects of earthquakes due to surface faulting, subsidence, ground collapsed or fault creep in any seismotectonic environment.
All possible seismic sources and their potential in generating future strong ground motion must be evaluated to perform seismic hazard analysis for a particular site or region. Identification and evaluation of seismic sources should be conducted on four scales [1] which are regional, near regional, site vicinity and site area. The first three scales of investigation lead primarily to progressively more detail geological and seismological data.
1. Regional: A regional scale investigation is conduc-ted to provide knowledge of the general geody-namic setting of the region and characterize those geological features that may influence or be related to the seismic hazard at the site consi-dered. The study area of this investigation typi-cally extends 150 km or more in radius.
2. Near regional: Typically the study area for near regional investigation is not less than 25 km in radius. This investigation is conducted to define
the seismotectonic characteristics of the near region and to determine the latest movements of faults. The tectonic history, such as geological age, should be very well defined for the current tectonic regime and also the field mapping should be used in the investigation [1].
3. Site vicinity investigation will cover a geogra-phical area typically 5 km in radius. The object of this investigation is to define in greater detail the neo-tectonic history of the faults, especially for determining the potential of surface faulting at the site which include the geomorphological mapping.
4. The site area investigation is aimed at developing the geotechnical data base.
Earthquake source zones in Indonesia can be classified into three different classifications; subduc-tion zone, transform fault and diffuse seismic zone, which are represented in Figure 2 by different patterns. In fact, all segments are seismically active, but only a few of them have experienced great earthquakes (Mw > 9.0) during the last two centuries.
DATA COLLECTION AND PROCESSING
Seismic hazard assessment at the site of interest requires all recorded historical earthquake events data, which occurred around that site for a specific
Subduction zone
Transform zone
Diffuse Seismicity Zone
Subduction zone
Transform zone
Diffuse Seismicity Zone
time period of observation. Historical earthquake events data could be compiled from many sources, such as: National Earthquake Information Center– United States Geological Survey (NEIC-USGS), Bureau of Meteorology and Geophysics (BMG)– Indonesia and several individual catalogues. All data from the earthquake catalog should be processed using statistical principles before being used for seismic risk analysis. These procedures are per-formed to minimize bias or systematical error, and to obtain reliable results. The procedures are as follows:
Analyzing the Dependency of Earthquake Events
The seismic risk analysis in PSHA method is typically based on the independent earthquake or main events. Dependent events, such as foreshocks and aftershocks, in a sequence of earthquake events have to be identified before the earthquake risk can be estimated. The inclusion of dependent events in the seismic risk analysis has been known to result in minor increase in the hazard estimation [3].
Several empirical criteria have been proposed by many researchers to identify the dependent events, such as Arabasz and Robinson [4], Gardner and Knopoff [4], Uhrhammer [6]. This criterion is used to identify an earthquake sequence that associated with fault rupture. This criterion is developed based on the temporal and spatial windows around the largest events of an earthquake. Only events lying in a zone approximately parallel to the fault rupture or surrounding the main events are considered as potential foreshocks or aftershocks. An earthquake can be identified as dependent events if it is flagged by the empirical criteria as shown in Figure 2.
Analyzing the Completeness of Earthquake Catalogues
Knowledge of the earthquake history and homo-geneity of the earthquake catalogue are key factors in the evaluation of recurrence interval and the evaluation of seismic hazard risk for a particular site. The historical earthquake records are usually more complete for large earthquakes than for small earthquakes due to seismograph station density, or in the early records, population density. The bias is usually more severe in successive earlier reporting periods. If the incomplete data is then utilized to obtain seismic risk parameters (a-b value) using formula such as Guttenberg-Richter law, the results will be inaccurate to represent true long-term recurrence rates. The parameters will be underesti-mated for small earthquakes and overestiunderesti-mated for the large ones.
Stepp [7] discussed the utilization of unequal obser-vation periods for various magnitudes and proposed a test for completeness of earthquake catalogue.
According to Stepp [7] the completeness periods for independent events of various magnitudes could be estimated by plotting the observed occurrence frequency of independent events in different magnitude intervals, as a function of time before the present date. The observed occurrence frequency can be defined as the number of events N recorded in the last T years divided by T. Since the seismic rate is assumed to be constant over long period of time, the time when the observed rate begin to decrease significantly, represents the date before which the catalogue can be considered incomplete.
1 10 100 1000 10000
1 2 3 4 5 6 7 8
Magnitude
T
im
e (d
a
ys)
Uhrhammer (1986) Gardner and Knopoff (1974) Arabasz and Robinson (1976)
1 10 100 1000 10000
1 2 3 4 5 6 7 8
Magnitude
D
is
ta
n
c
e (
k
m
)
Uhrhammer (1986) Gardner and Knopoff (1974) Wyss (1979)
Figure 2. Time and Distance Windows from Several Resear-chers to Identify Dependent Events [2]
SEISMOTECTONIC MODEL
models) consisting of a discrete set of seismogenic structures. Only seismic source zones within a radius of 500 km from the site are considered. Those outside this radius may not significantly influence the peak ground acceleration. An example of seismo-tectonic model is shown in Figure 4.
Figure 3. Example of Seismotectonic Model
SEISMIC HAZARD PARAMETERS
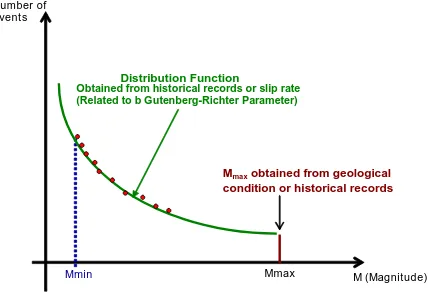
Characterization of an earthquake source requires consideration of the spatial characteristics of the source and the distribution of earthquakes within that source, the distribution of earthquake size of each source, and the distribution of earthquake with time. Each of these characteristics involves some degree of uncertainty. Characteristic of an earth-quake source can be represented by distribution function (Figure 4) which can be obtained using seismic hazard parameters such as; recurrence law, maximum magnitude and slip rate.
Number of Events
Mmax
Mmax obtained from geological condition or historical records
Mmin
Distribution Function Obtained from historical records or slip rate (Related to b Gutenberg-Richter Parameter)
M (Magnitude)
Figure 4. Distribution Functions Which Represent the Charac-teristic of an Earthquake Sources
Recurrence Law
The distribution of earthquake sizes in a given period of time is described by a recurrence law. A basic assumption of PSHA is that the recurrence law obtained from the past seismicity is appropriate for
the prediction of future seismicity. Temporal distri-bution of earthquakes is commonly assumed to follow frequency-magnitude relationship proposed by Gutenberg-Richter (G-R) [8]. The simplest method to obtain a-b value is the least square method (LS). The disadvantage of LS method is that it cannot be used directly to calculate the mean annual rate of exceedance from combining different completeness catalogs. This method usually produces overesti-mated b values so that the rate of large earthquakes is grossly underestimated.
Several researchers, such as Dong et al. [9], Bender [10], Weichert [11], Kijko and Sellevoll [12] have proposed alternative methods to obtain a-b values and to minimize such bias. These methods explained the relationship between earthquake data and interval time when the catalogs are homogeneous (completeness time). Some of those methods will be briefly described below.
a. Weichert [11]
This method is efficient and powerful to estimate seismic activity parameter, i.e. a and b, of a source zone having sufficient events data (around 40 or more) from which a stable a and b parameter can be obtained. In this method, b parameter is obtained iteratively by solving the proposed equation [11] using Newton method.
b. Kijko and Sellevoll [12]
This method is an extension of the maximum likelihood estimation of earthquake hazard para-meters to the case of mixed data containing large historical events and recent complete observations. The available earthquake catalogs usually contain two types of information: macroseismic observation of major seismic events that occurred over a period of a few hundred years, and complete instrumental data for relatively short periods of time. The common methods for the estimation of seismic activity parameters are not suitable for this type of data. Because of the incompleteness of the macroseismic part of a catalog or, more extremely, because of difficulties in estimating its growing incompleteness in the earlier times, the highly efficient methods of Weichert [11] or Dong et al. [9] are not always applicable.
In order to estimate parameter β and λ, the maxi-mum likelihood method is used from which general equation was obtained as follow:
C 1 E 1
1
φ
+
φ
=
λ
(1a)( )
(
C)
3 E 3 C 2 E 2
X
1
=
−
φ
−
φ
+
λ
φ
+
φ
β
(1b)∑
[X] is equal to the mean earthquake magnitude calculated from the extreme and complete parts of the catalog, n is the total number of earthquakes, ri = ni / n and
B1 = ((t)A2-(tA))/(A2-A1)
B2 = ((tX0A)-(t)mmaxA2)/(A2-A1)
Ci = 1-F(mi)
Di = E(mmin, mi)-E(mmin, mmax)F(mi),
E(x,y) = [xA(x)-yA(y)]/[A(x)-A2]
Maximum Magnitude and Slip Rate
Once an earthquake source is identified and its corresponding source zone characterized, the atten-tion is turned toward evaluaatten-tion of the sizes of earthquakes that the source zone can be expected to produce. All source zones have a maximum earth-quake magnitude which can be large for some source zones and small for others. In general, the source zone will produce earthquakes of different sizes up to the maximum magnitude, with smaller earthquake occurring more frequently than larger ones.
The maximum magnitude is estimated based on the evaluation of available data and tectonic of the region. Generally the methods for evaluating maxi-mum magnitude can be divided into two main categories, i.e. deterministic and probabilistic. The deterministic procedure most often applied based on the empirical relationships between the magnitude and various tectonic and fault parameters. The faults rupture length is the most commonly used parameter to estimate the maximum earthquake magnitude. The other deterministic method to obtain maximum magnitude is by using the histo-rical earthquake. It is assumed that the largest event has occurred and no other earthquake events are larger than that. These procedures identify a reasonable maximum magnitude for the given potential seismic source, and its most reasonable slip rate in the current tectonic environment.
Attenuation Relationship
In order to perform seismic hazard analysis for a site region, it is fundamental to determine attenuation relationship formula to use. This formula is a simple mathematical model that relates a ground motion
parameter (i.e. spectral acceleration, velocity and displacement) to earthquake source parameter (i.e. magnitude, source to site distance, mechanism) and local site condition. It is considered as one of the critical factors in seismic hazard analysis.
Most commonly used method to obtain the relation-ship is by using empirical method based on historical earthquake data. The relationships between earth-quake source parameters and ground motion para-meters are obtained statistically using several methods such as single or multiple regression analysis. This method requires a lot of data in order to obtain statistically reliable results. Therefore empirical method can only be developed in location where the strong motion recordings are abundant such as Western North America and Japan.
Since there is no attenuation function derived for Indonesia region as well as no adequate strong motions records to develop attenuation relationship, the only way is to use attenuation function consi-dered appropriate according to mechanism that likely to occur in Indonesia region. It should be noted that an attenuation function derived in a certain region may not be necessarily appropriate in other region although they are tectonically and geologically situated on the same region. For engineering practice, this procedure can be admitted, provided that the selection is conducted based on similarity of faulting mechanism between site region and that in which attenuation formula was derived.
It is imperative that the selection should be based on earthquake mechanism, which is generally catego-rized into subduction zone earthquake and shallow crustal earthquake. Using worldwide peak ground motion recording, several attenuation functions should be selected and compared statistically. Standard deviation is taken as a measure to quan-tify variability and indicate how fit an attenuation model to a set of database. Several attenuation relationships derived for subduction zone earth-quake and shallow crustal faults, which are com-monly used, are shown in Table 1.
Table 1 Several Attenuation Relationships for Sub Duction Zone and Shallow Crustal Faults [13]
Worldwide Attenuation Function Subduction Zone Shallow Crustal
SEISMIC HAZARD ANALYSIS
The seismic hazard analysis is conducted to evaluate the earthquake probability for the proposed location. The degree of ground shaking for dynamic analysis of an earthquake resistant structure should be determined from seismic hazard analysis. The degree of ground shaking is preferably expressed in the form of peak ground acceleration, uniform hazard spectra, and time histories. The expected ground acceleration for a particular site with specified mean return periods is to be determined through a seismic risk analysis procedure.
Probabilistic Model
The total probability theorem developed by McGuire [14] is based on the probability concept developed by Cornell [15], which assumed the earthquake magni-tude M and the hypocenter distance R as a conti-nuous independent random variable. The total probability theorem can be represented in the most basic form as follows,
∫ ∫ ≥
fM = density function of magnitude
fR = density function of hypocenter distance
P [I > i |M and R] = conditional probability of (random) intensity I exceeding value i at the site for a given earthquake magnitude M and hypocenter distance R.
The recent seismic hazards analysis procedure is performed using 3-Dimension model for earthquake source. Using 3-Dimension model, it is expected that the results of hazard analysis became more accurate. The sequence of seismic hazard calculations for 3-D fault sources model can then be represented by a modified form of previous equation as follows [16]:
[ ]
The number nM of earthquake having magnitude
equal or greater than M occurring at a particular site is assumed to conform to the relation below [8],
log10 nM = a – b M (4)
Where a and b are constants characteristic of the source area examined. Constant b described the relative distribution of small and large magnitude events, which larger value of b implies relatively fewer large shocks, and vice versa.
The annual total probability of earthquakes with intensity I equal or greater than i at a particular site is determined by totaling the probability of each source. It can be written in mathematical form as follows,
NA = the total annual earthquake
occur-rence with intensity I equal or greater than intensity i from all source zone. P[I ≥ i] = the risk of single event with intensity
I equal or greater than intensity i for one seismic source.
Nl (M ≥ mo) = the annual earthquake occurrence
with magnitude M equal or greater than magnitude m for one source zone.
The annual risk distribution of the earthquake is assumed of the Poisson Distribution, as follows,
RA = 1 – e(-NA) (6)
Logic Tree
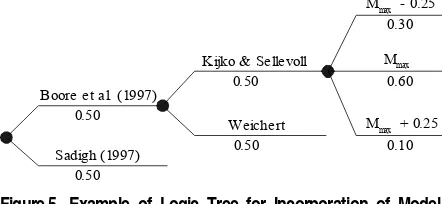
The probability computations described previously allow systematic consideration of uncertainty in the values of the parameters of a particular seismic hazard model. The use of logic trees [17, 18, 19] provides a convenient framework for the explicit treatment of model uncertainty. The logic tree approach allows the use of alternative models, each of which is assigned a weighting factor that is interpreted as the relative likelihood of that model being correct. An example of logic tree for the use of alternative models of attenuation relationship, recurrence rate and maximum magnitude is shown in the following figure.
Boore et al. (1997) 0.50
Sadigh (1997) 0.50
Kijko & Sellevoll 0.50
Figure 5. Example of Logic Tree for Incorporation of Model Uncertainty [20]
Figure 6. Hazard curve with the relative contributions from each source [21]
De-aggregation
The seismic hazard analysis procedures described in the preceding sections allow computation of the mean annual rate of exceedance at particular site based on the aggregate risk from potential earth-quakes of many different magnitudes occurring at many different source-site distances. Therefore, the rate of exceedance computed in a PSHA is not associated with any particular earthquake magni-tude or source-site distance. However, it is useful to estimate the most likely earthquake magnitude and the most likely source-site distance. These quantities is used to select existing ground motion records, which recorded in earthquakes of similar magnitude and at similar source-site distance, for response analysis. The de-aggregation process requires that the mean annual rate be expressed as a function of magnitude and distance (the controlling earthquake) for each source (Figure 7). The response spectra for the controlling earthquake events is then scaled to a certain period value and will be used as target spectra in the scaling of the historical recorded time histories.
Figure 7. De-aggregation hazard result for Jakarta [22]
Time Histories
Acceleration time-histories are required in the analysis of shear wave propagation in soil deposits. Selection of time-histories appropriate for specific geological and seismological conditions plays an important role for obtaining accurate results. There are several procedures that can be used to select the earthquake ground motions at bedrock. These procedures include: (1) utilization of motions pre-viously detected near the site; (2) utilization of motions previously recorded at other locations during similar size earthquake and at distance comparable to those under consideration; (3) esti-mation of a target spectrum and then generation of a synthetic time history whose spectral ordinates provide a reasonable envelope to those of the target spectrum. Procedure number (1) cannot be con-ducted in Indonesia because there are no strong motions recorded in Indonesia. Procedure number (2) can be conducted based on the controlling earth-quake from the de-aggregation result with specific magnitude and distance for each source and certain return periods. Scaled time histories are then generated based on recorded ground motion from previous historic earthquake event and estimated target spectrum at bedrock.
LOCAL SITE EFFECT
The characteristics of ground surface motions, i.e. peak acceleration amplitudes and shapes of response spectra, are strongly dependent on the local soil conditions. Therefore, a local site effect analysis should be conducted to evaluate the response of local soil condition that is caused by the motion of the bedrock immediately beneath it. Peak accelerations at the surfaces of soil deposits are slightly greater than peak accelerations on rock when these values are small, and somewhat the reverse at higher acceleration levels. At higher acceleration levels, the low stiffness and nonlinearity of soft soils often prevent them from developing peak ground accelera-tions as large as those observed on rock. Local site conditions also influence the frequency content of surface motions and hence the response spectra they produce.
The local soil effect analysis is carried out using 1-D shear wave propagation theory to obtain the estimate of ground motion parameter, i.e. surface spectral acceleration and time histories. The result of local site effect analysis using 1-D shear wave propagation analysis from bedrock to ground surface is the response spectra at ground surface.
DEVELOPMENT OF RECOMMENDED DESIGN SPECTRA
The objective of the criteria set for the analysis is to develop the seismic design spectra for each usage and performance of the structure. Conceptually, different performance targets means different safety requirements and relate to different failure con-ditions. Upon obtaining the PSHA result for the site for each level of risk considered, further study is required to derive the design tools needed by the structural engineers. The result of the PSHA will be used to develop recommendation values of ground accelerations and corresponding design spectra.
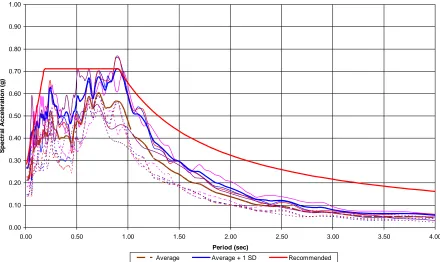
The computed surface spectral accelerations obtain-ned from local site effect analysis are use to develop recommended design spectra. Based on surface spectral accelerations, the average and average plus one standard deviation response spectral accelera-tion are calculated. The recommended site-specific response spectrum is then determined based on average plus one standard deviation spectral
accele-ration. Example of the recommended site-specific response spectra in the conventional and tripartite format are shown in the following figures.
1 10 100 1000 10000
0.01 0.1 1 10
Period (sec)
S
p
ectral
vel
o
c
it
y (
m
m
/sec)
Average + StDev
Average
Recommended
1 g
10 g
100 g
0.1 g
0.01 g
10 m m
10 0 mm
1000 mm
1 mm
0.1 m m
0.0 1 mm
Figure 9. Recommended Site-Specific Response Spectra in Conventional Format
0.00 0.10 0.20 0.30 0.40 0.50 0.60 0.70 0.80 0.90 1.00
0.00 0.50 1.00 1.50 2.00 2.50 3.00 3.50 4.00
Period (sec)
Sp
ec
tr
al
A
c
cel
erati
o
n (
g
)
Average Average + 1 SD Recommended
REFERENCES
1. International Atomic Energy Agency, 2002.
2. Firmansjah, J., Irsyam, M., Development of Seis-mic Hazard Map for Indonesia, Prosiding Konferensi Nasional Kegempaan, 1999, pp. I-29 – I-66.
3. Pacheco, J.P., Sykes, L.R., Seismic Moment Catalog of Large Shallow Earthquakes, 1900 to 1989, Bulletin of Seismological Society of America, Vol.82. No.3, 1992, pp.1306-1349.
4. Arabasz, W.J., Robinson, R., Microseismicity and Geologic Structure in the Northern South Island, New Zealand, New Zealand Journal of Geology and Geophysics, Vol. 19, No. 2, 1976.
5. Gardner, J.K., and Knopoff, L., Is the Sequence of Earthquakes in Southern California, with After-shocks removed, Poissonian, Bulletin of the Seis-mological Society of America, Vol. 64, No. 5, 1974, pp. 1363-1367.
6. Uhrhammer, R.A., Characteristics of Northern and Central California Seismicity (abs), Earth-quake Notes, Vol. 57, No. 1, 1986, pp.21.
7. Stepp, J.C., Analysis of the Completeness of the Earthquake Hazard Sample in the Puget Sound Area, NOAA Technical Report, ERL 267-ESL 30, Boulder, CO, May 1973, pp. 16-28.
8. Gutenberg, B., Richter, C. F., Seismicity of the Earth, Princeton University Press, Princeton, New Jersey, 1954.
9. Dong, W. M., Bao, A. B., Shah, H. C., Use of Maximum Entropy Principle in Earthquake Recurrence Relationship, Bulletin of the Seimo-logical Society of America, Vol. 74, No. 2, 1984, pp. 725-737.
10. Bender, B., Incorporating Acceleration Variability into Seismic Hazard Analysis, Bulletin of the Seismological Society of America, Vol. 74, No. 4, 1984, pp. 1451-1462.
11. Weichert, D.H., Estimation of the Earthquake Recurrence Parameters for Unequal Observation Periods for Different Magnitudes, Bulletin of Seismological Society of America, Vol. 70, No. 4, 1980.
12. Kijko, A., Sellevol, M.A., Estimation of Earth-quake Hazard Parameters from Incomplete Data Files Part II. Incorporation of Magnitude Hetero-geneity, Bulletin of Seismological Society of Ame-rica, Vol. 82, No. 1, 1992.
13. LAPI ITB, Development of Attenuation Model and Engineering Practice Level Acceptance Crite-ria, Report for ARCO Bali North Inc. Terang/ Sirasun Development, 2000.
14. McGuire, R. K., Evaluation of Sites for Earth-quake Risk, Open File Report 76-67, 1976
15. Cornell, C.A., Engineering Seismic Risk Analysis, Bulletin of the Seismological Society of America, Vol. 58, 1968, pp. 1583-1606
16. Risk Engineering Inc., EZ-FRISK version 7.20 Software for Earthquake Ground Motion Estima-tion, User’s Manual, 2006.
17. Power, M. S., Coppersmith, K. J., Youngs, R. R., Schwartz, D. P., Swan, R. H., Seismic Exposure Analysis for the WNP-2 and WNP-1/4 Site, Appendix 2.5K to Amendment No. 18 Final Safety Analysis Report for WNP-2, Woodward-Clyde Consultants, San Francisco, 1981, pp. 63.
18. Kulkarni, R. B., Youngs, R. R., Coppersmith, K. J., Assessment of Confidence Intervals for Results of Seismic Hazard Analysis, Proceedings 8th World Conference on Earthquake Engineering,
San Francisco, Vol. 1, 1984, pp. 263-270.
19. Coppersmith, K. J., Youngs, R. R., Capturing Uncertainty in Probabilistic Seismic Hazard Assessment with Intraplate Tectonic Environ-ments, Proceedings 3rd U. S. National Conference
on Earthquake Engineering, Charleston, South Carolina, Vol. 1, 1986, pp.301-312.
20. Irysam, M., Merati, W., Hendriyawan, Purwana, O. A., Seismic Risk Analysis and Microzonation Study for Jakarta, Proceeding International Conference on Advancement in Design, Construc-tion, Construction Management and Maintenance of Building Structures, 2002, pp. V-11 – V-21.
21. Kramer, S. L., Geotechnical Earthquake Engineer-ing, Prentice-Hall, 1996.
![Figure 1 Seismic source zone for Indonesia Region [2]](https://thumb-ap.123doks.com/thumbv2/123dok/3649784.1465374/2.595.69.525.411.739/figure-seismic-source-zone-indonesia-region.webp)
![Figure 2. Time and Distance Windows from Several Resear-chers to Identify Dependent Events [2]](https://thumb-ap.123doks.com/thumbv2/123dok/3649784.1465374/3.595.305.527.236.583/figure-time-distance-windows-resear-identify-dependent-events.webp)
![Table 1 Several Attenuation Relationships for Sub Duction Zone and Shallow Crustal Faults [13]](https://thumb-ap.123doks.com/thumbv2/123dok/3649784.1465374/5.595.307.526.634.767/table-attenuation-relationships-duction-zone-shallow-crustal-faults.webp)
![Figure 6. Hazard curve with the relative contributions from each source [21]](https://thumb-ap.123doks.com/thumbv2/123dok/3649784.1465374/7.595.70.290.602.756/figure-hazard-curve-relative-contributions-source.webp)