Vol. 18, No. 4, 2003, 323 - 340
HERDING BETWEEN INSTITUTIONAL AND
INDIVIDUAL INVESTORS: THE JAPANESE CASE
Mamduh M. Hanafi
Universitas Gadjah Mada
ABSTRACT
Artikel ini membandingkan perilaku herding antara investor institusional dengan investor individual menggunakan data Jepang. Artikel ini menemukan bahwa investor institusional melakukan herding lebih besar pada saham kecil. Artikel ini juga menemukan bahwa herding oleh investor institusional nampaknya tidak mempunyai efek negatif (destabilizing) dalam jangka pendek. Dalam jangka panjang, artikel ini menemukan pembalikan harga (reversal) untuk saham dimana investor institusional melakukan herding. Artikel ini menemukan bahwa saham yang dilepas investor institusional mempunyai reaksi harga yang negatif, nampaknya tindakan pelepasan tersebut didorong oleh motivasi yang rasional. Artikel ini juga menemukan bahwa perdagangan oleh investor institusional mempunyai pengaruh yang lebih besar terhadap harga; investor institusional nampaknya tidak melakukan perdagangan umpan balik positif (positive feedback trade). Saham yang mempunyai kepemilikan institusi paling stabil mempunyai kinerja yang paling baik.
Keywords: herding, Japan, efficient markets.
Herding behavior occurs when investors trading in the same direction, based on certain information, and probably by ignoring other relevant information. The phenomenon has been an interesting subject, and several issues related to this subject have been discussed, such as: wheter herding behavior occurs or not (Golec, 1997; Lakonshok et.al, 1991; Lakonishok et.al, 1992), the consequences of such behavior, that is wether it has destabilizing effect or not (Nofsinger and Sias, 1998; Choe et.al, 1990; Wermer, 1998; DeLong et.al, 1990), what drives the behavior (Graham, 1998; Lakonishok et.al, 1992). Herding behavior may have potential in explaining several financial phenomena, such as investment recommendation, IPO price behavior, and earning forecast. While institutional investors are more susceptible to commit herding behavior, individual investors may herd for different reasons.
This paper investigates herding behavior using Japanese data1. We find that institutional investors herd at a greater extent in small stocks, which is consistent with the finding in US (Nofsinger and Sias, 1998; Wermers, 1998). Herding by institutionals doesn’t seem to have destabilizing effect in the short run. But in the long run, stocks herded by institutional tend to reverse their performances. In the long run, stocks with the highest individual herding tend to perform better than stocks with the highest institutional herding. This result is in contrast with previous findings that stocks with the highest institutional herding perform better than those with the lowest institutional herding (Nofsinger and Sias, 1998). We find that herding away by
institutional investors serves as a negative signal, resulting in negative abnormal returns in post-herding years. In any case, stocks with the least herding by institutionals or individuals (that is stock with the most stable ownership changes) tend to perform better than stocks with the highest or the lowest herding by institutional investors. These results are robust to changing benchmark calculation for the expected return. The use of size, book value, and size and book value benchmark to calculate abnormal returns practically yields same conclusions.
We find that herding by institutional investors is associated with positive abnormal return at the herding year. This suggests that institutional investors engage in intra-year positive feedback trading, that is institutional investors buy the winners and sell the losers. An alternative interpretation is that trading activities by institutional investors have larger impact on prices, that is buy action drives prices up, while sell action drives prices down. We find that stocks with the highest institutional investors herding have the highest individual herding in the-post herding year. Similarly, stocks with the highest individual herding have the highest institutional herding in the-post herding year, while stocks with the most stable ownership changes tend to have stable ownership changes in the-post herding year. Performances of stocks with the highest or lowest herding in post-herding year seem to be associated with changes in the ownership in post herding year. Our analysis seems to confirm the assertion that institutional trading has larger impact on stock prices than individual trading, rather than institutional investors engage in positive feedback trading. We still could not find the answer on why the most stable stocks tend to perform better in the long run.
This paper is organized as follows: We discuss literature review in the first section, we present methodology and result in the second section and third section concludes.
HERDING BY INDIVIDUAL AND INSTITUTIONAL INVESTORS
Individual and institutional investors may herd for different reasons. Individual may herd because of fad or fashion (Shiller, 1984, DeLong, Shleifer, Summers, and Waldmann, 1990). Individual tend to be noise traders who are more susceptible to fad or fashion. Shleifer and Summers (1990) suggest that individual may herd by following same signals, such as brokerage house recommendation or forecasters, or place a greater emphasis on more recent information (overreact). Chopra et.al (1990), for example, conclude that individuals overreact. Lakonishok, Shleifer, and Vishny (1994) suggest that individual investors may engage in irrational positive feedback trading because they extrapolate past growth rates. Alternatively, Shefrin and Statman (1985) argue that individuals engage in negative feedback trading (buying losers, selling winners).
institutional investors than in reaching individual investors. Fourth, another agency problem may also force them to herd. Trading based on fundamentals may take long to pay off, while they are evaluated in the short-time interval. Herding strategy could be a vehicle to reach short-term profits.
Herding behavior, especially done by institutional investors, may destabilize stock prices, that is moves prices away from their fundamental values (Lakonishok, Shleifer, and Vishny, 1992). This happens because institutional investors trade in large amount and if herding occurs, then the effect of theirs trades will be much larger. But herding doesn’t necessarily always destabilize. If herding help move prices closer to their fundamental values, then herding increases market efficiency. Several papers conclude that herding increases market efficiency, rather destabilizes market (Wermer, 1998; Choe, Kho, and Stulz, 1998).
An example of destabilizing herding is positive feedback or trend chasing (DeLong et.al, 1990) which is a strategy of buying winners and selling losers. If institutional investors herd by ―jump on the bandwagon‖, prices will pushed higher until they become overpriced, while for sold stocks, prices will be pushed lower until they become under-priced. This action leads to more divergence between actual prices and their fundamental values.
Such positive feedback trading may also destabilize prices when it is used intentionally by rational speculators (DeLong et.al, 1990). Institutional investors may follow this strategy by intentionally and rationally move stock prices away from their fundamental values. When they buy winners, they expect that their action will induce follow-up traders who will trade tomorrow (positive feedback traders). This may stimulate other feedback traders, driving the prices up to the points where they are more than warranted by their fundamental values. At these points the rational investors reverse the trend by selling the stocks to the positive feedback traders. Several financial
professionals, such as Soros, acknowledge using this strategy to make profit. Soros, for example, claimed that in 1960’s conglomerate and 1970’s Real Estate Investment Trust boom, instead of short selling these stocks, which is a short-term strategy, he bought these stocks in anticipation of further buying (by uninformed traders). This action, together with the same action from other ―informed traders‖, excites uninformed investors to buy more stocks, and drives the prices up. Finally conglomerate and REIT stocks crashed while informed traders already disposed of their holdings.
This paper follows Nofsinger and Sias (1998) approach when they investigate herding between institutional and individual investors using US data2. We establish first that herding by institutional/individual investors exists by observing some kinds of parameter3. Then we investigate the characteristics and the consequences of this behavior, such as whether institutional investors engage in feedback trade, whether it has destabilizing effect, whether it concentrates on small stocks. Instead of using US data, we use Japanese data to investigate herding between institutional and individual investors. The Japanese market is an interesting market itself, since it is the second largest capital market in the world. Japanese market also has different trading mechanism, which make it interesting to test the result found in US market4. US market uses dealer system emphasizing market liquidity. In contrast, Tokyo Stock Exchange (TSE) uses an auction or order-driven system emphasizing an
2 This approach is different from some other papers about herding behavior, such as paper Lakonishok et.al. (1992) or Wermers (1998) which investigate whether herding behavior exists or not, or Graham (1998) who investigate what factors drive herding behavior. 3 Specifically, we investigate changes of institutional
ownership from year t-1 to year t to measure institutional herding. Then we investigate stocks with the highest, lowest, medium institutional ownership changes. The detail is explained in the next section. 4 See Chang, McLeavy, and Rhee (1995) for this
accurate assessment of supply and demand by requiring all orders to interact. Unlike NYSE, TSE maintains daily price limits for individual stocks in the range of about 6.67% to 30%. Institutional investor at TSE is not as significant as that at NYSE, where large block trading accounted for about one-half of NYSE reported volume. However, institutional influence at TSE is increasing steadily after the introduction of the Nikkei Stock Average (NSA) and TOPIX index futures on September 3, 1998, and the NSA and TOPIX index options on October 20, 1989.
DATA AND METHODOLOGY
We use Japan monthly return and financial statement data from 1975 to 1995. The data are provided by PACAP, The University of Rhode Island. We calculate institutional ownership percentage (InsOwn) at year t as follows:
Number of shares owned by InsOwn (t) = institutional investors (t)
Total number of shares (t) Then we calculate changes in institutional ownership (InsChg) at year t as follows:
InsChg (t) =[InsOwn (t) – InsOwn (t-1)) / InsOwn (t-1)] x 100% We interpret InsChg as an indication of herding behavior by institutional investors. The higher InsChg then the higher herding behavior by institutional investors. Since InsOwn is a proportion of shares owned by institutional investors over total shares, an increase in InsOwn will automatically decreases the proportion of shares hold by individual investors over total shares. Hence, we interpret that the lower InsChg is an indication of herding behavior by individual investors5. There are several cautions to the
5 This procedure is somewhat different from Nofsinger and Sias (1998). They calculate Changes of Institutional Ownership as Changes in stock (j) subtracted by mean of changes of stocks at the same period. Our preliminary result shows that using their procedure
procedure presented here. Instead of herding by institutional investors, few institutional investors (one or two) may take large positions in certain stocks, resulting in positive institutional ownership changes. Another interpretation is that individual investors may herd away from the stocks while institutional investors do not herd.
From 1976, we form institutional ownership (InsOwn) quintiles with quintile 1 as the highest and quintile 5 as the lowest. For each institutional ownership quintile, we form institutional ownership change (InsChg) quintiles with quintile 1 as the highest institutional ownership change and quintile 5 as the lowest institutional ownership change. We re-aggregate ownership changes from each institutional ownership quintile. Thus, we re-aggregate InsChg quintile 1 from each institutional ownership (InsOwn) quintile. Similarly we perform similar procedure for InsChg quintile 2, 3, 4, and 5. Finally we have five groups of institutional ownership changes. Since stocks with larger institutional ownership tend to have larger institutional ownership changes, this procedure controls the level of institutional ownership in calculating institutional ownership changes. We repeat this procedure until the data reach year 1995 (the latest data in PACAP database).
For each herding year, we calculate necessary statistics such as percentage of institutional Ownership for each quintile, changes in institutional ownership, size, and book to market ratio. Then we track performances of these stocks until three years after herding year. To investigate whether investors engage in positive or negative feedback trading, we also track the stocks up to three years before herding year. We use equal weighty in calculating portfolio return6. We repeat this procedure until PACAP data reach
1995, which is the latest data available from PACAP.
HERDING BEHAVIOR
Table 1 presents the statistics of herding behavior7. Since our methodology is designed to detect institutional ownership changes while holding level of institutional ownership constant across quintiles, we have similar level of institutional ownership of about 67% across quintiles. This number is somewhat larger than that reported by Nofsinger and Sias (1998) for
US data. They report the average of about 36% for all deciles of institutional ownership changes. Institutional ownership changes among five quintiles are significantly different, which is what we expect given our sampling design. Stocks in InsChg quintile 1 have about positive 12% changes, while for stocks in InsChg quintile 5 have about negative 6% changes. F-test for this variable shows that institutional ownership changes are significantly different among the five InsChg quintiles.
Table 1 Statistics of Herding Behavior at Herding Year
From 1976 to 1995, we form institutional ownership changes quintiles. Details of the procedure are explained in the text. Size is the number of shares times price at the end of the year. Book value is calculated as book value stockholder’s equity divided by market value of the stock at the end of the year. We have 19 herding years and we calculate statistics for every herding year. This table presents the average values of these 19 herding years for every variable presented here. T statistics is in parentheses. It is calculated as [Mean/ (standard deviation/ square root of N)], where N is 19. F-test is used to test whether there are differences among institutional ownership changes quintiles. Statistical test is based on null hypotheses that the value is zero. *, **, and *** mean significant at 10%, 5%, and 1%.67
Institutional Ownership Changes Quintiles
Q1
(The Highest) Q2 Q3 Q4
Q5
(The Lowest) F-values
Percentage of Institutional Ownership Changes (%)
11.849 *** (9.187)
2.986 ***
(6.936)
0.612 ***
(2.774)
-1.144 ***
(-6.537)
-5.648 *** (-19.041)
104.11***
Institutional Ownership (%)
67.811 *** (49.855)
68.357 ***
(49.478)
68.443 ***
(52.687)
68.451 ***
(52.639)
67.674 *** (52.240)
0.08
In (Book Value) -7.912 ***
(-128.534)
-7.788 ***
(-111.006)
-7.732 ***
(-105.061)
-7.712 ***
(-114.444)
-7.761 *** (-133.162)
1.41
In (Size) 17.431 ***
(115.559)
17.492 ***
(93.047)
17.205 ***
(85.517)
17.130 ***
(92.932)
17.232 *** (112.079)
0.77
6 Fama (1997) points out that size is an important anomaly that could explain several financial phenomena, such as long run underperformance of IPO or SEO. Brav and Gompers (1996), using value weighted portfolio, shows that long-term underperformances of IPO and SEO documented by Ritter (1991) and Spess and Affleck-Graves decrease substantially. However this paper find that equally and value weighted calculation yield same conclusions. We present only results from equally weighted calculation.
7
Institutional seems to prefer larger companies. The mean size of stocks in InsChg quintile 1 is about 37 million yen, which is larger than the size of the stocks in InsChg quintile 5. But F-test doesn’t show significant size difference among five institutional changes quintiles. Observation of Book Value shows that institutional investors seem to prefer stocks with smaller B/V ratio which can also be interpreted that they prefer undervalued stocks, but the difference for B/V ratio among five InsChg quintiles is not significant. The results in table 1 are somewhat different from Nofsinger and Sias (1999) finding. They report significant differences among institutional ownership change deciles for size and
institutional ownership changes, while we only report significant difference for institutional ownership changes.
Previous papers show that herding tend to exist at a greater extent in small stocks (Nofsinger and Sias, 1998, Wermers, 1999, Lakonishok et.al, 1992). We want to investigate whether institutional investors are attracted to certain stock’s characteristic, that is size in this case8. While observation from table 1 doesn’t seem to support this assertion, we want to investigate this issue further. We provide another look at this issue by partitioning herding behavior based on size quintiles. Table 2 summarizes the result.
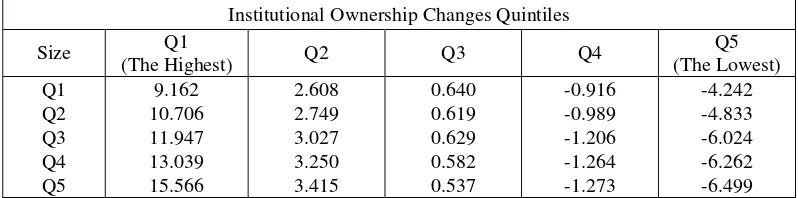
Table 2 Herding Behavior Partitioned By Size
From 1976 to 1995, we form institutional ownership changes quintiles. Details of the procedure are explained in the text. Size is the number of shares times prices at the end of the year. We have 19 herding years and we calculate statistics for every herding year. This table presents the average values of these 19 herding years for every variable presented here. All numbers are in percentages.
Institutional Ownership Changes Quintiles
Size Q1
(The Highest) Q2 Q3 Q4
Q5 (The Lowest)
Q1 9.162 2.608 0.640 -0.916 -4.242
Q2 10.706 2.749 0.619 -0.989 -4.833
Q3 11.947 3.027 0.629 -1.206 -6.024
Q4 13.039 3.250 0.582 -1.264 -6.262
Q5 15.566 3.415 0.537 -1.273 -6.499
The horizontal lines in table 2 show institutional ownership changes from the highest to the lowest, while the vertical lines show size from the largest to the smallest. In every institutional ownership changes quintile, there seems a monotonic increase of herding by institutional investors (using absolute value) from the smallest stocks to the largest stocks. For example, in InsChg quintile 1, the largest stocks experience institutional ownership changes of about 9%, and this number increases monotically to about 16% for InsChg quintile 5. In InsChg quintile 5, the largest stocks experience negative institutional
PERFORMANCE OF HERDING BEHAVIOR8
As discussed by previous literature, herding may have destabilizing potential. Given herding behavior established in this paper, we want to find the effect of this behavior on stocks’ performances in the post-herding period. If herding behavior is motivated by irrational reason, we will expect a price reversal for the stock investor herd. But if rational reason drives the herding or if herding is motivated by certain information, then we may expect that price change is permanent. To investigate this issue, we follow stocks’ abnormal performances up to three years after herding year. To check the robustness of our conclusion, we use three different benchmarks to calculate abnormal return: size, book value, and size and book value. Size adjusted abnormal return is calculated by subtracting equally weighted mean of return of size quintile from associated stock return. Thus, for stock return in size quintile 1 at month t, we subtract it by return of size quintile 1 at month t. We calculate the size of each company and form quintiles at one year before herding year. We calculate abnormal returns until third year after herding years. Book value adjusted abnormal return is calculated in similar way. Size and book value adjusted return is calculated as follows. First we form size quintile using size at one year before herding year. For each size quintile, we form book value quintile using book value at one year before herding year. Then we aggregate book value quintile in each size quintile. At the end, we have five size and book value quintiles. Then we calculate equally weighted mean for
8 Other possible stock characteristics that may attract institutional investors are performance in the previous period (either they engage in feedback trade), book-value, and some other characteristics such as industry. For example, when studying herding in mutual fund, Wermers (1998) finds that level of herding tends to be higher in growth-oriented funds. Since the level of uncertainty in growth stocks -such as small or technology stocks- tends to be higher, this result makes sense. Thus industry may be a factor in driving herding behavior.
stocks in each size and book value quintile at month t until three years after herding year.
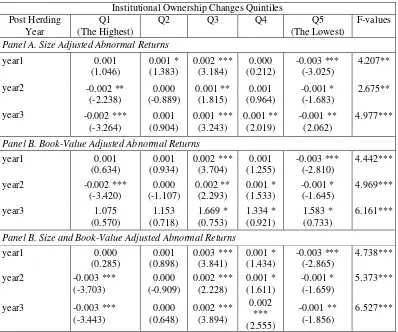
Table 3 presents the results. Panel A, B, and C present size, book-value, and size and book-value adjusted abnormal returns. In the first year after herding year, using size as the benchmark, stocks in InsChg quintile 1 have average return of 0.1% per-month, but this number is not significant at 10% (t-value is only 1.04). Stocks in InsChg quintile 5 have an average return of –0.2% and significantly different from 0 at 1%. Theses numbers suggest that herding by institutional investors seems to signal bad information, resulting in negative abnormal return in the first year. The least herded stocks (InsChg 3) have positive average abnormal return of about 0.18% and it is significantly different from 0 at 1% significance level. This pattern seems to suggest that stocks herded the least perform better than stocks herded either by institutional or individuals.
InsChg 5. Our results seem to be robust using different benchmarks to calculate abnormal returns.
There seems a reversal pattern in the stocks herded most by institutional investors, while stocks herded most by individual –or herded away by institutional investors—continue to experience negative abnormal returns until the third year after herding year. This pattern seems to suggest that herding by institutional investors has a destabilizing effect in the long run, as evidence by a reversal in the abnormal return pattern in the post herding year. While sell action by institutional investors seems to help increase efficiency although the market seems to underreact to this signal9. For InsChg 5, we still find significant abnormal returns for first, second, and third year post herding year. Our result for institutional herding in the first year seems to be consistent with Nofsinger and Sias (1998), Wermers (1998) and Choe et.al (1998). Our result for the second and third year is not consistent with them10. In either case, the strong performance for stocks in the least herded quintile is not consistent with any previous paper.
9 The post-herding period covered in this paper is longer than that of Nofsinger and Sias (1998). One of the concern for shorter post-herding period is that we may not be able to detect any reversal since the period is too short. We are able to find a reversal for stocks herded most by institutional investors, but we are unable to detect a reversal for stocks herded the least by institutional investors. It is either a permanent continuation or we fail to detect because of short period. We should be cautious with this problem, but since the period on this paper is longer than several studies (Nofsinger and Sias, 1998; Wermers, 1998) we assume that permanent changes indeed exist in our sample. 10 Examination of table VI and VII of Wermers (1998)
paper shows that stocks that mutual fund buy the most (heavy buying) tend to reverse in third and fourth quarters, while stocks mutual fund sell the most (heavy selling) continue to experience negative abnormal returns in the third and fourth quarters. But he doesn’t discuss this issue further. Instead he stops the discussion at six months after herding quarter. Our result here is very similar to Wermers (1998) finding, except for stocks in institutional ownership change quintile 3, where we find that these stocks tend to perform better than any other stocks.
To check the robustness of our finding here, we calculate abnormal returns using Fama and French (1992) procedure with little adjustment. Specifically we run the following regression model:
Rit - Rft = a + a1(D1) + a2(D2) + a3(D3) +
a4(D4) + B1(Rmt – Rft) +
B2(Rszt) + B3(RBVt) + eit ...(1)
Where
Rit = return of stock I at month t
Rft = risk free returns at month t11
D1 = 1 if the stock is in InsChg quintile 2, otherwise D1 = 0
D2 = 1 if the stock is in InsChg quintile 3, otherwise D2 = 0
D3 = 1 if the stock is in InsChg quintile 4, otherwise D3 = 0
D4 = 1 if the stock is in InsChg quintile 5, otherwise D4 = 0
Rmt = value weighted market return at
month t
Rszt = return of the smallest size quintile
minus return of the largest size quintile at month t
RBVt = return of the highest book value
quintile minus return of the lowest book value quintile at month t Eit = random error
The equation (1) above is a slight modification of Fama and French (1992) model. We introduce dummy variables to accommodate possible differences in abnormal returns among different InsChg quintiles. For stocks in InsChg quintile 1, the abnormal return is measured by a, which can be interpreted as Jensen alpha. For stocks in InsChg quintile 2, the abnormal returns are
measured by a + a1 (1). Similarly for stocks in InsChg 5, the abnormal returns are measured by a + a4 (1). Significant a1, a2, a3, or a4 coefficients or any one of them suggest that
abnormal returns are different among InsChg quintiles. Table 4 presents the result of the regression.
Table 3 Mean of Stock Abnormal Returns in Post Herding Year
From 1976 to 1995, we form institutional ownership changes quintiles. Details of the procedure are explained in the text. Size is the number of shares times price at the end of the year. Book value is calculated as book value stockholder’s equity divided by market value of the stock at the end of the year. We have 19 herding years and we calculate statistics for every herding year. This table presents the average values of these 19 herding years for abnormal returns. T-statistics is in parenthesis. It is calculated as [Mean/ (standard deviation/ square root of N)], where N is 19. F-test is used to test whether there are differences among institutional ownership changes quintiles. Statistical test is based on null hypotheses that the value is zero. *, **, and *** mean significant at 10%, 5%, and 1%. Size, Book-Value, and Size and Size and Book-Value benchmark calculation is explained in the text.
Institutional Ownership Changes Quintiles Post Herding
Panel A. Size Adjusted Abnormal Returns
year1 0.001
Panel B. Book-Value Adjusted Abnormal Returns
year1 0.001
Panel B. Size and Book-Value Adjusted Abnormal Returns
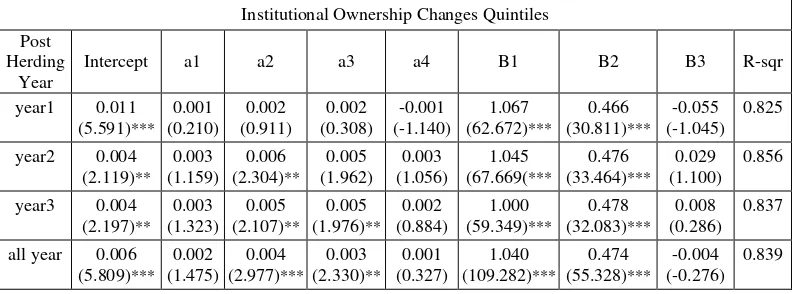
Table 4. Stock Abnormal Returns in Post Herding Year (Fama and French Procedure)
This table presents regression coefficients of the following model: Rit– Rft = a + a1(D1) + a2(D2)
+ a3(D3) + a4(D4) + B1 (Rmt – Rft) + B2 (Rszt) + B3 (RBVt) + et, where subscript t refers to month t, subscript I refers to stock I, and all variables are defined in the text. D1=1 if the stock is in InsChg quintile 2, D2=1 if the stock is in InsChg quintil 3, D3=1 if thestock is in InsChg quintile 4, and D4=1 if the stock is in Inschg quintile 5. A, a1, a2, a3, and a4, hence measure abnormal returns similar to Jensen alpha. The data are pooled time-series for stock I and for month starting from one month to 36 months after herding year, depending on the time period in consideration. *, **, and *** mean significant at 10%, 5%, and 1%.
Institutional Ownership Changes Quintiles Post herding years. In general the result support the conclusion before. We find that the intercepts are positive significant at either 5% or 1%. We are more interested whether we can find significant coefficients for a1, a2, a3, and a4. In the first year, we do not find significant coefficients for a1, a2, a3, or a4, suggesting that there are not any significant differences for abnormal returns among different InsChg quintiles. The sign of a4 coefficient is insignificantly negative, suggesting that in the first year, stocks in InsChg 5 slightly underperform stocks in InsChg1. In the third year, we have positive insignificant a4 coefficient, suggesting that stocks in InsChg 5 slightly outperform stocks in InsChg 1. Among InsChg quintile, quintile 3 has the best confirms this conclusion. In every regression, coefficient a2 is always equal or larger than any other coefficient. This result supports the finding in the previous section.
Table 5 Post Herding Performances Partitioned By Institutional Ownership Changes and Size (Size Adjusted Abnormal Return)
From 1976 to 1995, we form institutional ownership changes quintiles and Size quintiles. Details of the procedure are explained in the text. Size is the number of shares times price at the en of the year. Then we track performances of the stocks in each Institutional Ownership Change and Size quintile in the post herding year. We have 19 herding years and we calculate statistics for every herding year. This table presents the average values of these 19 herding years for abnormal returns. T-statistics is in parenthesis. It is calculated as [Mean/ (standard deviation/ square root of N)], where N is 19. F-test is used to test whether there are differences among institutional ownership changes quintiles. Statistical test is based on null hypotheses that the value is zero. *, **, and *** mean significant at 10%, 5%, 1%. Size, Book-Value, and Size and Size and Book-Value benchmark calculation is explained in the text.
It is difficult to discern any pattern that relates to the size effect. In the first year, institutional ownership changes have a stronger effect that size. Looking at institutio-nal changes quintiles, Q1 has better abnormal return compared to Q5, but Q3 has better performance than either Q1 or Q5. This result is consistent with the previous result without controlling size. For InsChg Q3, we find the size effect, that is smaller stocks earn better abnormal return compare to larger stocks. In the second and third year, the pattern becomes less clear. We do not find size effect for the least herded stocks (InsChg quintile 3). We still have the same pattern regarding institu-tional ownership changes quintiles, that is the least herded stocks perform better than either Q1 or Q5. In general we do not find the size effect after partitioning the sample into size and institutional ownership changes quintiles.
FEEDBACK TRADING BEHAVIOR
Given the existence of herding behavior, we want to investigate whether institutional/ individual investors engage in positive or negative feedback trading. Investors engage in positive feedback trade if they buy winners and sell losers. Alternatively, investor may engage in negative feedback trade where they buy losers and sell winners. Positive feedback has destabilizing potential as explained by DeLong et.al (1990). From the previous section we find that herding by institutional investors has destabilizing effect in the long-term. We want to investigate whether feedback trade helps contribute the destabilizing effect of institutional herding.
Table 6 presents size adjusted abnormal returns in pre herding period up to three years before herding year, including three months before herding year and herding year.
Compared to institutional investors, individual investors seem to buy the winners at a greater extent that institutional investors. Average abnormal return in one year before herding year for InsChg quintile 5 is 0.3% per-month, while for InsChg quintile 1, the number
is 0.08%, but this number is not significantly different from 0 at 10%. The pattern becomes clearer when we investigate further into two and three years before herding year. For these two years, InsChg quintile 5 has average abnormal return positive and significant at 1%, while for InsChg quintile 1, the average abnormal return is significantly negative. This result seems to suggest that individual investors engage in positive feedback trading, while institutional investors seem to engage in negative feedback trading. We do not seem to find that institutional investors engage in positive feedback trade. If any, the data seem to show that individual engage in positive feedback trade.
Table 6 Mean of Abnormal Returns During and at Pre-Herding Year
From 1976 to 1995, we form institutional ownership changes quintiles. Details of the procedure are explained in the text. Size is the number of shares times price at the end of the year. Book value is calculated as book value stockholder’s equity divided by market value of the stock at the end of the year. We have 19 herding years for abnormal returns. T-statistics is in parenthesis. It is calculated as [Mean/ (standard deviation/ square root of N)], where N is 19. F-test is used to test whether there are differences among institutional ownership changes quintiles. Statistical test is based on null hypotheses that the value is zero. *, **, and *** mean significant at 10%, 5%, and 1%. Size, Book-Value, and Size and Size and Book-Value benchmark calculation is explained in the text.
Institutional Ownership Changes Quintiles
Pre Herding Year
Q1
(The Highest) Q2 Q3 Q4
Q5
(The Lowest) F-values
Panel A. Size Adjusted Abnormal Returns
Herding Year 0.01398 ***
Panel B. Book-Value Adjusted Abnormal Returns
Herding Year 0.01406 ***
Panel B. Size and Book-Value Adjusted Abnormal Returns
We want to investigate this issue further by investigating abnormal returns in three months before herding year. Assuming that buying or selling actions by institutional investors do not take instantly12, if institutional investors engage in positive feedback herding, then we expect to observe similar patterns of abnormal returns among InsChg quintiles – that is positive abnormal returns for InsChg quintile 1 and decrease monotically to InsChg quintile 5—for the months before herding year, while institutional ownership changes in the three months before herding year do not show similar patterns to the changes in the three months before herding year do not show similar patterns to the changes in herding year. Otherwise, if institutional herding impact prices, then we expect that we have a positive association between institutional ownership change and abnormal returns. The pattern doesn’t have to be the same as that in herding year, --that is monotonic positive association between institutional ownership changes and abnormal returns--.
In table 6, for the panel of three months before herding year, we find that stocks in InsChg in quintile 1 show significant positive abnormal returns, but unlike those in herding year, the numbers do not decrease monotically when we move to smaller InsChg quintile. The lowest InsChg quintile show positive insignificant abnormal returns, while InsChg quintile 3 and 4 show negative significant abnormal returns. This result doesn’t seem to support the assertion that institutional investors engage in positive feedback trading. We investigate institutional ownership changes at three months before herding year, we find that the changes are in line with the direction of abnormal returns (see table 7).
12 This assumption seems to be plausible since previous studies indicates this possibility. For example, Chan, Jegadeesh, and Lakonishok (1996) suggest that momentum effect is caused by delayed reaction to information in the past and earning.
In first line of table 7 Panel B, we find that InsChg quintile 1 has the largest abnormal return and InsChg quintile 3 and 4 have the lowest abnormal returns. This result is consistent with institutional ownership changes found in table 6. Thus the result seems to support more strongly the interpretation that institutional ownership trading has larger impact on prices than individual trading, not the interpretation that institutional investors engage in positive feedback trading. We return to this discussion in the next section.
DOES INSTITUTIONAL HERDING
INVITES OFFSETTING POSITION?
DeLong et.al (1990) explain destabilizing effect of positive feedback behavior. Institutional may rationally destabilize the market to make profit. In one scenario, the buying from informed investors excites and induces uninformed investors to buy the stocks. This action pushes the prices up, more than warranted by stock’s’ fundamental and creates a bubble. At this point, informed investors sell the stocks to uninformed investors, while stocks start to reverse to their original prices or crash while informed investors already dispose of their holdings.
Table 7 Institutional Ownership and Institutional Ownership Changes at Pre and Post-Herding Year
From 1976 to 1995, we form institutional ownership changes quintiles. Details of the procedure are explained in the text. We have 19 herding years and we calculates statistics for every herding year. This table presents the average value of Institutional Ownership and Institutional Ownership Changes for these 19 herding years in the post herding year. T-statistics is in parenthesis. It is calculated as [Mean/ (standard deviation/ square root of N)], where N is 19. F-test is used to test whether there are differences among institutional ownership changes quintiles. Statistical test is based on null hypotheses that the value is zero. *, **, and *** mean significant at 10%, 5%, and 1%. Panel C provides regression coefficients for the model: InsChg ij = a + B (trend ij) + eij, where
InsChg and trend are defined in the text.
Institutional Ownership Changes Quintiles
Period Q1
(The Highest) Q2 Q3 Q4
Q5
(The Lowest) F-values
Panel A. Institutional Ownership (%)
3 months before 62.7291 ***
Panel B. Institutional Ownership Changes (%)
3 months before 3.103 ***
Panel C. Regression Coefficients
Coefficient -4.058 ***
(-7.449) quintile 1 is significantly less than the number of changes in the herding year (from about 12% in the herding year to about 2% in the first year of post-herding year). While for InsChg quintile 5, institutional ownership increase from about –6% in the herding year to about 1% in the first year of post-herding year.
quintile 5, this pattern continues until three years after herding year.
This pattern seems to indirectly support DeLong et.al (1990) implication. To test more formally whether there is an upward or downward trend in the post herding year, we run a simple regression. We introduce a new variable called trend with the value of 1 if it is herding year, 2 if it is the first year after herding year, 3 if it is the second year after herding year, and 4 if it is the third year after herding year. This variable is intended to capture the time. Then we run the following regression model:
InsChgij = a + B1 (trendij) + eij (2)
Where
InsChgij = institutional ownership changes
for stock I at year j
Trendij = trend for stock I at year j, the
value is either 1, 2, 3, or 4 eij = error term
Since we stack up companies in the herding year, first, second, and third year after herding year, we have pooled time series data. We run model (2) for each of InsChg quintile and for each herding year. Since we have 19 herding year, we have 19 B1 coefficient for each herding year. Since we have 19 herding year, we have 19 B1 coefficient for each InsChg quintile. Then we calculate average of these coefficient, which is similar to Fama and McBeth (1973) procedure. Panel B shows means of regression coefficients for each of InsChg quintile.
The signs of the coefficient are in the direction we expect. For the most herded stock, the coefficient is –4.06 and statistically significant at 1% significance level (t-value is –7.448). While for the least herded stocks by institutional investors, the coefficient is 2.57 and statistically significant at 1% level (t-value is 9.087). We find monotonic shift for B1 coefficient from the largest negative coefficient for InsChg quintile 1, and gradually
increases to the largest positive coefficient for InsChg quintile 5. This result suggests quite strongly that herding by institutional (individual) is offset by herding by individual (institutional) in the post-herding period. This result is consistent with the implication of DeLong et.al (1990) positive feedback trading model. We should remain cautious since we have only three years post-herding period. Positive feedback trade may last more than three years. More importantly the test in this section is not a direct test for positive feedback trading. We want to see the implication of DeLong et.al (1990) model. At best, the result of this section may give indirect evidence to support the implication of positive feedback trading of DeLong et.al (1990).
highest or lowest institutional ownership changes13.
CONCLUSION
We investigate the characteristics and consequences of herding behavior using Japanese data. We define herding by institutional investors as positive changes in institutional ownership in certain period. We contrast stocks that institutional investors herd to and stocks that institutional investors her away. We find that institutional investors tend to herd at a greater extent in small stocks. We find that in the short-term, herding by institutional investors do not have destabilizing effect, while herding away (that is selling action) provides negative signal to the market. But in the long run, stocks herded by institutional investors tend to experience a reversal. While stocks herded away most by institutional investors tend to experience negative abnormal return continuation in the long run. It seems that herding away by institutional investors is motivated in a manner to increase market efficiency. We find that institutional trading tends to have greater impact on stock prices, and institutional investors do not seem to engage in positive feedback trade. Given greater impact of institutional trading on stock prices, one thing remains puzzling: stock with the least institutional herding tend to perform better than either stocks with the highest and the lowest institutional herding. We leave this issue for further study.
13 In unreported result, we investigate whether keiretsu has explanatory power on this issue. Japanese corporate governance is unique since there are two corporate governance systems: keiretsu and non-keiretsu. We partition the sample into two groups: companies with keiretsu association and independent companies. Then we repeat our analysis here. We find practically similar result to the one reported here. Keiretsu doesn’t seem to explain this puzzle.
REFERENCES
Brav, Alan, and Paul A. Gompers, 1996, Myth
or Reality? The Long Run
Underperformance of Initial Public Offerings: Evidence from Venture and Non-Venture Capital Backed Companies, Working Papers, University of Chicago. Chan, Louis K.C. and Josef Lakonishok, 1993,
Institutional Trades and Intraday Stock Price Behavior, Journal of Financial Economics 33, pp. 173-199.
Chang, Rosita, D.W. McLeavey, and S. Ghon Rhee, Short-term Abnormal Returns of The Contrarian Strategy in The Japanese Stock Market, 1995, Journal of Business Finance & Accounting 22(7), pp. 1035-1048.
Choe, Hyuk, Bong_Chan Kho, and Rene M Stulz, 1998, Do Foreign Investors Destabilize Stock Markets? The Korean Experience in 1997, Working Papers, Ohio State University.
DeLong, J. Bradford, Andrei Shleifer, Lawrence H. Summers, and Robert J. Walmann, 1990, Positive Feedback Investment Strategies and Destabilizing Rational Speculators, Journal of Finance 45, pp. 379-395.
Fama, Eugene F, 1997, Market Efficiency, Long Term Return, and Behavioral Finance, Working Papers, University of Chicago.
Golec, Joseph, 1997, Herding on Noise: The Case of Johnson Redbook’s Weekly Retail Sales Data, Journal of Financial and Quantitative Analysis 32, pp. 367-381. Graham, John R., 1998, Herding Among
Investment Newsletters: Theory and Evidence, Journal of Finance, forthcoming.
Behavior, American Economic Review 85, pp. 1088-1105.
Lakonishok, Josef, Andrei Shleifer, Richard H. Thaler, and Robert W. Vishny, 1991, Window Dressing by Pension Manager, American Economic Review Papers and Proceedings 81, pp. 227-231.
Lakonishok, Josef, Andrei Shleifer, and Robert W. Vishny, 1992, The Impact of Institutional Trading on Stock Prices,
Journal of Financial Economics 32, pp. 23-43.
Nofsinger, John R. and Richard W. Sias, 1998, Herding and Feedback Trading by Institutional and Individual Investors, Working Papers, Marquette University. Wermers, Russ, 1998, Mutual Fund Herding