HPLC Fingerprint Analysis Combined with Chemometrics for Authentication
of
Kaempferia galanga
from Related Species
Cahya Septyanti
1, Irmanida Batubara
1,2,*, and Mohamad Rafi
1 1Department of Chemistry, Faculty of Mathematic and Natural Sciences, Bogor Agricultural University Darmaga Campus, Kimia Building, Tanjung Street, Bogor 16680, Indonesia
2
Biopharmaca Research Center-Research and Community Empowerment Institute Bogor Agricultural University, Bogor 16128, Indonesia
Received December 15, 2015; Accepted May 24, 2016
ABSTRACT
Fingerprint analysis using high performance liquid chromatography (HPLC) has been developed for authentication of Kaempferia galanga from related species, such as Kaempferia pandurata and K. rotunda. By comparing the fingerprint chromatograms ofK. galanga, K. pandurataandK. rotunda, we could identifyK. galanga samples and detect adulteration of K. galangafrom K. pandurataand K. rotunda by using their marker peaks. We also combined HPLC fingerprint with chemometrics for discrimination the three species and also for authentication of K. galanga. All the three species andK. galanga adulterated with K. pandurataand K. rotunda were discriminated successfully by using principal component analysis (PCA) and discriminant analysis (DA). This result indicates that HPLC fingerprint analysis in combination with PCA (PC1 = 30.06% and PC2 = 34.74%) and DA (DF1 = 94.59% and DF2 = 3.32%) could be used for authentication ofK. galangasamples from the related species.
Keywords: Kaempferia galanga; HPLC; Fingerprint analysis; Chemometrics
ABSTRAK
Analisis sidik jari menggunakan kromatografi cair kinerja tinggi (KCKT) telah dikembangkan untuk autentikasi kencur dari spesies yang berkerabat dekat seperti temu kunci dan kunci pepet. Identifikasi sampel kencur dan deteksi adulterasi kencur oleh temu kunci dan kunci pepet dilakukan dengan membandingkan kromatogram sidik jari kencur, temu kunci, dan kunci pepet berdasarkan puncak penanda. Kombinasi sidik jari KCKT dengan kemometrik juga dilakukan dengan PCA dan DA; ketiga spesies berhasil terdiskriminasi. Oleh karena itu analisis sidik jari KCKT yang dikombinasikan dengan PCA (PC1 = 30,06% dan PC2 = 34,74%) dan DA (DF1 = 94,59% dan DF2 = 3,32%) dapat digunakan untuk autentikasi sampel kencur dari spesies yang berkerabat dekat.
Kata Kunci:kencur; KCKT; analisis sidik jari; kemometrik
INTRODUCTION
Kaempferia galanga (KG) is known as kencur in Indonesia and widely used in folk medicine to treat some diseases, i.e. rheumatic, cough, dysentery, and stomach pain. This plant has many biological activities such as antimicrobial [1], antioxidant [2], mosquito and larva repellent [3], analgesic [4], and anti allergic [5]. In Indonesia, commercial product of KG was sold asJamu (Indonesia traditional medicines) along with other medical plants and especially used for treating women’s health, freshness, facilitates blood circulation and strengthen the body [6]. Besides sold as jamu, sometimes KG also used as a single herb product (KG powder), which is packaged in capsule or sachet. Ethyl-p-methoxycinnamate (EPMC) and ethyl cinnamate from KG are responsible for the major bioactivities of KG [7].
method for evaluating quality of KG raw material in order to prevent an adulteration with some related plants (KP and KR).
Today, chemical fingerprint analysis widely used and getting popular for an approach in the development of identification, discrimination, and authentication methods as a part of quality control herbal medicines. Several analytical techniques such as chromatography (TLC, GC, HPLC/UPLC) and spectrometry (UV-Vis, IR, NMR, MS) or tandem like GC-MS and LC-MS could be used for fingerprint analysis [8-9]. HPLC with diode array detector (HPLC-DAD) would be a better choice for development of chemical fingerprint analysis because this technique has high separation efficiency and detection sensitivity [10-11].
The chromatographic fingerprint analysis will give as much as possible of detecting compounds so could give an overall view of chemical profiles in a sample. Therefore this method will contain a large amount of data. To deal with this, we used multivariate analysis for data processing and handling to build an identification, authentication, or discrimination method. The combination of chromatography fingerprint and multivariate analysis have been extensively used for species identification, discrimination, and authentication medicinal plant such as in some species from the genus of Aconitum[12], Curcuma[13], Epimedium[14], Panax [15], and Zingiber [16]. However, there is no reported work regarding discriminating of some species from Kaempferiagenus.
In this study, we developed an HPLC fingerprint analysis combined with multivariate analysis for identification, discrimination, and authentication of KG from related plant species (KP and KR). This proposed
method was successfully applied for identifying and authenticating of KG raw material.
EXPERIMENTAL SECTION
Materials
All solvents used were analytical or HPLC grade and obtained from Merck (Darmstadt, Germany), membrane filters of Ekicrodisc 25R (0.45 mm pore size; PTFE; P/NE252) obtained from Gelman Science Japan Co. (Tokyo, Japan) were used for the filtration of the mobile phase and samples solution. Column C18
Shim-pack VP-ODS C18(150 nm x 4.6 mm i.d.) (Shimadzu,
Tokyo, Japan) was used. Twenty-one samples from three genus ofKaempferiawere collected from various locations in Java Island, Indonesia (Table 1). All of the samples were identified in Herbarium Bogoriense, Research Center for Biology, Indonesian Institute of Sciences, Indonesia and voucher specimens were deposited at Biopharmaca Research Center, Bogor Agricultural University, Indonesia. All samples were sieved, dried and pulverized prior to use.
Instrumentation
The HPLC system used was LC-20A series (Shimadzu, Tokyo, Japan) equipped with a diode array UV detector and Shim-pack VP-ODS C18 column (150 mm x 4.6 mm i.d.) (Shimadzu, Tokyo, Japan). The mobile phase consisted of methanol (A) and 1% acetic acid in water (B) using a gradient elution program of 20–80% (A) in 0–60 min with a flow rate of 1 mL/min and monitored at 254 nm.
Table1.Sources of samples
Species Sample code Sources (regency, province)
Kaempferia galanga KG-1 Bogor, West Java
KG-2 Sumedang, West Java
KG-3 Karang anyar, Central Java
KG-4 Solo, Central Java
Kaempferia pandurata KP-1 Bogor, West Java
KP-2 Cikarang, West Java
KP-3 Sumedang, West Java
KP-4 Wonogiri, Central Java
KP-5 Pacitan, East Java
KP-6 Ponorogo, East Java
Kaempferia rotunda KR-1 Cibinong, West Java
KR-2 Pondok Gede, West Java
KR-3 Cikarang, West Java
KR-4 Solo, Central Java
KR-5 Solo, Central Java
Table 2. Composition KG, KP and KR of the mixture
Note: H = high major component concentration, M = medium, L = low
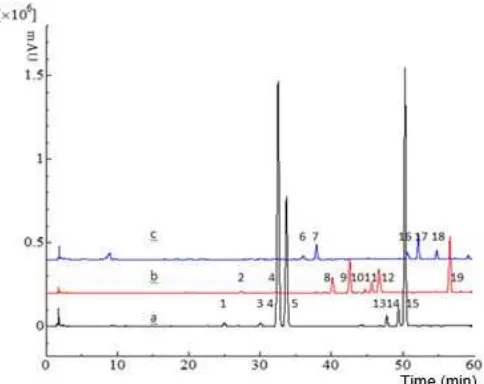
Fig 1. Representative fingerprint chromatograms of KG (a), KP (b), and KR (c)
Procedure
Sample preparation
Adulteration detection was carried out by mixing KG powder with KP or KR. KG sample was classified into 3 categories, i.e. high major component (H), medium major component (M) and low major component (L) level. The combination of KG with KP or KR showed in Table 2.
Accurately weighed powdered samples (250 mg) were ultrasonicated with methanol (5 mL) for 30 min. A membrane filter of Ekicrodisc 25R 0.45 µm membrane filter was used for filtering the sample extracts before injection into the HPLC system.
Analytical performance test
The analytical performance test was evaluated by determining repeatability and stability. The parameters used for this test were expressed as relative retention time (RRT) and relative peak area (RPA). RRT and RPA of the characteristic chromatogram peaks (Fig. 1) were calculated to reference peak number 1. The sample used for these tests was KG-6.
Data analysis
PCA and DA were used to construct a model for identification and authentication of the samples using XLSTAT software 2012.2.02 (Addinsoft, New York, USA). As variables we used the areas of the common peaks obtained from fingerprint chromatograms of KG, KP, and KR.
PCA and DA were selected for multivariate analysis. PCA is a well known unsupervised pattern recognition method and frequently used for data reduction. PCA is able to reduce the number of variables and provide new information after data sets reduction. The result of PCA analysis is a new variable called as principal components (PCs). In general, the first two PCs are usually used for PCA plot and the similarity of objects and classification trend is shown. DA is another pattern recognition technique, which commonly used to discriminate some closely related plants. DA will generate a discriminant function (DF) for each group by finding a linear combination of the data that will provide separation of two or more observed groups.
RESULT AND DISCUSSION
Optimization of HPLC Conditions and Analytical Performance of the Method
To optimize the mobile composition, we compared different composition in a gradient elution mode mixture of methanol-acetic acid 1% in water. As a parameter to evaluate the optimum conditions of HPLC fingerprint analysis, we used number of common peaks, total analysis time, and resolution of each common peak as variables. Linear gradient elution of 20-80% methanol in acetic acid 1% (v/v) was found to give a good fingerprint chromatogram with total analysis time 60 min, and detected 7 common peaks with a resolution between peaks > 1.5. Representative fingerprint chromatograms from each selected species are shown in Fig. 1a.
Table 3.Relative retention time (RRT) and relative peak area (RPA) ranges of samples
HPLC Fingerprint Analysis for Identification and
Authentication ofKaempferia galanga
The developed HPLC fingerprint method was applied on 21 single samples consist of 9 samples of KG and 6 samples of KP and KR, respectively. Fingerprint chromatogram of KG, KP, and KR were shown in Fig. 2. Peaks existing in all samples and gives a large signal in each chromatogram were assigned as common peaks. A typical fingerprint approach was used by normalizing the retention time and peak area (RRT and RPA) for each common peak relative to the reference peak. Peak no. 4 was selected as the reference peak because it provided the highest peak area in fingerprint chromatogram of KG. RRT of each common peak was relatively consistent (Table 3), so this variable is suitable for identifying sample. In contrast, the value of RPA varied between samples, which indicating differences in chemical concentration for each samples. These differences may be due because of different environmental growth conditions.
Identification, discrimination, and authentication of some closely related species could be carried out by chromatography fingerprint analysis. The comparison of fingerprint chromatogram for all samples showed almost all common peaks from the three species did not overlap. The common peaks (1, 3, 5, 13, 14, and 15) of KG did not appear in the KP and KR, also the common peaks of KP (2, 4, 8, 9, 10, 11, 12, and 19) and KR (6, 7, 16, 17, and 18) did not appear in other species in this study. So it means all the common peaks from each species were typical for the same species. Even the peak no. 4 appear in KG and KP sample, but in general, this peak was found dominant (peak height) in KG. So, the peak no. 4 also could be used as a characteristic peak of KG. Similar condition also occurred for peak no. 15 in KG and KR. All typical peaks in the fingerprint
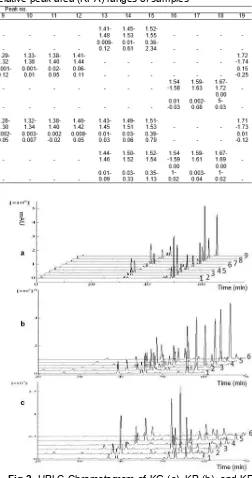
Fig 2.HPLC Chromatogram of KG (a), KP (b), and KR
(c). Location: KG Bogor (a1), Sumedang (a2), Karang anyar (a3), Solo (a4), Purworejo (a5), Wonogiri 1 (a6), Wonogiri 2 (a7), Pacitan 1 (a8), Pacitan 2 (a9); KP Bogor (b1), Cikarang (b2), Sumedang (b3), Wonogiri (b4), Pacitan (b5), Ponorogo (b6); KR Cibinong (c1), Pondok Gede (c2), Cikarang (c3), Solo 1 (c4), Solo 2 (c5), Tawangmangu (c6)
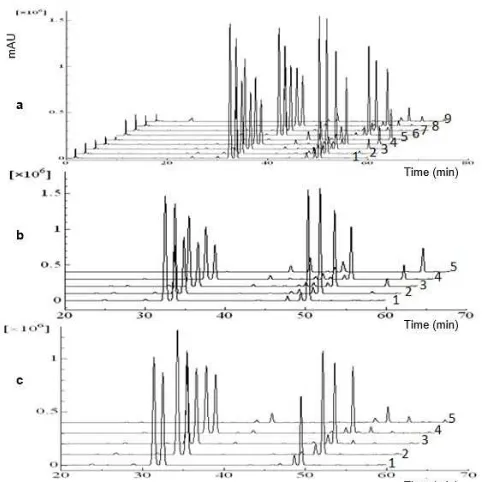
The presence of characteristic peaks from each species was very helpful to detect if there is an adulteration of KG by KP and KR. When KG adulterated by KP and KR with concentration of 5, 25, and 50%, it was found that fingerprint chromatogram of KG alone will be differ from the fingerprint chromatogram of KG mixed with KP or KR. The present of characteristic peaks from KP or KR makes that differences as can be seen in Fig. 3. Concentration of adulterant (KP and KR) caused significant change on the fingerprint chromatogram of KG (Fig. 3a). The intensity of common peaks from KG linearly reduced, whereas the intensity of common peaks of sample KP and KR linearly increased along with the increasing of adulterant concentration (Fig. 3b and 3c). Based on the result obtained, identification and authentication of KG from KP and KR was achieved using HPLC fingerprint analysis.
Identification and Authentication of KG from KP and KR Using a Combination of HPLC Fingerprint and Multivariate Analysis
The combination of HPLC fingerprint and multivariate analysis were used to confirm the result obtained for identification and authentication of KG from KP and KR by visual inspection of their typical fingerprint chromatogram. This combination was frequently used for
Fig 3. HPLC Chromatogram of KG, KP, and
KG-KR (a), mixed of KG-KP (b), and mixed of KG-KG-KR (c). Sample: KG 100% (a1, b1, & c1), KG-KP 5% (a2 & b2), KG-KP 25% (a3 & b3), KG-KP 50% (a4 & b4), KP 100% (a5 & b5), KG-KR 5% (a6 & c2), KG-KR 25% (a7 & c3), KG-KR 50% (a8 & c4), KR 100% (a9 & c5)
the purposes of identification, discrimination, and authentication of many medicinal plants species. In this study, a multivariate analysis was used such as PCA and DA.
In our investigation, PCA was used for identification and authentication of all samples based on the peak areas of 19 common peaks. PCA was performed on 33 objects x 19 data matrix. Fig. 4a shows the PCA plot of the first two PC, which have a total variance of 64.80% (PC1 = 30.06% and PC2 = 34.74%). From this PCA plot, KG, KP, and KR could be classified into their own groups. Unfortunately, the authentication of KG when it mixed with KP, all mixed samples could be distinguished well (Fig. 4a and 4b) only for KG-KP 5%, the distance was very close to the 100% of KG. Mixed samples of KG and KR could not distinguish well by PCA in all concentration of KR. This situation occurs due to peak area of the common peaks from KR are very small compared to peak area of the common peaks of KG (Fig. 1a and 1c). In general, PCA could discriminate of the three species, but for authentication of KG not very successful especially when KG adulterated by KR.
The result of DA has better prediction model compare with PCA. It means that supervised pattern recognition is more suitable for the data set in this study. DA method composes a linear function of the variable in multivariate space which maximizes the ratio between both variances compared to within group variance. In contrast, PCA is employed for data compression and transform the large number original data set comprising of inter-correlated variables into reduced new set of variables.
In this study, prediction model of DA was used to obtain a clear discrimination between the three samples and authentication of KG from KP and KR. This model also used 19 common peaks as variables and we obtained a total variance 98.91% (DF1 = 94.59% and DF2 = 3.32%). Fig. 4c and 4d show that DA was able to distinguish the three species as well as all mixed samples of KG-KP and KG-KR in all concentration used in this study. However, KG-KR 5% has small differences with 100% of KG and perhaps because the intensity of characteristic peaks from KR is very small (Fig. 1a and 1c).
Validation of the DA model with a low number of samples commonly used a cross validation techniques. The predictive ability of the model has been tested using leave-one-out cross validation (LOOCV). As a result from LOOCV, 100% of samples used in this study correctly classified to their groups. These results indicated that the model gave a very satisfactory classification prediction for the test sample.
CONCLUSION
Identification and authentication of KG from KP and KR was successfully achieved by our HPLC fingerprint method. By visualization of characteristic peaks from fingerprint chromatogram of each samples used, we could authenticate KG from KP and KR as well as by using a combination of HPLC fingerprint and discriminant analysis. So the developed method was proved to be an efficient, reliable and valid method for identification and authentication of KG from KP and KR.
ACKNOWLEDGEMENT
The authors gratefully acknowledge the Ministry of Education and Culture of The Republic of Indonesia for the Master scholarship in Bogor Agricultural University.
REFERENCES
1. Lakshmanan, D., Werngren, J., Jose, L., Suja, K.P., Nair, M.S., Varma, R.L., Mundayoor, S., Hoffner, S., and Kumar, R.A., 2011, Fitoterapia, 82 (5), 757– 761.
2. Mekseepralard, C., Kamkaen, N., and Wilkinson, J.M., 2010,Phytother. Res., 24 (10), 1514–1519. 3. Sutthanont, N., Choochote, W., Tuetun, B.,
Junkum, A., Jitpakdi, A., Chaithong, U., Riyong, D., and Pitasawat, B., 2010, J. Vector Ecol., 35 (1), 106–115.
4. Ridtitid, W., Sae-wong, C., Reanmongkol, W., and Wongnawa, M., 2008,J. Ethnopharmacol., 118 (2), 225–230.
5. Tewtrakul, S., and Subhadhirasakul, S., 2007, J. Ethnopharmacol., 109 (3), 535–538.
6. Roemantyo, H.S., and Soekarman, 1996, Warta Tumbuhan Obat Indonesia, 3 (2), 15–16.
7. Umar, M.I., Asmawi, M.Z., Sadikun, A., Atangwho, I.J., Yam, M.F., Altaf, R., and Ahmed, A., 2012, Molecules, 17 (7), 8720–8734.
8. Liang, Y.Z., Xie, P., and Chan, K., 2004, J. Chromatogr. B, 812 (1-2), 53–70.
9. Akarasereenont, P., Thitilertdecha, P., Chotewuttakorn, S., Palo, T., Seubnooch, P., Wattanarangsan, J., Phadungrakwitya, R., Klumklomijt, S., Chareonkij, P., Sathiyos, Y., and Laohapand, T., 2010,Siriraj Med. J., 62 (1), 4–8. 10. Li, Y., Wu, T., Zhu, J., Wan, L., Yu, Q., Li, X.,
Cheng, Z., and Guo, C., 2010,J. Pharm. Biomed. Anal., 52 (4), 597–602.
12. Zhao, Y., Zhang, Y., Lin, R., and Sun, W., 2009, Fitoterapia, 80 (6), 333–338.
13. Rafi, M., Wulansari, L., Heryanto, R., Darusman, L.K., Lim, L.W., and Takeuchi, T., 2015,Food Anal. Methods, 8 (9), 2185–2193.
14. Wang, L., Wang, X., and Kong, L., 2012, Biochem. Syst. Ecol., 40, 138–145.
15. Yang, S.O., Lee, S.W., Kim, Y.O., Sohn, S.H., Kim, Y.C., Hyun, D.Y., Hong, Y.P., and Shin, Y.S., 2013, J. Gingseng Res., 37 (2), 248–253.