King’s is ranked in the top 25 universities
worldwide*
and based in the heart of London.
With nine Schools and six Medical Research
Council centres, King’s ofers world-class teaching
and research. Our extensive range of subjects
includes humanities, law, medicine, psychiatry,
dentistry, nursing, mathematics; natural,
biomedical, social and management sciences.
*QS World University Rankings, 2010
Cambridge has replaced Harvard at the pinnacle of global higher education in the irst change of leadership in seven years of the QS World University Rankings®*.
he 2010 rankings show a growing European challenge to the domination of US universities, with leading institutions in the UK, Germany and Switzerland in particular, improving their positions. More than 50 countries have at least one university in the top 500.
Some 5,000 employers and over 15,000 academics and university administrators from around the world ofered expert opinion on the top universities for the latest QS World University Rankings®. Universities were also judged on their research citations, staing levels and international activity.
he academic survey is by far the largest since QS irst compiled the rankings in 2004. Almost half of the respondents were professors or assistant professors and the survey includes the views of more than 700 university presidents, vice-chancellors and deputy vice-chancellors.
he expanded employer survey is a unique feature of the QS rankings that will be of particular interest to prospective students. Based on their direct experience of graduates, employers oten difer from academics in their views of the leading universities, all of which are clear in the detailed tables available at www.topuniversities.com
Cambridge’s rise from second place in the ranking was fuelled by signiicant growth in the number of citations per faculty member and a smaller improvement in staing levels. Harvard, by contrast, has taken more students since the last rankings were compiled without an equivalent increase in the number of academics.
Cambridge remained the academics’ top choice, while Harvard was the employers’ favourite. As was the case in 2009, less than one point out of 100 separates the two universities. Cambridge remains top in the natural sciences, while Harvard continues to head the rankings in both life sciences and social sciences.
Yale University and University College London (UCL) hold on to third and fourth places respectively in the 2010 rankings, with the Massachusetts Institute of Technology (MIT) moving up from ninth place to complete the top ive. his year’s top 20 contains 13 US and four UK universities, but Switzerland, Canada and Australia are also represented.
ETH Zurich, the Swiss technological university, is the leading representative of Continental Europe, as it was last year. It is joined in the top 50 by the Ecoles Polytechniques in Lausanne and Paris, the Ecole Normale Superieure also in Paris, and the University of Copenhagen.
As in 2009, the UK has Imperial College, London, and Oxford University in the top ten, as well as UCL and Cambridge. King’s College London, Edinburgh, Bristol and Manchester universities are all in the top 30.
On the evidence of this year’s rankings, the US remains the dominant force in higher education, but the balance of power is shiting to some extent. here are 53 US universities in the top 200, compared with 58 two years ago. Many US universities are feeling the efects of budget cuts and sharp drops in their endowment. Similar or more serious constraints are on the way in the UK and it remains to be seen whether the leading universities can remain as competitive.
he beneiciaries of recession in the West, in ranking terms, may be the rising academic powers of Asia. Hong Kong, Tokyo and Kyoto universities are all just outside the top 20 this year, while the National University of Singapore, Hong Kong University of Science and Technology (HKUST) and the Chinese University of Hong Kong, as well as Peking, Osaka and Seoul National universities all make the top 50.
Australia has the other main group of leading universities, with the Australian National University 20th and Sydney, Melbourne and Queensland all in the top 50.
his is the seventh edition of the QS World University Rankings®, which are the most widely-read of the global comparisons of universities. he rankings are used by governments and employers, as well as universities seeking international partners, but the most numerous users are to be found among the growing number of students choosing courses outside their home country. Since 2000,
the student numbers studying abroad have risen from below 2 million to more than 3 million and the increased pressure
on university places in a number of countries this year is likely to accelerate the trend.
he main ranking, as well as separate tables for the subject groupings: arts and humanities, engineering and technology, life sciences and medicine, natural sciences, and social sciences and management, are available online at www.topuniversities.com, the home of the QS World University Rankings®. he results of the rankings are also available as an iPhone app, and through QS’ international media partners.
*Formerly known as THE-QS World University Rankings 2004-2009
A shift in power
Size Focus Res. Score Rank Score Rank Score Rank Score Rank Score Rank Score Rank
QS
TOP 500 UNIVERSITIES
2010 r
ank
2009 r
ank
Institution Coun
tr
y/
Territ
or
y
Classifica
tion
A
cademic
Reputa
tion
Emplo
y
er
Reputa
tion
Facult
y
S
tuden
t
Cita
tions per
Facult
y
In
terna
tional
Facult
y
In
terna
tional
S
tuden
ts
O
v
er
all
Size Focus Res. Score Rank Score Rank Score Rank Score Rank Score Rank Score Rank
Size Focus Res. Score Rank Score Rank Score Rank Score Rank Score Rank Score Rank
361 318= Brunel University GB L CO VH 20 301+ 55 174 23 301+ 22 301+ 90 64= 86 76= 31.9 362 355= Deakin University AU L FC MD 36 292 48 214 19 301+ 14 301+ 25 296 86 75 31.9 363 401-450 Università degli Studi di Pavia (UNIPV) IT L FC HI 34 301+ 17 301+ 16 301+ 60 136 6 301+ 15 301+ 31.8 364 349 Warsaw University PL XL CO VH 45 226= 48 211= 29 301+ 9 301+ 6 301+ 6 301+ 31.6 365 320 Universiti Teknologi Malaysia (UTM) MY L CO HI 32 301+ 49 207 43 274= 2 301+ 22 301+ 59 178= 31.6 366 350 National University of Sci. and Tech. (NUST) Islamabad PK M FC LO 29 301+ 31 301+ 77 100 1 301+ 6 301+ 6 301+ 31.6 367 343= Universidad de Chile CL XL FC HI 42 245 44 237 23 301+ 21 301+ 11 301+ 9 301+ 31.5 368 394= Bangor University GB M FC HI 22 301+ 21 301+ 41 292= 29 301+ 66 146 57 190= 31.5 369 401-450 University of Tampere FI M FO VH 33 301+ 23 301+ 43 274= 25 301+ 24 301+ 12 301+ 31.5 370 351= National Taiwan University of Science and Technology TW M FO VH 33 301+ 35 301+ 52 217= 12 301+ 10 301+ 16 301+ 31.5 371 291= University of Delhi IN XL FC MD 54 166 68 113= 2 301+ 7 301+ 3 301+ 3 301+ 31.2 372 374= United Arab Emirates University AE L FC MD 22 301+ 24 301+ 43 278= 9 301+ 100 1 84 83= 31.2 373 386= Universität Bayreuth DE M CO VH 23 301+ - 301+ 63 152= 27 301+ 43 205 25 301+ 31.1 374 392= Illinois Institute of Technology US M CO VH 17 301+ 14 301+ 51 225= 24 301+ 48 190 100 3 31.1 375 312= Novosibirsk State University RU M FC MD 26 301+ 24 301+ 82 85= 3 301+ 3 301+ 10 301+ 30.9 376 357= Swansea University GB M FC HI 19 301+ 38 275 40 300= 20 301+ 69 132 62 162= 30.7 377 401-450 University of Kansas US L FC VH 24 301+ 22 301+ 40 300= 38 259 23 301+ 30 301+ 30.7 378 354 Philipps-Universität Marburg DE L FC HI 18 301+ 9 301+ 54 205= 38 260 34 249= 41 260= 30.7 379 401-450 Universität Regensburg DE L FO VH 17 301+ - 301+ 51 225= 51 183 36 235= 20 301+ 30.6 380 386= Aberystwyth University GB M CO VH 23 301+ 23 301+ 50 232= 13 301+ 56 178 61 168 30.6 381 383= Universidade Federal do Rio de Janeiro BR XL FC VH 40 256 25 301+ 34 301+ 18 301+ 13 301+ 3 301+ 30.5 382 371= Université Toulouse III, Paul Sabatier FR L FO VH 36 295 - 301+ 44 268= 17 301+ 27 288= 37 287= 30.3 383 337= University of St Gallen (hsg) CH M SP VH 17 301+ 71 102 24 301+ 7 301+ 97 35 98 25 30.3 384 401-450 Universidade Nova de Lisboa PT L FC MD 32 301+ 29 301+ 43 278= 14 301+ 20 301+ 32 301+ 30.2 385 380 University of Tennessee US XL FC VH 16 301+ 33 301+ 37 301+ 56 155 14 301+ 14 301+ 30.0 386 361= Goldsmiths, University of London GB M FO VH 32 301+ 23 301+ 26 301+ 7 301+ 79 105= 78 105= 29.9 387 339= Tecnológico de Monterrey (ITESM) MX L FC LO 24 301+ 80 65 45 263= 2 301+ 28 281= 16 301+ 29.7 388 401-450 Tongji University CN XL FC VH 35 300 17 301+ 60 167= 4 301+ 2 301+ 12 301+ 29.7 389 401-450 Linkoping University SE L CO VH 34 301+ 20 301+ 32 301+ 32 301+ - 301+ 17 301+ 29.6 390 401-450 Université Lyon 1, Claude Bernard FR L FC VH 29 301+ 3 301+ 34 301+ 37 263= 11 301+ 47 232= 29.5 391 346= Howard University US M FC HI 17 301+ 43 242 74 108= 10 301+ - 301+ 22 301+ 29.5 392 371= Pusan National University KR L FC HI 39 262= 12 301+ 41 292= 14 301+ 9 301+ 12 301+ 29.4 393 401-450 University at Bufalo SUNY US L FC VH 17 301+ - 301+ 21 301+ 70 98 14 301+ 67 142= 29.3 394 383= University of Bradford GB M CO VH 23 301+ 29 301+ 22 301+ 22 301+ 64 150 94 49 29.1 395 326= Dublin Institute of Technology IE M CO HI 20 301+ 46 222 63 152= 2 301+ 17 301+ 40 266= 29.0 396 366= University of Coimbra PT L FC HI 41 255 12 301+ 29 301+ 15 301+ 9 301+ 33 301+ 29.0 397 379 Sogang University KR M CO VH 27 301+ 41 250 47 243= 7 301+ 17 301+ 31 301+ 29.0 398 451-500 National Central University TW M CO VH 32 301+ 15 301+ 40 300= 25 301+ 12 301+ 5 301+ 29.0 399 401-450 Universität Jena DE L FC VH 25 301+ - 301+ 30 301+ 50 191 27 288= 19 301+ 28.9 400 401-450 Christian-Albrechts-Universität zu Kiel DE L FC VH 18 301+ - 301+ 36 301+ 54 168 33 253= 29 301+ 28.8
Legend
SIZE FOCUS RESEARCH INTENSIT
Y
QS
TOP 500 UNIVERSITIES
2010 r
ank
2009 r
ank
Institution Coun
tr y/ Territ or y Classifica tion
Size Focus Res.
401-450 351= Bandung Institute of Technology (ITB) ID L CO LO 401-450 401-450 Technische Universität Braunschweig DE L CO VH 401-450 386= Carleton University CA L CO VH 401-450 451-500 Chiang Mai University TH XL FC MD 401-450 401-450 Concordia University CA L CO VH 401-450 401-450 University of Crete GR L FC MD 401-450 394= Czech Technical University In Prague CZ L SP VH 401-450 401-450 University of Delaware US L CO VH 401-450 451-500 Universität Dortmund DE L CO VH 401-450 397= Drexel University US L FC HI 401-450 401-450 Eötvös Loránd University HU L CO VH 401-450 371= Florida State University US L FC HI 401-450 451-500 University of Houston US L CO VH 401-450 451-500 Indian Institute of Technology Roorkee (IITR) IN S FO VH 401-450 451-500 Inha University KR L FC HI 401-450 451-500 Istanbul University TR XL FC MD 401-450 401-450 University of Kent GB L CO VH 401-450 501-550 King Abdul Aziz University (KAU) SA XL FC LO 401-450 451-500 Koç University TR S FC MD 401-450 401-450 Kumamoto University JP M FC VH 401-450 401-450 Lehigh University US M CO VH 401-450 401-450 National University of Ireland Maynooth IE M FO VH 401-450 401-450 University of Missouri, Columbia US L FC VH 401-450 392= Nagasaki University JP M FO VH 401-450 451-500 Université Nancy 1, Henri Poincaré FR L FO VH 401-450 451-500 Università degli Studi di Napoli - Federico II IT XL FC VH 401-450 383= University of New Mexico US L FC VH 401-450 381= City University of New York US XL CO VH 401-450 451-500 Northeastern University US L CO VH 401-450 401-450 Okayama University JP L FC VH 401-450 401-450 University of Oklahoma US L FC VH 401-450 401-450 University of Oregon US L CO VH 401-450 501-550 Oregon State University US L CO VH 401-450 401-450 Université Paris Dauphine FR M SP VH 401-450 451-500 Università degli Studi di Roma - Tor Vergata IT XL CO VH 401-450 501-550 Sabanci University TR S CO VH 401-450 401-450 University of South Carolina US L FC HI 401-450 401-450 National Sun Yat-sen University TW M CO VH 401-450 401-450 Swinburne University of Technology AU L CO HI 401-450 368= University of Tehran IR XL CO VH 401-450 451-500 Aristotle University of Thessaloniki GR XL FC VH 401-450 401-450 Tianjin University CN L CO VH 401-450 401-450 Tokyo Metropolitan University JP M CO VH 401-450 401-450 Tomsk State University RU M CO HI 401-450 451-500 Università degli Studi di Trento (UNITN) IT L CO VH 401-450 401-450 Università degli Studi di Trieste (UNITS) IT L FC HI 401-450 401-450 Universitat de Valencia ES XL FC HI 401-450 451-500 University of Vermont US M FC VH 401-450 401-450 College of William & Mary US M CO VH 401-450 451-500 Xi'an Jiaotong University CN L FC VH
QS
TOP 500 UNIVERSITIES
2010 r
ank
2009 r
ank
Institution Coun
tr y/ Territ or y Classifica tion
Size Focus Res.
www.topuniversities.com
THE INTERNATIONAL
MARKETING
SOLUTION
FOR UNIVERSITIES
University Search
featuring profiles of over
1000 universities worldwide
5.4
million unique visits in 2009
4.5
million to July 2010
9.8
million unique visits predicted for 2010
Average visitor time
4.6
minutes
Various online marketing options available to universities to suit your target markets and budgets.
Contact
for further information.
These are challenging but exciting times in third level education and UCC is in the vanguard, leading the change agenda with innovation and new ideas.
Find out more about UCC at
www.ucc.ie
•Almost two thirds of Ireland’s most
cit-ed researchers are from UCC and for SFI-funded research, the University consistently has the highest number of patents and invention disclosures of any Irish university
•More than 2,500 overseas students
from some 100 countries around the globe have made UCC their university of first choice
•Now approaching 20,000, our student
population enjoys internationally rec-ognised undergraduate and graduate degree programmes
•Our campus, the most beautiful in
Ireland, has received the Green Cam-pus Award from the Federation for Environmental Education, the only Irish university campus to receive this distinction
•The University is within walking
dis-tance of Cork City, designated by Lonely Planet as one of the top ten cities in the world to visit in 2010.
LEADING
THE WAY
How can we rank the world’s universities? he sheer number of them, their diversity, and the vast range of nations and cultures of which they form a part, all point to the diiculty of this task.
But we also know that universities are the original global industry. hey have been exchanging scholars, students and ideas for centuries. Now this activity has grown into a major world industry. his means that global universities have some features in common, and these provide the starting point for the QS World University Rankings®.
Our most important insight is that academics know where the best academic work is being carried out. So we ask them, by means of a carefully-designed survey in which named and approved individuals within universities are asked to name up to 30 top universities in the subject they know about. Nobody can vote for their own institution.
Academic Respondents
by Job Classification
Job Classifica
tion C oun t % Responden ts
President / Vice-Chancellor 306 2.0% Vice-President / Deputy
Vice-Chancellor 399 2.6%
Senior Administrator 556 3.7%
Head of Department 1,467 9.7%
Professor / Associate
Professor 7,252 48.0%
Assistant Professor 767 5.1%
Senior Lecturer 972 6.4%
Lecturer 1,102 7.3%
Research Specialist 617 4.1%
Admissions Officer 50 0.3%
Administrator / Functional
Manager 386 2.6%
Research Assistant 324 2.1%
Other 852 5.6%
his year 15,050 people took part, including some from 2009 and 2008 who had not voted in a previous year. hey cast 170,582 valid votes. his is, by far, the biggest world survey of academic opinion in history.
We also know that people who employ graduates are astute observers of universities so we survey them to ask where they like to recruit. his year (again counting unique results from 2008 and 2009), 5,007 people took part in our employer review. hey cast 15,087 valid votes.
Employer Respondents by Sector
Job Classifica
tion C oun t % Responden ts
Aerospace / Defence 50 1.0%
Construction / Property 182 3.6%
Consulting / Professional
Services 550 11.0%
Electronics / High
Technology 131 2.6%
Energy 144 2.9%
Financial Services / Banking 513 10.2%
FMCG 220 4.4%
IT / Computer Services 393 7.8%
Law 64 1.3%
Manufacturing / Engineering 517 10.3% Media / Entertainment &
Arts 104 2.1%
Metals / Mining 64 1.3%
Pharmaceuticals / Biotech &
Healthcare 224 4.5%
Public Sector / Govt. /
Non-profit 313 6.3%
Recruitment / HR services 348 7.0%
Retail 131 2.6%
Telecoms 131 2.6%
Transportation / Distribution 95 1.9% Travel / Leisure / Hospitality 75 1.5%
Utilities 58 1.2%
Other 564 11.3%
A look at the nations represented in our employer and academic surveys shows the US is the biggest contributor to our academic survey, and India to our employer survey. Mainland China contributes 1.8% of our academic respondents and 1% of the employers. here are more signiicant contributions from Hong Kong, a Special Administrative Region of China.
hese two elements make up half of a university’s possible score in the QS World University Rankings®: 40% for the academic review and 10% for the employer review.
The next 20% is derived from academic journal citations, the classic measure of research impact. We use data from Scopus, part of the Elsevier publishing group, running back five years and covering over 18,000 journals, alongside data on the number of academic staff at each university, to produce the number of citations per person. This reduces bias in favour of high-citation subjects such as medicine, instead measuring the concentration of high-quality research at each institution.
A further 20% of a university’s possible score comes from its faculty/student ratio, in an attempt to capture its commitment to teaching. his is an indirect measure whose imperfections we acknowledge. One advantage of using it is that a university which reported a dubiously low number of staf to enhance its citations per person count would sufer on this measure, and vice versa.
Finally we allot 5% to each of two measures of globalization, the percentage of international staf and international students at each university. his tells us whether universities are serious about being global. More importantly, it tells us whether people want to cross borders to be there. We limit the size of these measures so that a poor university cannot achieve a high ranking by illing itself with indiferent foreign staf and students.
his process uses data on student and staf numbers, and on international staf and students, which is gathered from universities themselves and from national agencies using agreed deinitions. It is also checked and veriied by QS.
We create the rankings by generating the results for each criterion, weighting them according to their Z score, essentially a measure of their distance from the average score. his removes the severe efects of outliers. We display each column with the score for the top institution normalised to 100, and aggregate all six into the inal column to yield the overall ranking.
Martin Ince
looks at the methodology behind ranking the world’s universities
Higher education is a global industry. Every university wants more foreign students and over three million people are now studying outside their home country. he QS World University Rankings® are one way of looking at the world’s universities; this makes them an essential part of the global higher education enterprise.
But what do these rankings, which gauge the performance of speciic institutions, tell us about national university systems?
he world economic crisis has given this question extra importance. All university systems are dependent upon state spending, and there is about to be less of it. We know too that governments are very aware of national performance in world ranking systems. hey may regard international success in their universities as a sign they are worth investing in – or as proof they have enough money already.
This year’s QS World University Rankings® show a comparatively small number of countries gaining ground as world powers in higher education. France, Germany, Ireland, Italy, Korea, the Netherlands, Spain, Taiwan
and the UK are the only nations with more universities in the top 200 places in 2010 than in 2009. But even this is a message of stability rather than radical change. Only one of these countries, Germany, had two new institutions in the top 200. The rest had one new entrant each.
Germany’s rise from 10 to 12 top-200 universities may relect the success of the Excellence Initiative, which is funnelling several billion Euros of research cash into a select group of universities. he contrast is with Japan, down from 11 to 10 top-200 universities. hese are nations of similar size and wealth. But Japan is subject to far worse policy paralysis, both regarding universities and concerning its future overall.
A more thorough look at national university capacity is provided by the table of University System Strength. his uses four equally-weighted measures to grasp the comparative power of diferent university systems, basing its indings on the top 500 universities in the QS World University Rankings®.
he irst measure we show, System, is derived from the number of universities which a country has in the top 500 and their average position. he second, Access, looks at each nation’s success at getting people into college. It is a measure of the size of its university population divided by the square root of its population. We use the square root rather than the absolute igure to avoid a few tiny outliers, such as Hong Kong, dominating the results.
Our third measure, Flagship, uses the position of each nation’s top university in the rankings. his is important because many nations (Taiwan is an example) regard it as vital to have at least one university which is highly-placed on the world stage.
he inal criterion, Economic, acknowledges countries that have created a viable university system in diicult economic circumstances. It awards ive points for any university in the top 100, four for one between 101 and 200, and three, two or one respectively for each university between 201 and 300, 301 and 400, and 401 and 500. his score is divided by the country’s gross domestic product per capita.
In previous years, the US has won all four categories and come top overall. But in 2010, Cambridge University’s top position in the QS World University Rankings® means the UK won the Flagship group. Despite this, the US was top on the other three measures and overall, with the UK in second place despite being ith in terms of Access. his ranking shows the university systems of continental Europe in a positive light, with eight of the top 20 places.
here are inevitably imperfections in this analysis. Italy appears in fourth spot for Access, but observers of its university system claim it is a bloated mess with too many students. Getting rid of some would lower its position here.
It is also notable that China and India come in 42nd and 44th position respectively in terms of Access, so their university systems have a long way to go before they gain the scale that these massive nations deserve. But they are also fourth and second respectively on our Economic measure. his shows that their comparative lack of resources is not stopping them from building viable university systems. China is 13th in the world overall, an outlier in a parade of generally aluent nations.
University System Strength
System Access Flagship Economic Overall
Country Score Rank Score Rank Score Rank Score Rank Score Rank ±
United States 100 1 100 1 100 2 100 1 100 1 0
United Kingdom 98 2 96 5 100 1 98 3 98 2 0
Germany 94 3 96 6 95 13 95 5 95 3 0
Australia 90 6 98 2 98 5 86 7 93 4 0
Canada 86 8 96 3 98 4 83 10 91 5 0
France 93 4 78 12 97 9 83 8 88 6 1
Japan 93 5 70 19 98 7 87 6 87 7 1
Netherlands 89 7 83 9 94 15 76 12 85 8 0
Korea, South 77 9 73 16 95 12 75 13 80 9 0
Italy 75 12 96 4 74 27 66 15 78 10 4
Switzerland 76 11 71 18 98 3 60 19 76 11 1
Sweden 72 13 79 11 93 16 60 16 76 12 1
China 77 10 18 42 95 11 98 4 72 13 2
Belgium 62 17 76 15 90 19 55 24 71 14 2
New Zealand 53 20 82 10 92 17 56 22 71 15 2
Spain 67 15 83 8 79 25 53 26 71 16 3
Hong Kong 70 14 61 22 98 6 49 27 69 17 1
Ireland 52 21 77 14 94 14 46 29 67 18 1
Taiwan 64 16 58 24 89 21 56 23 67 19 3
Finland 50 23 72 17 91 18 47 28 65 20 0
Denmark 46 26 65 21 95 10 43 31 62 21 0
India 62 18 15 44 71 29 99 2 62 22 4
Austria 46 27 78 13 80 24 30 35 58 23 4
Singapore 62 19 59 23 97 8 16 42 58 24 1
www.unsw.edu.au
UNSW International Ofice: Tel. +61 2 9385 6996
n
IDP Sri Lanka: Tel. 011 259 1803
n
Discuss your study options with Ms Meherlyn Jussawalla from
UNSW International Ofice at the following event:
UNSW Interview Program
Date: Wednesday 1 September
Time: 2:00pm - 5:00pm
Venue: IDP Colombo, 1st Floor, 443 Galle Road, Colombo 3
UNSW John Niland Scientia BuildingUNSW John Niland Scientia Building
The University of New South Wales (UNSW) welcomes students from 135 countries,
providing a dynamic international learning environment
n
Ranked in the top 50 in the 2010
QS World University Rankings
n
Offering premium professional programs in: business, science, architecture,
engineering, medicine, law, arts and social sciences, ine arts and design
n
5 star ratings acheived in 8 key performance indicators in the 2011
Australian
Good Universities Guide
n
Consistently ranked in the top 2 universities for Learning and Teaching Performance
under the Australian Government Learning and Teaching Performance Fund
Global Education + Global Networks
= Global Opportunities
A MEMBER OF
A U S T R A L I A ' S L E A D I N G U N I V E R S I T I E S
Group of Eight
www.unsw.edu.au
UNSW International Ofice, Australia:
Tel. +61 2 9385 6996
n The Network for International Higher Education CRICOS PROOne of the main criticisms of global university rankings has been that they compare universities of such varying sizes and types. Small, specialist institutions, however eminent, will struggle to achieve the reputation enjoyed by the best of the big generalist universities, while those whose focus is on the arts or social sciences cannot hope to match the citations generated in science and medicine.
The classifications that appear in the QS World University Rankings® allow readers to take such differences into account without departing from the principle of a single set of comparisons.
he system is based loosely on the Carnegie classiications that divide US universities into diferent categories. But, since Carnegie uses no fewer than 33 diferent types of institution, the QS system has been devised to be more accessible to the general reader. Universities are divided by size, subject focus and research intensity, with no more than four categories for each.
Prospective students or research partners are thus able to see at a glance which universities have broadly similar characteristics. As might be expected, all the universities in this year’s top 50 are categorized at the top level of research activity, but even at the top of the ranking,there are diferences both in size and the spread of subjects.
he École Normale Supérieure, in Paris, 33rd in the overall ranking, emerges as the top small, specialist institution in the world, for example. With fewer than 1,000 highly-selected students, ENS is a very diferent type of university to the National University of Singapore, two places above it, which has 30,000 students but a similar level of research intensity.
he London School of Economics and Political Science (LSE), although only 80th in the overall ranking, is the next highest among the specialist universities. Technological universities, such as ETH Zurich, have a somewhat wider spread of faculties and are classiied as ‘focused’ (abbreviated as FO in the table), while science-based institutions such as Imperial College London oten have a medical school that broadens their ofering.
However, it does not follow that size is always an advantage in the rankings. he
highest-placed of the new ‘extra large’ universities is Michigan, in 15th position, while the largest of all – UNAM, in Mexico, with more than 150,000 students – has dropped out of the top 200 this year. Both third-placed Yale and the Massachusetts Institute of Technology (MIT), in ith place, are classiied as ‘medium’, having fewer than 12,000 students.
The classifications, which were introduced in 2009, have been improved for the latest rankings. The new ‘extra large’ (XL) category has been introduced to identify universities that have more than 30,000 students, while more intuitive abbreviations have replaced the previous numerical classifications for easier use.
The new categories are as follows:
• Size – based on the (full time equivalent) sizeof the degree-seeking student body, covering both undergraduates and postgraduates. Where an FTE number is not available, one has been estimated based on common characteristics of other institutions in the country or region in question.
• Focus – four categories based on the range
of subjects available in each institution, deined by the ive broad faculty areas used in the QS rankings. To relect the diferent publication patterns in medicine, a distinction is made between broad-based universities with a medical school (fully comprehensive, or FC) and those operating in all
ive faculty areas without a medical school (comprehensive, or CO).
hose operating in three or four faculty areas are categorized as focused (abbreviated as FO) while those operating in only one or two areas are considered specialist (or SP).
• Research Activity – four levels of research activity are evaluated based on the number of academic papers recorded in the Scopus database over a ive-year period. Specialist institutions are assessed on the mean levels of publication for the disciplines in which they are active.
www.uq.edu.au/international
UQ International
CRICOS Pr
ovider Number 00025B
STUDY AT UQ
You will get a world-class degree with all the beneits of UQ’s international reputation. UQ is in the top 50 of the QS World University Rankings – the only university in Queensland to rank so highly. So you will get all the beneits of learning from some of Australia’s most awarded lecturers, at the forefront of their ields – and a world-class degree that carries UQ’s international reputation for excellence. With credentials like that, employers will be impressed.
The University is a founding member of the prestigious Group of Eight (Go8) — an alliance of Australian universities committed to maintaining the highest international standards. UQ is also one of only three Australian members of Universitas 21, an elite international network of leading research-intensive universities. Students at UQ choose from over 350 high-quality
undergraduate and postgraduate coursework and research programs, including PhD, Master of Philosophy, Research
Experience a world class education at The University of
Queensland. When you are competing for careers where tertiary
qualiications are standard, UQ will give you the edge you need.
and Coursework Masters, Graduate Diplomas, Graduate Certiicates and Bachelor degrees.
Students at UQ study across four superb South-East Queensland campuses at St Lucia, Herston, Ipswich and Gatton. UQ St Lucia, the University’s largest campus, is situated in Brisbane, a dynamic capital city known for its excellent climate, safe environment and superb quality of life. Visit the weblink below and ill in our online enquiry form to get in contact with your personal advisor to ind out more about furthering your career and advancing your education in one of the world’s best institutions.
Online enquiry form:
www.uq.edu.au/international/enquiry W: www.uq.edu.au/international
Our analysis of university performance in the ive main areas of academic life – the natural sciences, engineering and technology, life sciences and medicine, the social sciences, and the arts and humanities – is one of the most eagerly awaited parts of the QS World University Rankings®.
hese rankings are produced by taking the score from our academic reputation review for each of these faculty-level areas. here were 15,050 respondents to the academic review in 2010, including a small number of participants from previous years whose data was counted provided they had not voted since.
Subject specific
In this analysis we include specialist institutions (such as Rockerfeller University, a prestigious medical school in New York) but not postgraduate-only, single-faculty colleges such as the London Business School.
Despite Harvard’s fall from top spot in our overall rankings, it won our poll of academic opinion for biology and medical institutions comfortably. Its papers are the most-cited, apart from the much smaller biomedical outputs of MIT and Caltech. he US has seven of the top ten life sciences universities, with the UK and Japan taking the other three spots.
Our top ten in the natural sciences looks similar to the overall result for the QS World University Rankings®, with Harvard edged into an unfamiliar second spot by Cambridge, and only narrowly ahead of Oxford. he small but well-regarded output of Caltech makes it the top institution for citations. his table demonstrates the “big country efect” in action as US papers get more citations than
those from Japan or the UK. We may think research is truly global, but people are still more likely to cite people they know or who work at familiar institutions.
Probably no university is as envied around the world as the Massachusetts Institute of Technology (MIT). Institutions such as KAIST in Korea are deliberately modelled on it, and the European Commission has considered what it might take to create a European MIT.
Here MIT comfortably wins the poll for the world’s top engineering and technology university, defeating both its big Californian rivals and UK competition from the University of Cambridge and Imperial College London.
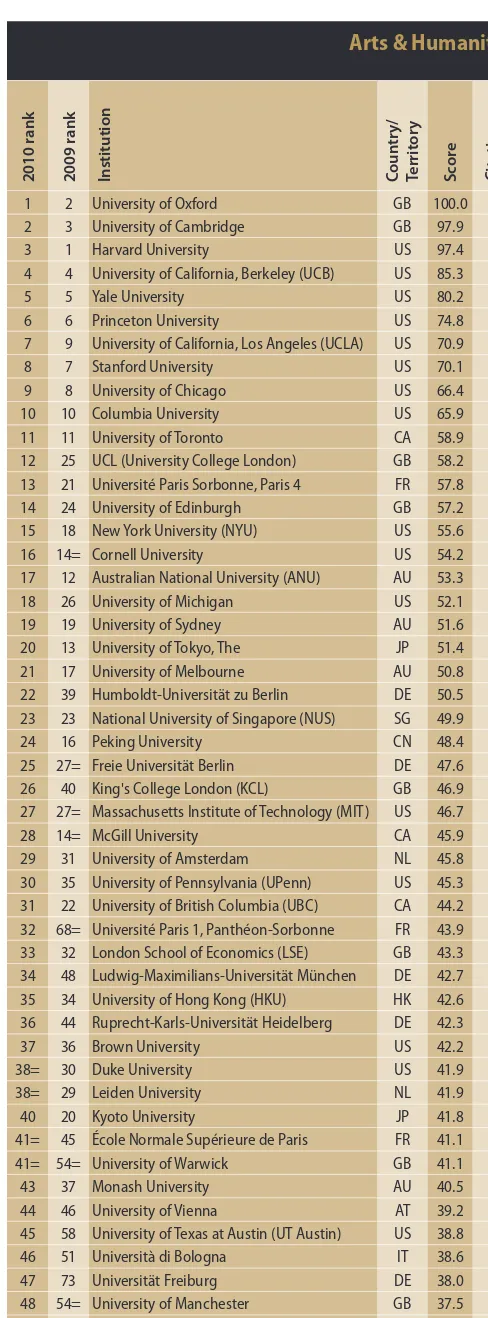
he UK has prominence in our arts and humanities survey. he universities of Oxford and Cambridge are in the top slots, and the UK occupies ten of the top 50 positions. London’s School of Oriental and African Studies appears at 50th position despite being 258th in the overall QS World University Rankings®. In future years it will be interesting to see whether Asia’s growing economic power is relected by increased prestige in the arts and humanities. Meanwhile, note the column of citations data. Most papers here are cited less than once, highlighting the very diferent publication style of the arts and humanities.
[image:18.637.307.551.160.819.2]Harvard also wins the reputation battle in the social sciences. his table also shows the London School of Economics and Political Science (LSE), whose specialist nature puts it 80th in the world overall, in fourth place, just behind Oxford and Cambridge.
Arts & Humanities
2010 r
ank
2009 r
ank
Institution Coun
tr y/ Territ or y S co re Cita
tions per paper
1 2 University of Oxford GB 100.0 0.8
2 3 University of Cambridge GB 97.9 1.0
3 1 Harvard University US 97.4 0.6
4 4 University of California, Berkeley (UCB) US 85.3 1.1
5 5 Yale University US 80.2 0.4
6 6 Princeton University US 74.8 0.7
7 9 University of California, Los Angeles (UCLA) US 70.9 0.9
8 7 Stanford University US 70.1 0.9
9 8 University of Chicago US 66.4 0.8
10 10 Columbia University US 65.9 0.5
11 11 University of Toronto CA 58.9 0.4
12 25 UCL (University College London) GB 58.2 0.6
13 21 Université Paris Sorbonne, Paris 4 FR 57.8 0.1
14 24 University of Edinburgh GB 57.2 0.8
15 18 New York University (NYU) US 55.6 0.7
16 14= Cornell University US 54.2 1.2
17 12 Australian National University (ANU) AU 53.3 1.3
18 26 University of Michigan US 52.1 0.5
19 19 University of Sydney AU 51.6 0.4
20 13 University of Tokyo, The JP 51.4 1.2
21 17 University of Melbourne AU 50.8 0.7
22 39 Humboldt-Universität zu Berlin DE 50.5 0.7
23 23 National University of Singapore (NUS) SG 49.9 1.4
24 16 Peking University CN 48.4 0.1
25 27= Freie Universität Berlin DE 47.6 0.3
26 40 King's College London (KCL) GB 46.9 0.7
27 27= Massachusetts Institute of Technology (MIT) US 46.7 2.4
28 14= McGill University CA 45.9 0.8
29 31 University of Amsterdam NL 45.8 0.9
30 35 University of Pennsylvania (UPenn) US 45.3 0.8 31 22 University of British Columbia (UBC) CA 44.2 0.8 32 68= Université Paris 1, Panthéon-Sorbonne FR 43.9 0.1 33 32 London School of Economics (LSE) GB 43.3 0.7 34 48 Ludwig-Maximilians-Universität München DE 42.7 0.5
35 34 University of Hong Kong (HKU) HK 42.6 0.9
36 44 Ruprecht-Karls-Universität Heidelberg DE 42.3 0.1
37 36 Brown University US 42.2 0.7
38= 30 Duke University US 41.9 0.6
38= 29 Leiden University NL 41.9 0.6
40 20 Kyoto University JP 41.8 1.1
41= 45 École Normale Supérieure de Paris FR 41.1 0.5
41= 54= University of Warwick GB 41.1 0.4
43 37 Monash University AU 40.5 0.8
44 46 University of Vienna AT 39.2 0.6
45 58 University of Texas at Austin (UT Austin) US 38.8 0.7
46 51 Università di Bologna IT 38.6 0.1
47 73 Universität Freiburg DE 38.0 0.5
48 54= University of Manchester GB 37.5 1.0
49 77 University of Leeds GB 37.4 0.5
Engineering & Technology
2010 r
ank
2009 r
ank
Institution Coun
tr y/ Territ or y S co re Cita
tions per paper
1 1 Massachusetts Institute of Technology (MIT) US 100.0 3.3
2 3 Stanford University US 83.3 3.5
3 2 University of California, Berkeley (UCB) US 82.7 4.1
4 4 University of Cambridge GB 72.5 3.5
5 5 California Institute of Technology (Caltech) US 68.3 3.7
6 6= Imperial College London GB 67.1 2.3
7 6= University of Tokyo, The JP 64.4 1.4
8 10 ETH Zurich CH 61.8 2.6
9= 11 University of Oxford GB 58.7 2.2
9= 14 National University of Singapore (NUS) SG 58.7 2.3
11 13 Tsinghua University CN 58.4 1.1
12 9 Carnegie Mellon University (CMU) US 55.1 2.5
13 12 Georgia Institute of Technology US 54.4 2.5
14 8 University of Toronto CA 54.1 2.8
15 18 University of California, Los Angeles (UCLA) US 53.4 3.4 16 25 University of Illinois at Urbana-Champaign US 52.5 2.4
17 16 Kyoto University JP 49.6 1.4
18 15 Delft University of Technology (TU Delft) NL 49.1 1.6
19= 41 University of Michigan US 46.3 3.0
19= 24 Cornell University US 46.3 3.3
21 23 Princeton University US 45.2 4.0
22 22 Harvard University US 45.1 3.9
23 19 Tokyo Institute of Technology JP 44.5 1.4
24 21 KAIST - Korea Advanced Inst. of Sci. & Tech. KR 44.2 1.8
25 38= University of Manchester GB 43.5 2.7
26 26 Hong Kong University of Sci. and Tech. HK 43.1 2.1 27 36 University of Texas at Austin (UT Austin) US 42.9 2.4
28 37 Purdue University US 42.8 1.5
29 20 McGill University CA 42.5 2.0
30 17 University of British Columbia (UBC) CA 42.4 2.0 31 44 Ecole Polytechnique Fédérale de Lausanne CH 41.9 2.5
32 29 University of Melbourne AU 41.6 2.5
33 31 Peking University CN 41.0 1.0
34 43 University of California, San Diego (UCSD) US 40.8 3.2
35 38= École Polytechnique, ParisTech FR 39.3 2.0
36= 45 Technische Universität München (TUM) DE 39.2 1.5 36= 33= Nanyang Technological University (NTU) SG 39.2 2.1
38 27= Seoul National University (SNU) KR 38.4 2.0
39= 27= University of Waterloo CA 37.8 1.7
39= 57= RWTH Aachen DE 37.8 2.1
41 47= National Taiwan University (NTU) TW 37.6 2.2
42 33= University of New South Wales (UNSW) AU 37.5 1.7 43 53= Shanghai Jiao Tong University (SJTU) CN 37.3 1.0
44 40 University of Sydney AU 37.2 2.1
45 42 Australian National University (ANU) AU 35.6 1.8
46 52 University of Edinburgh GB 35.5 1.9
47 30 Indian Institute of Technology Bombay (IITB) IN 35.0 1.8
48 62 Technische Universität Berlin DE 34.8 1.9
49 71= Universität Karlsruhe DE 34.3 1.9
50 49 Eindhoven University of Technology NL 33.7 2.5
Life Sciences & Medicine
2010 r
ank
2009 r
ank
Institution Coun
tr y/ Territ or y S co re Cita
tions per paper
1 1 Harvard University US 100.0 13.5
2 2 University of Cambridge GB 92.4 11.4
3 3 University of Oxford GB 82.2 11.9
4 4 Stanford University US 75.3 12.0
5 5 University of California, Berkeley (UCB) US 70.2 11.8
6 7 University of Tokyo, The JP 65.8 7.5
7 6 Johns Hopkins University US 65.7 11.4
8 8 Massachusetts Institute of Technology (MIT) US 63.9 16.2
9 9 Yale University US 63.3 11.2
10 18 University of California, Los Angeles (UCLA) US 60.0 11.0
11 17 Imperial College London GB 58.3 10.2
12 12 University of California, San Diego (UCSD) US 56.7 13.2 13 20 National University of Singapore (NUS) SG 53.6 6.2
14 13= University of Melbourne AU 52.9 7.9
15 22 UCL (University College London) GB 52.7 8.7
16 11 University of Toronto CA 51.7 8.8
17 34 University of Edinburgh GB 50.0 9.9
18 13= Kyoto University JP 49.7 8.2
19 15 University of Sydney AU 48.8 6.3
20 16 University of British Columbia (UBC) CA 48.7 8.4
21 19 Peking University CN 47.8 3.4
22 10 McGill University CA 45.7 9.6
23 29= Karolinska Institute SE 45.6 8.7
24 29= Columbia University US 45.1 11.9
25 26 Cornell University US 44.8 9.3
26 University of California, San Francisco US 44.6
27 31 Duke University US 43.6 11.5
28 23 California Institute of Technology (Caltech) US 43.4 15.3
29 44 University of Washington US 43.1 12.0
30 37 King's College London (KCL) GB 42.6 8.2
31 33 University of Chicago US 42.4 11.2
32 49 ETH Zurich CH 41.4 10.6
33= 39 University of Pennsylvania (UPenn) US 40.6 10.5
33= 35 University of Michigan US 40.6 10.6
35 27 Princeton University US 40.4 11.5
36 21 Australian National University (ANU) AU 40.3 7.4
37 32 University of Hong Kong (HKU) HK 38.5 8.0
38 24 Seoul National University (SNU) KR 38.1 5.0
39 54 University of Manchester GB 36.7 8.4
40 28 University of Queensland (UQ) AU 36.4 7.1
41 40 University of Auckland NZ 36.2 6.8
42 45= Washington University in St. Louis US 35.8 11.4
43 45= National Taiwan University (NTU) TW 34.6 5.0
44 38 University of California, Davis (UCD) US 34.5 7.7 45 42 Ruprecht-Karls-Universität Heidelberg DE 34.1 8.4 46 43 University of New South Wales (UNSW) AU 33.9 6.9
47= 50 University of Wisconsin-Madison US 33.4 9.4
47= Rockefeller University US 33.4
49 25 Monash University AU 33.3 7.2
Natural Sciences
2010 r
ank
2009 r
ank
Institution Coun
tr y/ Territ or y S co re Cita
tions per paper
1 1 University of Cambridge GB 100.0 9.7
2 4 Harvard University US 91.8 13.7
3 5 University of Oxford GB 91.1 9.8
4 2 Massachusetts Institute of Technology (MIT) US 87.8 11.0 5 3 University of California, Berkeley (UCB) US 87.7 12.9
6 9 Stanford University US 76.4 10.8
7 6 Princeton University US 73.7 12.4
8 7 California Institute of Technology (Caltech) US 71.6 15.4
9 8 University of Tokyo, The JP 69.4 6.8
10 12 ETH Zurich CH 67.5 9.4
11 10= Imperial College London GB 66.4 8.8
12 13 École Normale Supérieure de Paris FR 57.6 8.3
13 10= Kyoto University JP 57.4 6.3
14 14 University of Toronto CA 57.2 9.7
15 16 University of California, Los Angeles (UCLA) US 57.1 11.1
16 17 University of Chicago US 54.5 13.6
17 18 Yale University US 54.1 11.3
18 20 University of British Columbia (UBC) CA 52.4 9.3
19 15 Cornell University US 52.2 10.9
20 21 Australian National University (ANU) AU 50.6 7.4
21 19 Peking University CN 49.0 5.1
22 22 Université Pierre et Marie Curie (UPMC) FR 48.2 7.5
23 24 Columbia University US 47.0 11.6
24 37= Ruprecht-Karls-Universität Heidelberg DE 46.4 8.1 25= 27 National University of Singapore (NUS) SG 45.7 5.7 25= 43 Ludwig-Maximilians-Universität München DE 45.7 8.0
27 30= Tsinghua University CN 43.9 4.0
28 32 University of California, Santa Barbara US 43.5 11.9 29 30= Lomonosov Moscow State University RU 43.4 2.5
30 25 Sapienza Università di Roma IT 43.1 5.6
31 28= École Polytechnique, ParisTech FR 42.9 8.2
32= 23 University of Melbourne AU 41.7 8.8
32= 41 Technische Universität München (TUM) DE 41.7 7.1 34 37= University of Illinois at Urbana-Champaign US 41.0 10.6
35 26 McGill University CA 40.5 7.9
36 34 University of Sydney AU 39.4 7.5
37 40 University of California, San Diego (UCSD) US 39.2 9.0
38= 47 University of Michigan US 38.4 10.6
38= 28= Seoul National University (SNU) KR 38.4 6.1
40 94= University of Bristol GB 38.3 8.3
41= 61 University of Edinburgh GB 38.1 10.9
41= 42 University of Texas at Austin (UT Austin) US 38.1 10.3
43 44 Université Paris 11, Sud FR 36.2 7.3
44= 98 Humboldt-Universität zu Berlin DE 36.0 7.3
44= 33 Technion - Israel Institute of Technology IL 36.0 6.0 44= 107= Rheinische Friedrich-Wilhelms-Universität DE 36.0 8.3
47 72 University of Copenhagen DE 35.5 7.9
48 35 Utrecht University NL 35.2 8.1
49 46 Ecole Polytechnique Fédérale de Lausanne CH 35.0 9.3
50= 60 UCL (University College London) GB 34.9 8.1
Social Sciences & Management
2010 r
ank
2009 r
ank
Institution Coun
tr y/ Territ or y S co re Cita
tions per paper
1 1 Harvard University US 100.0 4.5
2 3 University of Oxford GB 90.3 2.8
3 4 University of Cambridge GB 89.7 3.0
4 5 London School of Economics (LSE) GB 84.1 2.9
5 2 University of California, Berkeley (UCB) US 83.7 3.8
6 6 Stanford University US 80.5 4.6
7 7 University of Chicago US 74.1 3.4
8 8 Yale University US 72.9 4.0
9 10 Columbia University US 68.7 3.7
10 9 Princeton University US 67.2 5.3
11 14 University of California, Los Angeles (UCLA) US 66.5 3.7 12 12 Massachusetts Institute of Technology (MIT) US 64.8 6.0 13 11 Australian National University (ANU) AU 61.0 2.2
14 23 University of Michigan US 56.8 4.3
15 24 University of Pennsylvania (UPenn) US 56.4 3.9 16 20 National University of Singapore (NUS) SG 56.0 1.9
17 15 University of Toronto CA 55.6 2.8
18 13 University of British Columbia (UBC) CA 54.8 3.4
19 22 New York University (NYU) US 54.3 3.7
20 16 University of Tokyo, The JP 53.9 1.4
21 19 University of Melbourne AU 49.9 2.1
22 18 Cornell University US 49.8 3.4
23 21 Peking University CN 47.8 1.3
24 33 University of Warwick GB 46.7 2.5
25 28 UCL (University College London) GB 46.5 3.0
26 25 Duke University US 46.4 4.0
27 17 McGill University CA 46.1 2.4
28 31 Northwestern University US 45.6 4.1
29 39 University of Manchester GB 45.1 3.0
30 27 University of Sydney AU 44.0 1.8
31 44 University of Wisconsin-Madison US 43.2 4.0
32 32 University of Amsterdam NL 41.9 3.1
33 35 University of New South Wales (UNSW) AU 41.0 2.0
34 26 Monash University AU 40.7 1.6
35 34 University of Hong Kong (HKU) HK 40.3 1.7
36 93 University of Texas at Austin (UT Austin) US 39.3 2.8 37 74 Université Paris 1, Panthéon-Sorbonne FR 38.1 0.9
38 37 University of Auckland NZ 38.0 3.0
39 29 Kyoto University JP 37.0 1.5
40 77= Ludwig-Maximilians-Universität München DE 36.8 2.6
41 48 University of Edinburgh GB 36.7 2.8
42 30 Seoul National University (SNU) KR 36.4 1.2
43 58= Chinese University of Hong Kong (CUHK) HK 35.9 2.0 44 68= University of Illinois at Urbana-Champaign US 35.5 3.8 45 102= University of North Carolina, Chapel Hill US 35.0 3.7
46= 45 King's College London (KCL) GB 34.9 4.0
46= 43 Tsinghua University CN 34.9 0.7
“ The IELTS
test opened
the door
for me”
IELTS is the world’s
most popular high stakes
English language test.
• IELTS is now used by over 1.4 million people every year
• More than 6,000 organisations worldwide accept
and recognise IELTS scores, including over 3,000
US institutions and programs
• IELTS includes all major varieties of English –
American, British and Australian
here have been many discussions and much research around the notion of a “World Class University”; the importance of it to governments, employers, investors, alumni, students, applicants and the universities themselves. herefore the measurement of a world class university is critical. here is general agreement that the main factors to consider when looking at a world class university are: the excellence in education of its students; its research, development and dissemination of knowledge; and its activities contributing to
the cultural, scientiic, and civic life of society.i
According to the paper from Columbia University, What is a World Class University?, excellence in education refers to the resources and organization of undergraduate, graduate, and professional instruction and educational opportunities for students. hey go on to discuss further that this goal requires outstanding faculty, high quality teaching and other instructional activities, as well as availability of good libraries, laboratories, and other pertinent facilities.
Taking these factors into consideration, what do students require to make the necessary decision on where to spend the most important years of their education? How do they ind out about the level of research or the cultural society of an institution? Many of these questions have been answered in recent years with the birth of the QS World University Rankings®. hese rankings identiied four key pillars upon which a “World Class University” can be built, and as a basis for evaluation, used them as criteria under which indicators have been chosen to evaluate universities globally. hese pillars are research quality, teaching quality, graduate employability and international outlook.
Evaluating quality
Expanding on these pillars, QS has derived a new evaluation system, QS Stars. his system acknowledges and benchmarks universities
against the factors mentioned above, allowing students to look beyond rankings and assess the institutions on a deeper level, assisting them in their decision-making process.
Many universities have “World-Class” attributes such as outstanding faculty and excellent teaching quality, and excel in a particular subject area. However due to the nature of the rankings, their excellence may not have received the credit that is due. QS Stars give a university the opportunity to highlight its strengths via awarded recognition. Universities are awarded with a badge that displays their number of stars; they also receive an evaluation report called “he Development Roadmap”. his report highlights a university’s key strengths in the evaluation and areas for improvement.
he QS Stars system covers eight major indicators: research quality, graduate employability, teaching quality, infrastructure, internationalization, innovation and knowledge transfer, third mission and a rank in a specialist subject area. Universities are assessed against these indicators and are awarded with stars based on the criteria that the institution can meet. Each indicator is divided into several sections with an allocation of points, covering the majority of aspects needed in a detailed evaluation. An institution would need to meet each of the indicator requirements in order to earn the maximum number of points; the institution is then awarded with their star status
depending on the number of points achieved through the evaluation.
Star status
QS Stars has already seen a strong interest from many universities and governments worldwide. Institutions currently being evaluated include IE University in Spain, Binus University in Indonesia and Nanyang Technological University (NTU) in Singapore. Professor Bertil Andersson, Provost, Nanyang Technological University, talks about QS Stars: “NTU is undergoing rapid development and the current ranking from QS is a conirmation that NTU today has a high international standing. NTU is participating in a QS Stars audit to establish our strengths as a university across a broader set of criteria than can be measured in any ranking system, to provide valuable information for our many stakeholders: students, employers, fellow academics as well as our local community.”
QS Stars helps universities in their international marketing approach; it also beneits those institutions where English is not their irst language. he QS Stars evaluation complements the QS World University Rankings®, as it allows students to get the best of both by providing them with a more detailed overview of their selected institutions.
i. What is a World Class University? Henry M. Levin, Dong Wook Jeong, Dongshu Ou
Deena Al Hilli
Develop your professional
career in a modern
European university,
leader in promoting
high-quality research,
located in an important
scientific and
technological pole.
Universitat Autònoma
de Barcelona is known
for the top quality of its
teaching and innovation
and the wide range of
graduate programmes
it offers.
Promoting knowledge,
encouraging innovation
UNIVERSITAT AUTÒNOMA
DE BARCELONA
A CAMPUS OF INTERNATIONAL EXCELLENCE
Contact us at:
www.uab.es
CAMPUS OF INTERNATIONAL EXCELLENCE
Since its establishment in 1592, Trinity College
Dublin has expanded over the centuries to
become a modern university with an enviable
history. Trinity today continues to be at the
cutting edge of research, technology and
innovation placing the university at the
forefront of higher education in Ireland and
internationally.
Situated at the very heart of Dublin, one of
Europe’s liveliest cities, Trinity’s city-centre
location means it enjoys strong links with the
cultural heart of Dublin. With over 16,000
students representing in excess of 90
different nationalities Trinity College offers its
students a truly diverse, cosmopolitan and
international experience.
Technologically advanced libraries,
laboratories and IT facilities have been
seamlessly integrated into the historic
campus. A state of the art nanoscience
complex and the world’s first Science Gallery
sit alongside atmospheric leafy quads,
traditional cobbled squares and a world
famous library. With three large faculties
offering over 400 academic programmes, a
modern sports centre and an unrivalled
position in Dublin’s city centre, there is no
better place to study in Ireland.
Discover why Trinity is one of the
great universities of the world at:
www.tcd.ie/internationa
l.
Your future starts here.
University of Dublin
Trinity College
Study in one of the world’s great universities