Michael Baker is a professor of economics at the University of Toronto and a faculty research fellow of the NBER. Mark Stabile is an associate professor of economics at the University of Toronto and a faculty research fellow of the NBER. Catherine Deri is an assistant professor of economics at the University of Ottawa. This is an updated and revised version of Baker, Stabile, and Deri (2001). The authors gratefully acknowledge the research support of SSHRC (Baker, Grant # 410-99-0112), CIHR (Baker and Stabile, Grant # MOP-53133) the Institute for Clinical and Evaluative Sciences (Stabile and Deri). The authors would like to thank John Bound, John Ham, David Cutler, the referees, and seminar participants at vari-ous workshops for helpful comments. The data can be obtained through application to the Ontario Ministry of Health and Long Term Care.
[Submitted November 2002; accepted July 2003]
ISSN 022-166XE-ISSN 1548-8004 © 2004 by the Board of Regents of the University of Wisconsin System
T H E J O U R NA L O F H U M A N R E S O U R C E S ● X X X I X ● 4
Measures of Health Measure?
Michael Baker
Mark Stabile
Catherine Deri
A B S T R A C T
Survey reports of the incidence of chronic conditions are considered by many researchers to be more objective, and thus preferable, measures of unobserved health status than self-assessed measures of global well being. In this paper we evaluate this hypothesis by attempting to validate these “objective, self-reported” measures of health. Our analysis makes use of a unique data set that matches a variety of self-reports of health with respon-dents’ medical records. We find that these measures are subject to consider-able response error resulting in large attenuation biases when they are used as explanatory variables.
I. Introduction
records of specific illnesses or information on subsequent mortality as proxies for health (Bound and Burkhauser 1999). The argument is that these measures are based on very specific questions, which by their nature constrain the likelihood that respondents rationalize their own behavior through their answers.
The enthusiasm for these objective measures has influenced survey design. For example, questions capturing the incidence of specific ailments in the Health and Retirement Study (HRS) have this source, as the following passage from the survey documentation reveals.
. . . the Health Conditions and Health Status Working Group was persuaded that the most important dimension to measure was functional health, not disease epi-demiology. Some potential users of the data took a different view: that a basic inventory of important medical conditions would not only satisfy the demands of an important class of analytic users, but also might be less susceptible to misre-porting because of the causality problem involving the relation of health to work (The Early HRS and AHEAD Surveys,Revised August 4, 1999).
Implicit in arguments for the superiority of these measures is an assumption that they can be validated. Their advantage is that they record the factsof an individual’s cur-rent and/or past medical conditions rather than their opinionson their physical well-being. Facts can be checked.
In this paper we attempt to validate the self-reported measures of specific ailments contained in the 1996/97 Canadian National Population Health Survey (NPHS). This is a nationally representative survey of health including measures of (1) self-reported global health, (2) specific work and activity limitations, and (3) the self-reported inci-dence of specific ailments. The validation exercise is made possible by a link between the data for respondents in the province of Ontario and diagnosis/treatment informa-tion (following the Internainforma-tional Classificainforma-tion of Diseases standard—9 revision, ICD-9) taken from Ontario Health Insurance Plan (OHIP) records for these same indi-viduals from the survey and preceding five years. OHIP is a public healthcare program financed out of tax revenues, which covers all individuals in the province subject to certain residency requirements. Because private alternatives to public health are either prohibited by law or are relatively very expensive (for example, going to U.S. health-care providers1), these OHIP records should provide a very complete record of the diagnoses and treatments of these individuals over the period.
We investigate the “measurement error” in the NPHS variables, on the assumption that the medical records are the “truth” that the questions attempt to capture. We begin quantifying the incidence of “false positives” and “false negatives” in the self-reports of the major disease categories. For many of the diseases we find that more than 50 percent of the individuals who have a diagnosis in the OHIP data fail to report having the disease. Similarly, frequently more than 50 percent of individuals who report hav-ing a disease have no correspondhav-ing OHIP record. We next conduct a series of exer-cises to bound the measurement error and show that while there is likely some error in the OHIP data the majority of the error that we find comes from the NPHS.
We then quantify the measurement error using tools familiar from studies of measurement error in labor market data. Estimates of the proportional bias when the self-reports of ailments are used as the (sole) explanatory variable in a regression average around 0.5 and range from 0.2 to as large as 0.9. These estimates are larger than comparable calculations (in past studies) for labor earnings, but of the same mag-nitude as estimates for hourly earnings. It is important to note, however, that researchers are typically not interested in the effects of specific ailments on labor mar-ket activity, but instead the effects of some underlying work capacity that presumably both objective and subjective self-reported health variables measure with error.
In the final sections we test and find evidence for the “justification hypothesis” and investigate how the error in self-reported health varies with the intensity of a condi-tion. We also formally test whether the information provided by the self-reports and OHIP records is identical, conditional on observable characteristics.
II. The Data
The 1996/97 NPHS is a nationally representative survey of over 81,000 Canadians conducted in the last three quarters of 1996 and first quarter of 1997. While some minimal information was collected for all members of each house-hold, a randomly selected member who was 12 years of age or older participated in the in-depth interview. The information collected included various measures of health status, use of health services, and the presence of various risk factors. A limited amount of demographic and socioeconomic information also was collected.
Just over 37,000 individuals were interviewed for the Ontario sample. Individuals completing the in-depth interview were requested to supply their Ontario health num-ber, which is used for all publicly insured services in the province. The claims (OHIP) records for these individuals for the five years prior to their NPHS interview date have been linked to the survey responses by the Ontario Ministry of Health in collabora-tion with Statistics Canada. Ninety-five percent of the Ontario respondents provided their health card numbers and consented to the linkage of the records. Through match-ing by health card number, name, and birth date, 66 percent of those who agreed to have information linked to administrative data bases were actually linked, leaving a working sample of 23,151 individuals. The remaining health card numbers were either not collected by the interviewer or not considered suitable for matching by the Ontario Ministry of Health and Statistics Canada.
The main elements of the OHIP data are the code for service provided, the date of service, one associated diagnosis (ICD-9 code), and fee paid. Therefore, diagnosis of a new disease and/or treatment of an ongoing condition that involved a healthcare provider that can claim under OHIP should be captured in these data.2
The Journal of Human Resources Table 1
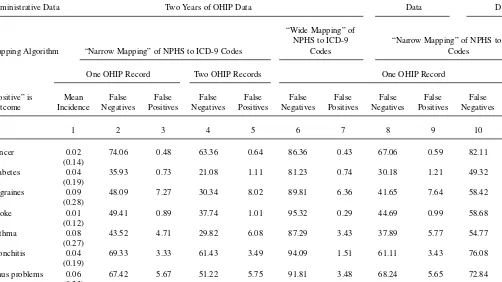
Summary of False Negative and False Positive Reporting by Chronic Condition
One Year of OHIP Five Years of OHIP
Administrative Data Two Years of OHIP Data Data Data
“Wide Mapping” of
NPHS to ICD-9 “Narrow Mapping” of NPHS to ICD-9 Mapping Algorithm “Narrow Mapping” of NPHS to ICD-9 Codes Codes Codes
One OHIP Record Two OHIP Records One OHIP Record
“Positive” is Mean False False False False False False False False False False Outcome Incidence Negatives Positives Negatives Positives Negatives Positives Negatives Positives Negatives Positives
1 2 3 4 5 6 7 8 9 10 11
Cancer 0.02 74.06 0.48 63.36 0.64 86.36 0.43 67.06 0.59 82.11 0.38
(0.14)
Diabetes 0.04 35.93 0.73 21.08 1.11 81.23 0.74 30.18 1.21 49.32 0.41 (0.19)
Migraines 0.09 48.09 7.27 30.34 8.02 89.81 6.36 41.65 7.64 58.42 6.10 (0.28)
Stroke 0.01 49.41 0.89 37.74 1.01 95.32 0.29 44.69 0.99 58.68 0.65
(0.12)
Asthma 0.08 43.52 4.71 29.82 6.08 87.29 3.43 37.89 5.77 54.77 2.92
(0.27)
Bronchitis 0.04 69.33 3.33 61.43 3.49 94.09 1.51 61.11 3.43 76.08 3.06 (0.19)
Sinus problems 0.06 67.42 5.67 51.22 5.75 91.81 3.48 68.24 5.65 72.84 5.44 (0.23)
Bak
er
, Stabile, and Deri
1071
Ulcers 0.03 78.51 2.72 71.30 2.88 91.43 1.85 67.63 2.73 81.46 2.36
(0.17)
Cataracts 0.04 63.75 1.62 52.95 2.50 94.08 0.87 59.26 2.15 1.05 65.89 (0.20)
Glaucoma 0.02 63.36 0.44 45.80 0.59 97.46 0.23 56.46 0.56 0.34 70.47 (0.13)
Hypertension 0.13 41.37 4.31 29.66 5.81 59.06 3.05 35.36 5.60 2.71 51.79 (0.34)
To relate these records to the survey responses we map the chronic conditions recorded in the NPHS into ICD-9 codes. This process is not straightforward, as nei-ther is the relationship between the ailments and the codes self-evident, nor is which codes get reported as a specific condition necessarily stable across healthcare providers. As a result, we construct two mappings that alternatively attempt to take a broad and very precise view of the relationship. The algorithms are reported in Appendix 1.
All of the 23,151 Ontario observations from the NPHS for individuals 12 and over that were valid for linkage to the respondent’s OHIP records are used in the majority of our analysis. In analysis of the relationship between health and labor-supply deci-sions, however, we exclude those under age 16 and those going to school. Our focus is on the ailments listed in Table 1. This set represents 65 percent of the chronic con-ditions captured in the NPHS, spans the concon-ditions used in previous studies,3and emphasizes ailments that are most likely to be diagnosed by the healthcare profes-sionals whose services are covered by OHIP. The conditions that were not included are food allergies, other allergies, epilepsy, acne, Alzheimer’s disease, heart disease, and urinary incontinence.
Our analysis sample has two structural problems that could potentially affect our inference. The first is potential sample selection bias resulting from the incomplete matching of survey and administrative records by Ontario health number. To address this issue we have compared the incidence of chronic conditions in the matched sam-ple and the comsam-plete samsam-ple (for examsam-ple, including individuals not matched) and find no statistically significant differences. We note that the Institute for Clinical and Evaluative Sciences in Ontario also examined the 1996/97 linked data set for evidence of sample selection in the linkage and concluded there was none (Bondy and Schultz 2001). Finally, we have made comparisons to the 1994/95 NPHS. The 1994/95 sur-vey is smaller, similarly structured, and has a higher match rate of health card num-bers (on the order of 95 percent; Williams, Irons, and Wu 1998). Pooling the data from the two surveys, we find no statistically significant differences in the incidence of chronic conditions (either by self-report or OHIP record). We also have estimated regressions of indicators of false positive or false negative reporting on the set of con-trols used in our analysis and a dummy for observations from the 1996/97 survey. For false positives the estimated coefficient on the dummy is small, negative, and statisti-cally significant for nine of 13 conditions. For false negatives, the estimate is small, positive, and statistically significant for ten of 13 conditions. As explained below, it is false positive reporting that causes the overwhelming majority of bias when using the self-reports in regressions. Therefore, the lower rates of false positives in the 1996/97 survey suggest that our results may be lower bounds for the true bias associated with these variables. We also note that these differences across the two surveys have no qualitative effect on our conclusions. In the 1994/95 data the rates of false negatives for most ailments average within three percentage points of the rates in the 1996/97 data off an average base of 53 percent. The exceptions are sinusitis and ulcers where there are differences of more than ten percentage points. The rates of false positives
average within 0.4 percentage points of each other off an average base of 4.8 percent. In every specification we present below the estimated coefficients from the 1994/95 data are similar so that our conclusions remain unchanged (see Baker, Stabile, and Deri 2001 for detailed results using the 1994/95 data).
The second structural problem is error in the OHIP records. Our validation exercise assumes the OHIP data are the truth, so any error in these data undermines our pur-pose. We perform a series of tests in the course of the analysis to better understand how our results are affected by any error in the OHIP records. Error in the adminis-trative data is also of concern to the Government of Ontario. The Ministry of Health and Long Term Care regularly reviews OHIP records. All claims are computer screened for “duplicate claims, parallel procedures, frequent repeat visits or major assessments, recurrent billing for highly priced services, habitual laboratory tests, and office visits billed regularly and concurrently with minor diagnostic tests.”4 The reviews also draw on patient complaints and service verification letters to randomly selected patients, reports from other program areas of the Ministry (such as hospitals) and detailed ad hoc analyses of the claims of individual physicians. In fiscal year 2001/02, just over 2,500 of the 23,000 healthcare providers who submitted claims were contacted by the Ministry as a result of the review process. The majority received “intervention letters” that inform and educate providers about minor irregu-larities in their claims. In a further 390 cases, the Ministry initiated a more serious recovery action to retrieve funds. Finally a further 100 cases were referred for peer review by a Medical Review Committee (MRC). Separate MRCs are maintained for medical, chiropody, chiropractic, dentistry, and optometry claims. In fiscal 2001/02 the total dollar value of funds retrieved by the recovery actions and MRC reviews was $12.8 million on total claims of $4.5 billion.5Alternatively, these more serious inves-tigations represent just over 2 percent of practicing healthcare providers in Ontario (Ontario Ministry of Health and Long Term Care 2002).
III. Previous Literature
Little previous research examines the reliability of self-reports of chronic conditions. Harlow and Linet (1989) survey the literature and uncover six studies. A common feature of this research is that it involves relatively unrepresenta-tive samples. For example, enrollees in a single American health insurance organiza-tion serve as the basis of more than one of these papers. Presumably the selecorganiza-tion of individuals into these plans limits the universality of any inference gained from these samples.
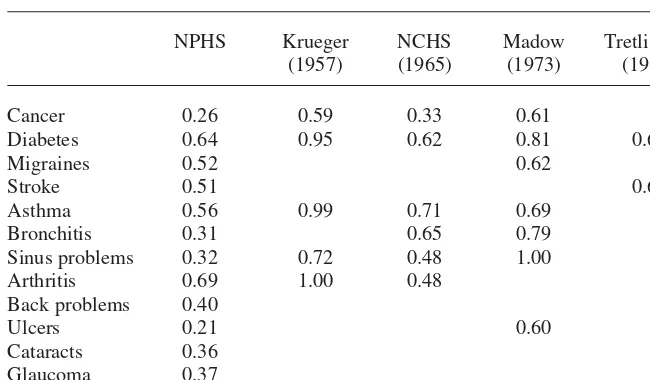
Comparisons across studies are hindered by differences in analytic approaches, in the questions asked about ailments and in the ways in which ailments are mapped into ICD codes. With these limitations in mind, in Appendix Table A1 we provide a comparison of some common summaries of the error in respondents’ reports from
4. This description is taken from the web page of the College of Physicians and Surgeons of Ontario:
http://www.cpso.on.ca/Info_ physicians/MRC/mrc.htm.
previous studies to similar statistics calculated from the NPHS.6While there are many differences in the levels of error across studies, there is some likeness in the relative magnitudes. Conditions such as bronchitis and sinusitis would appear to be more prone to over-reporting, while cancer appears to be more prone to under-reporting.
IV. Validating Self-Reported Measures of Health
Most previous validation studies in economics focus on individuals’ reports of labor market activity. The exercise is conceptually quite simple because the survey questions typically refer to recent and easily identifiable outcomes such as last year’s earnings or last week’s hours. Validating questions about health presents some special challenges. This is, in part, because individuals are naturally less familiar with disease epidemiology and the structure of health services than with the labor market and their own compensation. Survey questions must define what constitutes having an ailment in a way that is clear to respondents and amenable to mapping into the ICD codes used in medical records.
Consider, for example, the questions about individuals’ chronic conditions in the more familiar HRS. The 1992 HRS asks “Has a doctor ever told you that you have —————?” for a series of conditions. This is nominally a straightforward question that could be validated by access to individuals’ lifetime medical records. There are a number of potential problems, however. First, it shares the strong memory demands of any retrospective question that asks individuals to recall a lifetime of incidents. This problem is lessened in later waves of the survey that record changes since the last survey. Second, a definition of a doctor is not provided, so conversations with a wide variety of healthcare professionals may be recorded, or the definition of a doctor may vary across individuals. Third, the question does not ask whether a doctor has ever diagnosedthe ailment, and so will capture less formal discussions between doctor and patient that may not be recorded on the medical record. Each of these problems can complicate a validation exercise. Further, challenges are provided by the question used to canvass a different set of ailments: “Do you have any of the following health problems?”7It is not clear medical records would be the appropriate means to validate this part of the survey.
The questions recording specific ailments in the NPHS are somewhat different. Near the start of the relevant section of the survey, the following question is asked: “Now I’d like to ask about [your] contacts with health professionals during the past 12 months. In the past 12 months, how many times have [you] seen or talked on the telephone with ————— about your physical, emotional or mental health?” where the blank is filled in with a list of specific health professionals.8The next question
6. As described below, these statistics are calculated using the NPHS responses matched to two years of OHIP data.
7. The ailments investigated through this question are asthma, back problems, feet and leg problems, kidney or bladder problems, and stomach and intestinal ulcers.
draws a distinction between healthcare professionals and alternative healthcare providers by asking, “People may also use alternative healthcare services. In the past 12 months have [you] seen or talked to an alternative healthcare provider such as an acupuncturist, naturopath, homeopath, or massage therapist about your physical, emotional, or mental health?” Three pages on in the interview the question on specific ailments appears. It asks, “Now I’d like to ask about any chronic health conditions [you] may have. Again, “long-term conditions” refer to conditions that have or are expected to last six months or more. Do [you] have any of the following long-term conditions that have been diagnosed by a healthcare professional?” A list of specific ailments is then read.9Relative to the HRS, this question focuses on current experi-ence, defines a healthcare professional, and insists on a diagnosis. The focus on cur-rent experience comes at a cost, however. It is not clear whether a given medical record from an individual’s past identifies an ailment that the individual identifies as long term at the survey date.10
V. Measurement Error in Objective Measures
of Health
Individuals’ self-reports of chronic conditions are naturally coded as dichotomous variables. Error in these variables is typically discussed in terms of false negatives and false positives. In the present context false negatives arise when a respondent with an administrative record of a health problem does not report it. False positives arise if individuals report having a problem that doesn’t appear in the OHIP data. Using the “narrow mapping” of survey responses into ICD-9 codes we calculate the incidence of false negatives and positives in our data. The false positive rate is cal-culated as the proportion of individuals reporting an ailment within the subsample of individuals with no OHIP record of that ailment (NPHS=1 ⎪OHIP=0). The false negative rate is calculated as the proportion of individuals not reporting an ailment within the subsample with an OHIP record of that ailment (NPHS=0 ⎪OHIP=1). For this initial summary we use OHIP data from the two years preceding the interview to calculate these rates.
The results are reported in Columns 2 and 3 of Table 1. Seventy-four percent of those who have been diagnosed with cancer in the past two years do not report that they have cancer (false negative). Of the people who have no diagnoses of cancer in the past two years, half of a percent claimed that they had cancer (false positive). Across conditions the false negative rate is generally near or greater than 50 percent. The rates of false positives are smaller but vary more in proportional terms. The inci-dence of false positives is larger for conditions more likely to be self-diagnosed, such as arthritis and migraines.
False negatives can arise if (1) individuals do not feel comfortable reporting their conditions, (2) they have very short memories, (3) they were cured in the period between the date on which the treatment occurred and when the survey was con-ducted, or (4) doctors make preliminary diagnoses of conditions that ultimately prove false. While the first two accounts are clearly error in the NPHS variable, we consider the second two to be errors in the OHIP records. False positives can arise when (1) individuals are not telling the truth about their condition, (2) they self-diagnosed their ailment, (3) they misunderstand their ailment and self-report it as another, (4) respondents recently moved to Ontario (the respondent correctly reported the con-dition but was diagnosed by a physician in his/her former province or country), (5) doctors record the wrong diagnosis code or the diagnosis code for a second con-dition that the patient presented was used for billing purposes, or (6) individuals are telling the truth, but were last seen by a doctor for this condition more than two years prior to the interview year (recall that we are using two years of OHIP data for these calculations). Here, the first three accounts are errors in the self-reported NPHS variable, while the last three are errors in the OHIP records.
As we note above, any error in the OHIP data is of concern because it undermines the validation exercise. Therefore, we conduct a number of exercises in an attempt to bound the potential contribution of any OHIP based error to our results.
condition. As a result, the incidence of false positives increases, by 22 percent on average.
These exercises suggest that the majority of the false negatives we observe come from respondent error: either individuals forget they have an ailment or do not feel comfortable reporting it. Still another account of this error is that only those currently suffering from their aliment report having it. Those who have an ailment but are not currently experiencing symptoms interpret the question differently and do not. This is not error in the OHIP data per se, but rather suggests that the OHIP data are not suf-ficient for the validation exercise given the way respondents interpreted the question. To the extent we can evaluate this hypothesis, we do not believe it is the source of a large portion of the false negatives. The survey asks individuals who report asthma whether they have had any symptoms or asthma attacks in the past 12 months. Thirty-seven percent report having no symptoms or attacks. While this does not rule out some correlation between positive reports of chronic conditions and recent symptoms, it is evidence that the question is not exclusively picking out those “suffering” from a particular condition.
We next examine the various sources of false positives. To explore the fourth account we replicated the analysis on the subsample of respondents who had any type of OHIP claim/record in the previous two years (for example, not just a diagnosis of one of the chronic conditions). If all the false positives were due to a large number of respondents having just recently moved to Ontario (thus having no OHIP records for our purposes), this exercise should find a sharp decrease in the incidence of false positives. In fact, the decrease in false positives in moving to this sample is slight, indicating that migration is not driving this sort of error.11,12
The fifth account of false positives is that the doctor enters the wrong diagnosis code. Perhaps s/he enters Code 347 instead of 346 for migraines, or the code for a similar condition that is within the classification of diseases of the nervous system and sense organs. One way to discover if this type of error is important is to map the NPHS chronic conditions into the ICD-9 codes using the “broad mapping” algorithm discussed above (see Appendix 1). The broader bands will capture small (and quite large) deviations from the truth in the OHIP data and thus the incidence of false pos-itives should decrease. We use nine major disease categories from the ICD-9 classifi-cations that group diseases into major organs or bodily systems affected. Note we also expect the incidence of false negatives to be much higher, as the broader bands will capture diseases not investigated in the NPHS data. The results are reported in Columns 6 and 7 of Table 1. For some ailments the change in the incidence of false positives is quite small (for example, cancer, diabetes and migraines) while for others it falls more substantially (bronchitis and strokes). The average reduction is 32 per-cent. In almost all cases, the problem is not eliminated. Note also that as expected the incidence of false negatives is now much higher, the increase averaging 60 percent.
11. The results are not presented as a table but are available from the authors upon request.
Finally, the sixth account of false positives: the ailment was diagnosed before 1994 and has not required medical attention in the last two years. As noted above, strictly speaking we need individuals’ lifetime medical records to fully capture any condi-tions they may report. That said, as we add more years of medical records, the rate of false negatives will rise as we capture ailments that have been cured.
We adopt two approaches to this issue. In the first, we calculate the rates of false negatives and positives using the full five years of OHIP records that are available. We might expect a significant reduction in the rates of false positives if ailments diag-nosed in the more distant past are a primary source of false positives. The results are reported in final two columns of Table 1. The average reduction in the rate of false positives is 22 percent. While one might have expected the largest reductions for ail-ments such as back problems or arthritis, for which an initial diagnosis may not lead to an ongoing therapeutic regime, the reductions for these ailments, at 20 and 5 per-cent respectively, are relatively modest. The biggest reductions are instead observed for diabetes (44 percent), asthma (38 percent), and cataracts (35 percent). Finally, as expected, the rates of false negatives increase by an average 17 percent.
Our second approach is to calculate the rates of false positives separately for indi-viduals < 40 or ≥40 years of age. Either two or five years represents a greater propor-tion of lifetime for younger respondents. Therefore, we might expect lower rates of false positives in the younger sample and a larger effect of moving from two to five years of OHIP data. Testing this hypothesis is complicated, however, by the fact that the incidence of many ailments has a distinct age profile. Therefore, moving from two to five years of OHIP data may have very different effects on the rates of false posi-tives in the younger and older samples for an ailment like glaucoma. A further prob-lem arises if a source of some of the false positives is the justification hypothesis. Respondents justifying their absence from the labor force by reporting ailments that are relatively common for their age group will induce an age profile in the rates of false positives for conditions with a distinct age structure. For example, it is unlikely that a young worker would justify his/her absence from the labor market with a claim of having cataracts.
The importance of these observations is borne out in the results. For most ailments we observe much lower rates of false positives in the younger sample, but that mov-ing from two to five years of OHIP data leads to a greater reduction in the rate of false positives in the older sample. Furthermore, for each of these ailments incidence, measured by either the OHIP records or respondents’ self-reports, rises sharply with age.13In contrast, for migraines and asthma the rates of false positives are higher in the younger sample, and moving from two to five years of OHIP data leads to similar reductions in the rates of false positives in the younger and older samples. The inci-dence of these two ailments does not rise as sharply with age. The results for migraines arguably best approximate an “all else equal” scenario, where incidence is uncorrelated with age. Using five years of OHIP records, the incidence of migraines is 27 percent lower in the younger sample, while on the basis of respondents’ self-reports it is 17 percent lower. For this ailment, the rate of false positives is 18 percent
higher in the younger sample, in calculations using one, two, or five years of OHIP data. This reflects the fact that adding more years of OHIP data leads to equal pro-portionate reductions in the rates of false positives in the younger and older samples for this condition. We interpret this result as evidence that the rate of false positive reporting is not lower for younger respondents, once we account for any correlation of the incidence of ailments with age.14
As a final check we attempt to determine whether the absolute magnitudes of the errors in Table 1 are reasonable. To do this, we examine questions in the survey for which the OHIP data are almost surely the “truth.” We calculate the error in responses to the question “Have you seen a medical doctor or been an overnight patient in a hos-pital in the past 12 months.”15Since the doctor or hospital would need to bill OHIP to be paid, and the reference period for the question is within the bounds of our OHIP data, there is a much smaller chance of “spurious” false negative or false positive responses to this question. Here we find that 43 percent of those who had no OHIP record of any kind reported having been to the doctor or hospital (false positives) and nine percent of those with OHIP records claimed they had no visits (false negatives). Similarly, 26 percent of respondents who had no record of seeing an eye doctor in the past 12 months claim to have been to see one, and 20 percent of those who have an OHIP record from an eye doctor claim to have not gone.16
Finally, Hux et al. (2002) use the 1994/95 linked data combined with the Ontario Diabetes Database to compare survey and administrative incidences of diabetes. This study benefits from an additional administrative database that is maintained to track individuals with diabetes in Ontario. The authors report a higher rate of false negatives (56 percent) and lower rates of false positives (0.4 percent). This evidence suggests that the numbers in Table 1 are reasonable.
VI. Quantifying the Measurement Error
in Self-Reported Health
Assuming that the OHIP records provide a reasonable approximation of the truth the NPHS questions attempt to capture, we next estimate the magnitude of the measurement error in self-reported chronic conditions drawing on the frame-work presented in Bound et al. (1994) and Bound, Brown, and Mathiowetz (2001).
Suppose that we are interested in estimating the model
( )1 y=X*β ε+
14. The full set of results by age, using one, two, and five years of OHIP data, are available from the authors on request.
15. When computing the false positives and negatives we exclude all nonphysician OHIP records (namely health practioners) from the sample. This is necessary to properly match the question in the NPHS that asks about consultations with a medical doctor.
One of the explanatory variables, however, say xi*, is unobservable. Instead we
observe xiwhich measures xi* with error. More specifically, xi=xi* +vand vis
uncor-related with ε. If the measurement error is “classical,” then valso is uncorrelated with xi*. It is well known that in this case, and when xiis the only explanatory variable, the
proportional bias in estimating βi(minus the ratio of the bias to the true βi) is equal to
var(v)/(var(xi*) +var (v)).17
In the present case the measurement error is in a dichotomous variable, so it can-not be classical. If xi* =1 then xi−xi* ≤0, and if xi* =0 then xi−xi* ≥0. Therefore,
the errors in binary variables must be mean reverting, that is, cov(xi*, v) < 0. In this
case, the proportional bias in estimating βiis equal to the regression coefficient from
a hypothetical regression of von the set of measured explanatory variables. When xi
is the only explanatory variable, this is just bvx=cov(v, xi)/var(xi).18
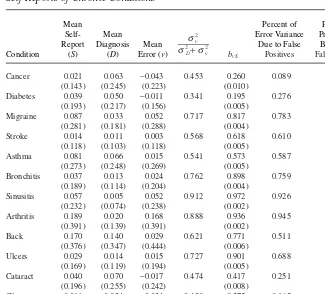
In Table 2 are estimates of the mean error in the self-reports of chronic conditions, as well as estimates of the proportional bias. We present both the noise to total vari-ance ratio as well as estimates of bvx, which we denote bvSwhere Sare the self-reports
from the NPHS data. The calculations are for the sample using two years of OHIP data. Consistent with the statistics in Table 1, the mean error for many of the chronic conditions is quite substantial, reflecting the fact that self-reported incidence can be more than double or less than one-half the incidence of the ailment in the OHIP data. False negatives are more prevalent for the diseases cancer, diabetes, cataracts, glau-coma, and hypertension so the mean error is negative. For the remaining ailments false positives are more prevalent.
For each of the 13 conditions the noise to total variance ratio (Column 4) is quite large. It ranges from 0.341 for diabetes to 0.912 for sinusitis. Most of the estimates lie in the interval 0.4 to 0.6.
The estimates of bvSare of similar magnitude, but are both smaller and larger than
the corresponding noise to total variance ratios. When the error is negatively corre-lated with the true value, the bias will be less than the variance ratio if the variance ratio is less than 0.5, and greater when the variance ratio is greater than 0.5. As a con-sequence, estimates of the proportional bias range from as low as 20 percent for dia-betes to almost 94 percent for arthritis. Particularly large biases also are estimated for ulcers, back ailments, arthritis, bronchitis, sinusitis, and migraines. Even for pre-sumably straightforward conditions like strokes, the estimated bias is more than 50 percent.
Estimates of the bias in labor market variables from previous studies provide some context for these results. Bound et al. (1994) report estimates of bvxfor (log) labor
market earnings ranging from 0.041 to 0.239, for annual hours of 0.184 to 0.305, and for hourly earnings of 0.598 to 0.737. Therefore, the estimates for some ailments are of comparable magnitude, while for others they are quite a bit larger.
We next investigate the relative contributions of false positives and negatives to the total error variance. We decompose s2vinto three components capturing the
contribu-tions of (1) false negatives, (2) false positives, and (3) the covariance of the two. In the sixth column of Table 2 we report the proportion of the total variance represented
17. As noted by Bound et al. (2001) the measurement error in xialso will bias the estimated parameters on the accurately measured explanatory variables.
by the false positives for the sample using two years of OHIP data. The contribution of false negatives is roughly one minus the false positives proportion.19The results are consistent with the preceding inference. For example, for cancer, false negatives account for roughly 90 percent of the total error variance, while for arthritis they account for only 4 percent.
To determine how the false positives and negatives contribute to the proportional bias that results from using self-reports of chronic conditions as the (sole) explanatory variable in a regression, we calculate a decomposition of bvSdue to Aigner (1973).
It is equal to
19. The contribution of the covariance is quite small in every case as the proportions due to false positives and false negatives almost add to one for every ailment.
Table 2
Summary Statistics and Decomposition of the Measurement Error in the NPHS Self-Reports of Chronic Conditions
Mean Percent of Percent of
Self- Mean Error Variance Proportional
Report Diagnosis Mean Due to False Bias Due to
Cancer 0.021 0.063 −0.043 0.453 0.260 0.089 0.806
(0.143) (0.245) (0.223) (0.010)
Diabetes 0.039 0.050 −0.011 0.341 0.195 0.276 0.899
(0.193) (0.217) (0.156) (0.005)
Migraine 0.087 0.033 0.052 0.717 0.817 0.783 0.978
(0.281) (0.181) (0.288) (0.004)
Stroke 0.014 0.011 0.003 0.568 0.618 0.610 0.991
(0.118) (0.103) (0.118) (0.005)
Asthma 0.081 0.066 0.015 0.541 0.573 0.587 0.948
(0.273) (0.248) (0.269) (0.005)
Bronchitis 0.037 0.013 0.024 0.762 0.898 0.759 0.989
(0.189) (0.114) (0.204) (0.004)
Sinusitis 0.057 0.005 0.052 0.912 0.972 0.926 0.996
(0.232) (0.074) (0.238) (0.002)
Arthritis 0.189 0.020 0.168 0.888 0.936 0.945 0.991
(0.391) (0.139) (0.391) (0.002)
Back 0.170 0.140 0.029 0.621 0.771 0.511 0.863
(0.376) (0.347) (0.444) (0.006)
Ulcers 0.029 0.014 0.015 0.727 0.901 0.688 0.987
(0.169) (0.119) (0.194) (0.005)
Cataract 0.040 0.070 −0.017 0.474 0.417 0.251 0.883
(0.196) (0.255) (0.242) (0.008)
Glaucoma 0.016 0.034 −0.034 0.439 0.275 0.165 0.916
(0.128) (0.181) (0.160) (0.008)
Hypertension 0.127 0.156 −0.029 0.431 0.355 0.347 0.781
(0.333) (0.363) (0.316) (0.006)
| ) ( | ), The first term is a function of false negatives while the second term is a function of false positives. In the final column of Table 2 we report the percent of the proportional bias due to false positives when the bias is broken down as in Equation 3. Perhaps sur-prisingly, in every case the majority of the bias is due to false positives. This might be expected for arthritis or migraines, but not for cancer where false negatives made the greater contribution to the error variance. Note, however, in the first term of Equation 3 the proportion of false negatives is divided by the proportion of the population who do not report the chronic condition. In most instances this denominator is fairly large and close to one. In the second term the numerator is the incidence of false positives in the population while the denominator is the proportion of the population who report having the chronic condition. The numerator of this term may be small, but so is the denominator, so the effect of the false positives has a large “factor loading.”
The analysis in Table 1 revealed that it is possible to “lower” the incidence of false negatives or positives in the data. A natural question is: do the reductions lead to large changes in the bias estimates? In each of the “experiments” in Table 1, however, low-ering one type of error came at the cost of raising the other type. Therefore, a com-parative static exercise is warranted that isolates the effect of the intended reduction in one type of error while negating the unintended increase in the other. To do this we calculate the bias holding one type of error constant at its level in the sample using two years of OHIP data and the narrow mapping of ICD-9 codes and allowing the other type of error to vary. For example, for the experiment in Columns 8 and 9 of Table 1 we calculate the bias holding the incidence of false positives constant at their rate in Columns 2 and 3, but using the rate of false negatives in the sample using one year of OHIP data (for example, the sample used in Columns 8 and 9).
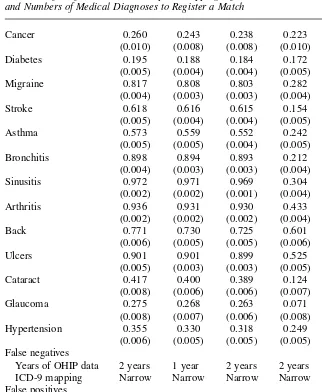
In the first column of Table 3 are the estimates from Table 2 as a point of compar-ison. Either of the experiments that lower the rates of false negatives (Columns 2 and 3) have little effect on the estimate of the bias, consistent with the inference from Table 2 that it is false positives that play the crucial role.
In Column 4, using the wide mapping of ICD-9 codes to calculate the false posi-tives, we observe some substantial reductions in the bias, particularly for migraines, strokes, asthma, bronchitis, sinusitis, arthritis, ulcers, cataracts, and glaucoma. We motivated the wide mapping by the possibility that healthcare professionals miscoded a diagnosis. Another possibility is that respondents cannot distinguish between related ailments and so group them into familiar categories. Hence, bad headaches are reported as migraines. Strictly speaking this is error in the NPHS data not in the OHIP data. In fact, we may unwittingly be accounting for response bias through the justifi-cation hypothesis with the wide mapping. Individuals may “upgrade” their ailments to more serious ones to justify their labor market status.
five years of OHIP data. The bias estimates are modestly lower, but still quite consis-tent with the original inference.
Table 3 provides a range of bias estimates. In most cases the estimates are as large as or larger than estimates for labor market earnings or hours. Remember, however,
Table 3
Estimates of bvSfor Alternative Samples, Mappings of Ailments into ICD-9 Codes
and Numbers of Medical Diagnoses to Register a Match
Cancer 0.260 0.243 0.238 0.223 0.211
(0.010) (0.008) (0.008) (0.010) (0.010)
Diabetes 0.195 0.188 0.184 0.172 0.116
(0.005) (0.004) (0.004) (0.005) (0.005)
Migraine 0.817 0.808 0.803 0.282 0.671
(0.004) (0.003) (0.003) (0.004) (0.004)
Stroke 0.618 0.616 0.615 0.154 0.457
(0.005) (0.004) (0.004) (0.005) (0.005)
Asthma 0.573 0.559 0.552 0.242 0.347
(0.005) (0.005) (0.004) (0.005) (0.005)
Bronchitis 0.898 0.894 0.893 0.212 0.811
(0.004) (0.003) (0.003) (0.004) (0.004)
Sinusitis 0.972 0.971 0.969 0.304 0.939
(0.002) (0.002) (0.001) (0.004) (0.002)
Arthritis 0.936 0.931 0.930 0.433 0.879
(0.002) (0.002) (0.002) (0.004) (0.003)
Back 0.771 0.730 0.725 0.601 0.566
(0.006) (0.005) (0.005) (0.006) (0.006)
Ulcers 0.901 0.901 0.899 0.525 0.783
(0.005) (0.003) (0.003) (0.005) (0.005)
Cataract 0.417 0.400 0.389 0.124 0.284
(0.008) (0.006) (0.006) (0.007) (0.007)
Glaucoma 0.275 0.268 0.263 0.071 0.214
(0.008) (0.007) (0.006) (0.008) (0.008)
Hypertension 0.355 0.330 0.318 0.249 0.240
(0.006) (0.005) (0.005) (0.005) (0.005) False negatives
Years of OHIP data 2 years 1 year 2 years 2 years 2 years ICD-9 mapping Narrow Narrow Narrow Narrow Narrow False positives
Years of OHIP data 2 years 2 years 2 years 2 years 5 years ICD-9 mapping Narrow Narrow Narrow Wide Narrow Reference columns
that our estimates assume that the primary interest is the effect of OHIP recorded con-ditions on the dependent variable. More likely our interest is in unobserved work capacity, which presumably both the self-reports and OHIP records measure with error.
VII. The Justification Hypothesis
The literature on self-reported health suggests that one reason for mis-reporting is that individuals use health to justify their decision not to work. Because health is a socially acceptable reason to be out of the labor force, individuals who face poor labor market opportunities may rationalize their absence from the labor market by reporting poor health. To investigate this possibility, we examine the relationship between false positives and labor force status. If individuals with poor labor market opportunities use health to justify their absence from the labor force we might expect that the incidence of false positives would be higher for nonworkers than for workers. We estimate linear probability models20for each of the chronic conditions of the form
( )4 (NPHS=1&OHIP=0)i=γ0+γ1worki+Xlλ1+η1i
limiting our sample to the potential working age population (16 years of age and older and not currently in school). The dependent variable is equal to one if an individual self-reports having a given chronic condition (NPHS = 1) and the OHIP data has no record of the condition (OHIP = 0), and zero otherwise. Workis equal to one if the individual is currently working and zero otherwise. X includes a quartic in age, dummy variables (Equation 5) for educational attainment and dummies for sex, resi-dence in an urban area, and marital status. As an alternative specification, we restrict our sample to individuals whose OHIP records indicate they do not have a chronic condition (OHIP = 0). The dependent variable is (NPHS = 1ÔOHIP = 0). Finally, we run a regression using the sample of workers and replacing workwith a dummy variable indicating full-time (versus part-time) work. Because our interest is false pos-itives, we use five years of OHIP data as this provides the most complete medical his-tory for individuals in our sample and minimizes the possibility of spurious error.21
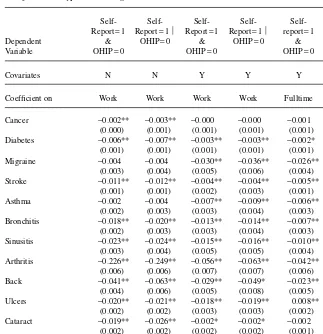
Estimates of the parameter on workare reported in Table 4. The results in the first column are for Equation 4 excluding X. The estimates are negative for all 13 chronic conditions and statistically significant for all but migraines and asthma. Similar re-sults (Column 2) are obtained when we restrict the sample to individuals with no OHIP record of the relevant chronic condition (NPHS = 1 ⎪OHIP = 0).22
20. The magnitude and significance of the coefficients are similar when we reestimate Equation 4 using a probit specification.
21. We have rerun the above analysis using the wide mapping of ICD-9 codes, obtaining similar results for diabetes, migraines, arthritis, ulcers, and cataracts. Results for other conditions have similar signs but are no longer statistically significant when other covariates are included. This result is consistent with individuals justifying their labor supply behaviour by relabeling their actual condition as a more serious one (a headache as a migraine for example). A table of these results is available from the authors upon request.
In Columns 3 and 4 we add the control variables X.We consistently find that work-ing is negatively correlated with false positive reportwork-ing for all of the conditions except cancer. For some of these conditions it is possible that individuals were diagnosed outside our five-year window. Arthritis is an example. We also find statis-tically significant coefficients, however, for conditions such as diabetes where it is quite unlikely that an individual would not receive treatment or consultation over a five-year period.
Table 4
Justification Hypothesis Regressions: Five Years Administrative Data
Self- Self- Self- Self- Self-
Self-Report=1 Report=1 ⎪ Report=1 Report=1 ⎪ report=1 Report=1 ⎪ Dependent & OHIP=0 & OHIP=0 & OHIP=0
Variable OHIP=0 OHIP=0 OHIP=0
Covariates N N Y Y Y Y
Coefficient on Work Work Work Work Fulltime Fulltime
Cancer −0.002** −0.003** −0.000 −0.000 −0.001 −0.000 (0.000) (0.001) (0.001) (0.001) (0.001) (0.001) Diabetes −0.006** −0.007** −0.003** −0.003** −0.002* −0.002*
(0.001) (0.001) (0.001) (0.001) (0.001) (0.001) Migraine −0.004 −0.004 −0.030** −0.036** −0.026** −0.030**
(0.003) (0.004) (0.005) (0.006) (0.004) (0.005) Stroke −0.011** −0.012** −0.004** −0.004** −0.005** −0.005**
(0.001) (0.001) (0.002) (0.003) (0.001) (0.001) Asthma −0.002 −0.004 −0.007** −0.009** −0.006** −0.007**
(0.002) (0.003) (0.003) (0.004) (0.003) (0.003) Bronchitis −0.018** −0.020** −0.013** −0.014** −0.007** −0.008**
(0.002) (0.003) (0.003) (0.004) (0.003) (0.003) Sinusitis −0.023** −0.024** −0.015** −0.016** −0.010** −0.011**
(0.003) (0.004) (0.005) (0.005) (0.004) (0.004) Arthritis −0.226** −0.249** −0.056** −0.063** −0.042** −0.046**
(0.006) (0.006) (0.007) (0.007) (0.006) (0.006) Back −0.041** −0.063** −0.029** −0.049* −0.023** 0.039**
(0.004) (0.006) (0.005) (0.008) (0.005) (0.007) Ulcers −0.020** −0.021** −0.018** −0.019** 0.008** −0.009**
(0.002) (0.002) (0.003) (0.003) (0.002) (0.003) Cataract −0.019** −0.026** −0.002* −0.002* −0.002 −0.001 (0.002) (0.002) (0.002) (0.002) (0.001) (0.002) Glaucoma −0.005** −0.005** −0.003** −0.003** −0.003** −0.003**
(0.001) (0.001) (0.001) (0.001) (0.001) (0.001) Hypertension −0.019** −0.040** −0.010** −0.014** 0.004* −0.006*
(0.002) (0.004) (0.003) (0.004) (0.002) (0.003)
The magnitudes of the coefficients are quite significant when considered as a per-centage of all false positives. From Column 3 we see that working reduces the proba-bility of falsely reporting migraines by three percentage points. While alone this number may seem small, it is 48 percent of all false positives for this condition. Similar calculations reveal that, as a percentage of all false positives for the ailment, working decreases the probability of false positives for asthma by 24 percent, bronchitis by 42 percent, sinusitis by 26 percent, arthritis by 31 percent, and ulcers by 72 percent.
Finally, we restrict the sample to workers and use the full-time dummy as an explanatory variable. The results, reported in Columns 5 and 6, again suggest that individuals may be using health to justify their work status. For either specification the coefficient on working full-time is negative and statistically significant for 11 of 13 chronic conditions.
An interesting question is whether the probability of false positives is systemati-cally correlated with other observable characteristics. Two potentially important char-acteristics are age and education. There is no systematic pattern in the estimates for these variables across ailments.23The probability of false positive reporting declines with education, however, for a select group of conditions (hypertension, ulcers, and bronchitis).
VIII. Tests of Unbiased Reporting
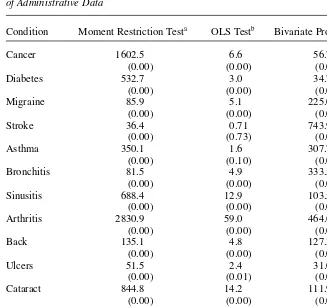
One way of viewing the regressions in Table 4 is as specific tests of a more general hypothesis that the self-reports in the NPHS are unbiased estimators of the OHIP records given observable characteristics. The null hypothesis is E[ NPHS-OHIP⎪X] = 0: the two measures have the same expected value conditional on some characteristics X. Benitez-Silva et al. (2002) outline some conditional moment tests of this hypothesis, which they call “rational unbiased reporting.” To strengthen the infer-ence of the preceding section, we implement three of the tests outlined in this study. The first tests H/E[(NPHS-OHIP)X]=0 for each condition. The test statistic is
1
-|
Wt=NHt tlX Ht D 2^ hk , where Xt is a consistent estimate of the variance of H and k=rank(Ω). The second is an OLS based test, which is the F-test of the signifi-cance of the regression of (NPHS-OHIP) on Xand a constant. For the third test we estimate a bivariate probit model, where our dependent variables are NPHS and OHIP. The test statistic is for the hypothesis the estimated parameters on Xin the two equations are equal. We test each coefficient separately, and then jointly test the entire set of coefficients for each chronic condition. In each test we use the Xmatrix used in the regressions of Table 4.
Benitez-Silva et al.’s (2002) application is to HRS self-reports and Social Security Administration (SSA) determinations of disability. They interpret the tests as evaluat-ing whether the SSA and survey individuals use the same decision rule to identify this state. In our application this interpretation may not be appropriate given the scientific nature of diagnoses for many of our conditions (although for conditions such as back
problems it may be). Another interpretation of the tests is that they evaluate whether any differences in the self-reports and administrative records are correlated with observable characteristics in the NPHS data.
The results are reported in Table 5. For the bivariate probit test we only report the joint test for the entire set of coefficients, but the individual tests are available upon
Table 5
Tests of E[NPHS-OHIPÔX] = 0using the NPHS and Five Years
of Administrative Data
Condition Moment Restriction Testa OLS Testb Bivariate Probit Testc
Cancer 1602.5 6.6 56.7
(0.00) (0.00) (0.00)
Diabetes 532.7 3.0 34.7
(0.00) (0.00) (0.00)
Migraine 85.9 5.1 225.0
(0.00) (0.00) (0.00)
Stroke 36.4 0.71 743.9
(0.00) (0.73) (0.00)
Asthma 350.1 1.6 307.7
(0.00) (0.10) (0.00)
Bronchitis 81.5 4.9 333.5
(0.00) (0.00) (0.00)
Sinusitis 688.4 12.9 103.5
(0.00) (0.00) (0.00)
Arthritis 2830.9 59.0 464.6
(0.00) (0.00) (0.00)
Back 135.1 4.8 127.3
(0.00) (0.00) (0.00)
Ulcers 51.5 2.4 31.0
(0.00) (0.01) (0.00)
Cataract 844.8 14.2 111.9
(0.00) (0.00) (0.00)
Glaucoma 548.6 5.2 17.1
(0.00) (0.00) (0.15)
Hypertension 1,475.5 3.4 87.7
(0.00) (0.00) (0.00)
Notes: Source is 1996/97 NPHS and linked to five years of OHIP data. P-values in parentheses.
a. Test statistics are Chi-Squared tests with 13 degrees of freedom, testing the condition restriction that E[NPHS-OHIP⎪X] = 0.
b. Test statistics are F-tests for the joint significance of the independent variables (work status, a quartic in age, education dummies, sex, marital status, urban dummies and a constant) in a regression with dependent variable equal to (NPHS-OHIP) for each condition.
request. Our results, which are consistent across all three tests, strongly reject the hypothesis that the information provided in the NPHS is identical to that provided in the OHIP data, conditional on the available explanatory variables. This evidence con-firms the preceding inference, that the error in the self-reports is correlated with the observable characteristics of respondents.
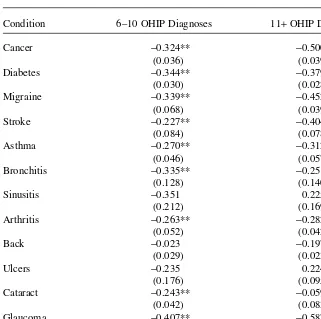
IX. The Effects of Intensity
We next investigate how the error in self-reported health varies with the intensity of the chronic condition. As a measure of intensity we use the number of times the individual has an OHIP record of treatment for a particular condition. We use three intensity levels: 1–5 records, 6–10 records (REC6–10), and more than ten records (REC11+). We again use linear probability models in which a 0/1 indicator of false negatives is the dependent variable and the other covariates are as in Equation 4:
) Xlλ η
+ + +
( )5 (NPHS=0OHIP=1)i=d0+d1(REC6-10)i+d2(REC11 i 2 2i
We restrict our sample to those individuals who have at least one OHIP administra-tive record for a particular chronic condition. Given the focus on false negaadministra-tives, we return to the sample using two years of OHIP data for this analysis. The results using five years of administrative data are similar.
The estimates of the parameters on REC6–10and REC11+are presented in Table 6. For nine of the 12 chronic conditions having between six and ten administrative records of a chronic condition is strongly associated with lower incidence of false negatives. The exceptions are sinusitis, back problems, and ulcers, for which the coef-ficients are negative, but not statistically significant. Having more than ten adminis-trative records also is associated with more accurate reporting. This suggests that there is more behind the false negative reporting than individuals simply misreporting their conditions. The fact that individuals with multiple OHIP records are less likely to false report is consistent with the hypothesis that patients only gradually gather full information about their conditions from their physician.
X. Conclusions
Table 6
Estimates of the Effect of Intensity on the Incidence of False Negatives Two Years Administrative Data
Condition 6–10 OHIP Diagnoses 11+OHIP Diagnoses
Cancer −0.324** −0.500**
(0.036) (0.039)
Diabetes −0.344** −0.379**
(0.030) (0.028)
Migraine −0.339** −0.452**
(0.068) (0.039)
Stroke −0.227** −0.404**
(0.084) (0.078)
Asthma −0.270** −0.312**
(0.046) (0.057)
Bronchitis −0.335** −0.251*
(0.128) (0.140)
Sinusitis −0.351 0.225
(0.212) (0.169)
Arthritis −0.263** −0.282**
(0.052) (0.042)
Back −0.023 −0.197**
(0.029) (0.023)
Ulcers −0.235 0.224
(0.176) (0.095)
Cataract −0.243** −0.059
(0.042) (0.083)
Glaucoma −0.407** −0.587**
(0.051) (0.056)
Hypertension −0.283** −0.353**
(0.018) (0.021)
Despite some complications specific to validating questions on health, our results suggest four fairly robust conclusions. First, there appears to be considerable error, both false positives and false negatives, in self-reports of specific ailments. Estimates of the proportional bias when using these measures as explanatory variables in regres-sions are consistently as large as or larger than comparable estimates for labor market variables such as earnings or hours. While there is certainly some error in the OHIP health records that we use here as the “truth,” we argue through a series of exercises that it is not driving the majority of the error that we document.
Second, using linear probability models to compare workers and nonworkers we find evidence that the error in self-reported chronic conditions is related to labor mar-ket status. That is, some individuals’ reports of their health may be designed to jus-tify their absence from the labor market. A striking example is migraines. We find that working decreases the probability of a false positive report of this ailment by 48 percent.
Third, we present formal tests of the hypothesis that the information provided in the NPHS and the OHIP records is the same, conditional on the observable characteris-tics of the individual. The results strongly reject the null hypothesis for all conditions. Fourth, we have present evidence that the probability of false reporting decreases with the intensity of the condition. This, perhaps, reflects the fact that increased communication with the physician leads individuals to greater knowledge of their ailments.
Appendix 1
Mappings of the Chronic Conditions in the NHPS
into ICD-9 Codes
We use two procedures to map the chronic conditions into the ICD-9 codes. The first simply maps chronic conditions into one of 17 broad groupings of ICD-9 codes as follows:
1) neoplasms—cancer 140–239
2) endocrine, nutritional and metabolic diseases, and immunity 240–279 disorders—diabetes
3) diseases of the nervous system and sense organs—migraines 320–389 and strokes, cataracts, and glaucoma
4) diseases of the circulatory system—hypertension 390–459
5) diseases of the respiratory system—asthma, sinusitis and 460–519 bronchitis
6) diseases of the digestive system—ulcers 520–579
7) diseases of the musculoskeletal system and connective 710–739 tissue—arthritis, back problems
The second, more narrow, mapping uses more specific ICD-9 codes, whose descrip-tion exactly matches the chronic condidescrip-tions. The mapping is as follows:
1) cancer 140–208, 230–234
2) diabetes 250, 253
3) migraines 346
4) stroke 436, 431, 434
5) asthma 493
6) bronchitis/emphysema 506, 490, 491, 492, 518
7) sinusitis 473
8) arthritis 711, 714, 716
9) back problems 724, 738, 722, 730, 731, 732, 733 + OHIP chiropractor codes
10) ulcers 530–534
11) cataracts 366
12) glaucoma 365
Table A1
Percentage of Reports in Medical Records Matched to Report in Survey Instrument, Various Studies
NPHS Krueger NCHS Madow Tretli et al.
(1957) (1965) (1973) (1982)
Cancer 0.26 0.59 0.33 0.61
Diabetes 0.64 0.95 0.62 0.81 0.66
Migraines 0.52 0.62
Stroke 0.51 0.65
Asthma 0.56 0.99 0.71 0.69
Bronchitis 0.31 0.65 0.79
Sinus problems 0.32 0.72 0.48 1.00
Arthritis 0.69 1.00 0.48
Back problems 0.40
Ulcers 0.21 0.60
Cataracts 0.36
Glaucoma 0.37
Hypertension 0.59 0.63 0.46 0.81
Percentage of Reports in Survey Instrument Matched to Report in Medical Records, Various Studies
Cancer 0.79 0.82 0.80 0.53
Diabetes 0.82 0.93 0.70 0.98 0.66
Migraines 0.20 0.47
Stroke 0.39
Asthma 0.45 0.64 0.49
Bronchitis 0.11 0.16 0.31
Sinus problems 0.03 0.54 0.19 0.21
Arthritis 0.07 1.00
Back problems 0.33
Ulcers 0.10 0.60
Cataracts 0.63
Glaucoma 0.74
References
Aigner, Dennis J. 1973. “Regression with a Binary Independent Variable Subject to Errors of Observation.” Journal of Econometrics1(1):49–59.
Baker, Michael, Mark Stabile, and Catherine Deri. 2001. “What Do Self-Reported, Objective Measures of Health Measure?” Working Paper 8419. Cambridge: National Bureau of Eco-nomic Research.
Baker, Michael, Mark Stabile, and Catherine Deri. 2002. “What Do Self-Reported, Objective Measures of Health Measure?” Toronto: University of Toronto. Unpublished.
Benitez-Silva, Hugo, Moshe Buchinsky, Hui Man Chan, Sofia Cheidvasser, and John Rust. 2002. “How Large is the Bias in Self-Reported Disability?” Los Angeles: University of California at Los Angeles. Unpublished.
Bondy, Susan, and Susan Schultz. 2001. “Linking Survey and Administrative Data: An Exam-ination of the 1996 Linkable Ontario Portion of the National Population Health Survey.” Toronto: Institute for Clinical and Evaluative Sciences. Unpublished.
Bound, John. 1991. “Self-Reported versus Objective Measures of Health in Retirement Mod-els.” Journal of Human Resources26(1):106–38.
Bound, John, Charles Brown, Greg J. Duncan, and Willard L. Rodgers. 1994. “Evidence on the Validity of Cross-Sectional and Longitudinal Labor Market Data.” Journal of Labor Economics12(3):345–68.
Bound, John, and Richard V. Burkhauser. 1999. “Economic Analysis of Transfer Programs Targeted on People with Disabilities.” In Handbook of Labor Economics, vol. 3C, ed. Orley Ashenfelter and David Card, 3417–3528. New York: Elsevier Science.
Bound, John, Charles Brown, and Nancy Mathiowetz. 2001. “Measurement Error in Survey Data.” In Handbook of Econometrics, vol. 5, ed. James J. Heckman and Edward Leamer, 3705–3843. New York: Elsevier Science.
Currie, Janet, and Brigitte C. Madrian. 1999. “Health, Health Insurance and the Labor Mar-ket.” In Handbook of Labor Economicsvol. 3C, ed. Orley Ashenfelter and David Card, 3309–3416. New York: Elsevier Science.
Dwyer, Debra, and Olivia S. Mitchell. 1999. “Health Problems as Determinants of Retire-ment: Are Self-Rated Measures Endogenous?” Journal of Health Economics18(2):173–93. Harlow, Sioban D., and Martha S. Linet. 1989. “Agreement between Questionnaire Data and
Medical Records.” American Journal of Epidemiology129(1):233–48.
Hux, Jan, Frank Ivis, Virginia Flintoft, and Adina Bica. 2002. “Diabetes in Ontario: Determi-nation of Prevalence and Incidence Using a Validated Administrative Data Algorithm.” Dia-betes Care25(3):512–16.
Krueger, D. E. 1957. “Measurement of Prevalence of Chronic Disease by Household Inter-views and Clinical Evaluations.” American Journal of Public Health47:953–60. Madow, William G. 1973. “Net Differences in Interview Data on Chronic Conditions and
Information Derived from Medical Records.” Vital and Health Statistics2(57):1–58. National Centre for Health Statistics. 1965. “Health Interview Responses Compared with
Medical Records.” Vital and Health Statistics2(7). Washington D.C.: GPO.
Ontario Ministry of Health and Long Term Care. 2002. “Ontario Ministry of Health and Long-Term Care, provider Services Branch, Monitoring and Control Section 2001/02 Report.” Toronto: Ontario Ministry of Health and Long Term Care.
Tretli, Steinar, Lund-Larsen, Per G., and Olav P. Foss. 1982. “Reliability of Questionnaire Information on Cardiovascular Disease and Diabetes: Cardiovascular Disease Study in Finnmark County.” Journal of Epidemiology and Community Health36(4):269–73. Williams, Jack, Karey Iron, and Keyi Wu. 1998. “Estimating the Impact of Arthritis on the