Full Terms & Conditions of access and use can be found at
http://www.tandfonline.com/action/journalInformation?journalCode=cbie20
Download by: [Universitas Maritim Raja Ali Haji] Date: 18 January 2016, At: 19:54
Bulletin of Indonesian Economic Studies
ISSN: 0007-4918 (Print) 1472-7234 (Online) Journal homepage: http://www.tandfonline.com/loi/cbie20
A NOTE ON RICE PRODUCTION, CONSUMPTION
AND IMPORT DATA IN INDONESIA
L. Peter Rosner & Neil McCulloch
To cite this article: L. Peter Rosner & Neil McCulloch (2008) A NOTE ON RICE PRODUCTION, CONSUMPTION AND IMPORT DATA IN INDONESIA, Bulletin of Indonesian Economic Studies, 44:1, 81-92, DOI: 10.1080/00074910802001595
To link to this article: http://dx.doi.org/10.1080/00074910802001595
Published online: 16 Jul 2008.
Submit your article to this journal
Article views: 254
View related articles
ISSN 0007-4918 print/ISSN 1472-7234 online/08/010081-11 © 2008 Indonesia Project ANU DOI: 10.1080/00074910802001595
A NOTE ON RICE PRODUCTION, CONSUMPTION
AND IMPORT DATA IN INDONESIA
L. Peter Rosner Neil McCulloch
World Bank, Washington DC The Asia Foundation, Jakarta
Debate about Indonesian rice policy has focused on estimates of production and consumption levels, and the level of imports they imply. However, Indonesian rice production and consumption data are controversial. Rice consumption as estimat-ed from household survey data is much lower than offi cially reported rice
produc-tion. This suggests that Indonesia is a net rice exporter, but in fact it has generally been a net importer. Some researchers argue that rice consumption data are under-estimated; others contend that production is over-estimated because of inaccura-cies in ‘eye estimates’ of harvested area. This paper reviews how rice production and consumption are measured, notes major weaknesses, and surveys attempts to reconcile consumption and production data and examine their consistency with rice import data. It concludes that rice prices are the only accurate indicator of the balance between supply and demand, and hence of the appropriate level of imports.
INTRODUCTION
Much of the current debate about rice policy in Indonesia has focused on the levels of rice production and consumption. If the quantity of imports continues to be determined by the government rather than by market processes, it is essential for planners to have reasonably accurate estimates of expected levels of produc-tion and consumpproduc-tion. However, Indonesian rice producproduc-tion and consumpproduc-tion data have long generated controversy among agricultural experts. The key reason for this controversy is that rice consumption estimated from the national economic survey (Susenas) is much lower than offi cial production fi gures for rice, suggesting that Indonesia is a net rice exporter—whereas in fact it has almost always been a net importer. To explain this puzzle, some researchers have argued that rice consumption as measured from Susenas data is under-estimated. Oth-ers have argued that production is over-estimated because of inaccuracies in ‘eye estimates’ of harvested area. This note will briefl y review how rice production and consumption are currently measured, and will note the major weaknesses. It will review a number of attempts that have been made to reconcile consumption and production data and to look at their consistency with rice import data.
BIESApr08.indb 81
BIESApr08.indb 81 29/2/08 9:49:33 PM29/2/08 9:49:33 PM
ESTIMATING RICE PRODUCTION
Rice production is estimated jointly by enumerators, called mantri statistik, employed directly by the central statistics agency (BPS), and by agricultural fi eld agents (mantri tani) employed by local governments.1 The mantri statistik and mantri tani estimate rice production by combining data on yield per hectare and harvested area. Estimates of yield and harvested area are obtained as follows:
• Yield per hectare is estimated by taking a random sample of standing paddy from fi elds ready for harvesting, cutting a 2.5 x 2.5 metre square from within each fi eld, threshing the paddy, and weighing the result. This is known as the crop-cutting survey or ‘ubinan’. The plots are selected based on harvested area using a ‘probability proportional to size’ sampling method. Careful techniques have been developed to ensure accuracy in the measurement of yield; for example, all enumerators take part in a training course and receive a detailed fi eld manual. Comparisons of yield estimates from the mantri statistik, who work for the BPS, and the mantri tani, who work for the local government but are funded partly by the Ministry of Agriculture, indicate no signifi cant difference in estimated yield. This adds to confi dence that yield is measured correctly.
• Harvested area is estimated by the mantri tani each month using an ‘eye estimate’ approach. Local records and reports from farmers groups, village chiefs and other local offi cials provide baseline information on total agricultural area in each district. Benchmark data on agricultural land area are also available from the Agricultural Census conducted once every 10 years. The mantri tani combine these records on land area with their own observations of the cropping pattern each month to report monthly harvested area. International experience suggests that eye estimates of harvested area can be relatively accurate at measuring changes in harvested area, but not in measuring the total harvested area.
Total paddy production is estimated by multiplying yield per hectare by harvested area in hectares, or:
Q = Y x H
where: Q = paddy production; Y = yield per hectare; H = harvested area in hec-tares.
Production is reported in terms of unhusked dry rice ready for milling (gabah kering giling, GKG); this can be converted into production of milled rice using a conversion ratio of 0.632.2 Harvested area is reported every month, but the
crop-cutting surveys are carried out only three times a year, so estimates of yield are available only three times a year. BPS therefore reports production for January– April, May–August and September–December.
1 Before decentralisation the mantri tani were national civil servants employed by the Ministry of Agriculture, but they are now local government employees under the regent (bupati) or mayor (walikota).
2 Prior to 1987 the conversion ratio was 0.68. Between 1987 and 1995 it was 0.65, and since 1996 it has been 0.632.
BIESApr08.indb 82
BIESApr08.indb 82 29/2/08 9:49:33 PM29/2/08 9:49:33 PM
Problems with the production estimates
BPS has long believed that the ‘eye estimates’ used to calculate rice harvested area are not reliable. While they can be reasonably accurate for measuring changes in harvested area from one period to the next, they are not reliable for measur-ing the base level of harvested area. To assess the accuracy of the eye estimates, BPS undertook a large survey of rice harvested area in Java using a household approach (BPS 1998).3 Between May 1996 and April 1997, a total of 262,362 rice
farm households in Java were randomly selected and interviewed about their rice harvested area. Of the surveyed households, 10% were then selected for fi eld measurement, with the BPS enumerators taking actual physical measurements of each plot to check the answers provided by the households. On average it was discovered that households slightly over-estimated their own harvested area, although the differences between recall and fi eld measurement were not statisti-cally signifi cant.
When the fi ndings from the household survey were compared with the eye estimates of the mantri tani, it was discovered that the eye estimate method had over-estimated rice harvested area in Java by 17% (table 1). Since paddy produc-tion is calculated as yield times harvested area, this implies that paddy producproduc-tion in Java was over-estimated by 17% in 1996/97. A 2002 study in North Sumatra (reported in Sastrotaruno and Maksum 2002: 254) also found that rice harvested area was over-estimated using the ‘eye estimate’ technique. Thus, it appears likely that paddy production in Indonesia is signifi cantly over-estimated. However, the degree of over-estimation outside Java is not known.
A check of the reliability of these two approaches should have been available from the results of the 2003 Agriculture Census. Writing in 2002, a former head of BPS noted that ‘the BPS Directorate of Agriculture is currently studying this issue in depth, using the extensive work planned under the 2003 Agriculture Census to provide a more accurate fi gure for this variable and a possible revision of the historical series’ (Sastrotaruno and Maksum 2002). Unfortunately, the fi ndings of
3 An evaluation of the survey was published in March the following year (BPS 1999).
TABLE 1 Rice Harvested Area Using Household Survey and Eye Estimates (‘000 hectares)
Period Household
Survey
Eye Estimates
Difference
(‘000 ha) (%)
May–Aug 1996 1,592 1,744 153 8.8
Sep–Dec 1996 703 726 22 3.1
Jan–Apr 1997 1,984 2,690 706 26.2
May 1996 – Apr 1997 4,279 5,160 881 17.1
Source: BPS (1998).
BIESApr08.indb 83
BIESApr08.indb 83 29/2/08 9:49:33 PM29/2/08 9:49:33 PM
the 2003 Agriculture Census regarding the accuracy of data on both paddy area (luas baku lahan sawah) and paddy harvested area (luas panen padi) have not yet been released.
The BPS studies are not the only estimates of the accuracy of production fi gures. In 2000–01, the Japan International Cooperation Agency (JICA) imple-mented a large survey of rice farmers as part of its Agriculture Statistics Technol-ogy Improvement and Training (ASTIT) project, working with the Ministry of Agriculture to improve harvested area estimates and with BPS to improve yield estimates. A survey was conducted throughout Java from May 2000 to April 2001. When compared to offi cial data, JICA found that rice harvested area in Java was over-estimated by 9%, and rice yield by 5.2%. Total rice production in Java (in GKG) was over-estimated by 13% (JICA nd). The Ministry of Agriculture expressed its commitment to adopting the improved techniques for measuring rice production suggested by the ASTIT project,4 but subsequently no major change in
methodol-ogy was implemented.
ESTIMATING RICE CONSUMPTION
The main source of data on rice consumption is the Susenas. This is conducted every year, but detailed data on food consumption are collected only once every three years, from a sub-sample of about 60,000 households.5 The most common
method of measuring national rice consumption is to multiply per capita rice con-sumption, as measured from the Susenas, by total population.
Problems with the Susenas rice consumption estimates
For the purpose of measuring national rice consumption, the Susenas survey has a number of weaknesses.
• First, the Susenas does not directly measure the quantity of rice that households consume outside the home, for example, in road-side food stalls (warung), restaurants and hotels. However, it does measure household rupiah expenditure on all food consumed outside the home. A common practice for measuring the quantity of rice consumed outside the home is to assume that the proportion of rice expenditure in total food expenditure, measured in rupiah, is the same outside and inside the home. Thus, if 15% of food is consumed outside the home, it is assumed that 15% of rice is also consumed outside the home.
• Second, the Susenas does not include rice consumed by the food processing industry. In recent years, production of food items made from rice, such as rice noodles (bihun), has increased rapidly. Thus, to obtain an accurate fi gure for national rice consumption one needs to make some estimate of the quantity of rice consumed by industry.
4 Speech by Ir Nelson P. Hutabarat, Secretary General of the Ministry of Agriculture, Ja-karta, 18 September 2001.
5 The new 10,000-household panel component of the Susenas collects detailed data on food consumption every year.
BIESApr08.indb 84
BIESApr08.indb 84 29/2/08 9:49:34 PM29/2/08 9:49:34 PM
As a result of these weaknesses the Susenas typically under-estimates true rice consumption. Some methods used to adjust for these problems are discussed below, but fi rst it is important to recognise that there is another completely differ-ent source of rice consumption data commonly used in international research: the FAO (Food and Agriculture Organization) Food Balance Sheet.
FAO Food Balance Sheet
Indonesia produces an annual Food Balance Sheet, which it provides to the FAO and which is posted on the FAO’s website (FAOSTAT, <http://faostat.fao.org/>). The Food Balance Sheet provides an estimate of annual per capita rice consump-tion. Unfortunately this is not an independent estimate, because it is derived entirely from the offi cial rice production estimate. To derive rice consumption, the Food Balance Sheet starts with offi cially reported paddy production, converts it to rice with a standard conversion formula, adds net imports and changes in stocks, and subtracts rice used for feed, seed and waste. The fi nal number is con-sidered to be rice available for consumption. Any errors in the rice production number translate directly into the consumption estimate. More problematic, per capita rice consumption as reported in the Food Balance Sheet is highly erratic, changing substantially from year to year owing to changes in production and offi cially reported net imports. Since no reliable data on privately held rice stocks, which exceed government stocks several-fold, are available in Indonesia,6 and
since offi cial import data also suffer from substantial shortcomings (discussed further below), the Food Balance Sheet is not a reliable source of rice consumption data for Indonesia.
RECONCILING PRODUCTION AND CONSUMPTION DATA
Rice consumption as estimated by the Susenas is always signifi cantly lower than offi cial rice production. Yet Indonesia has always been a net importer of rice. Many attempts have been made to explain this puzzle. Adjustments have been made to production to take account of rice used for seed, animal feed, post-harvest losses and over-estimates of harvested area. Adjustments have been made to the Suse-nas consumption data to take into account rice consumed outside the home and used by the food processing industry. In principle, these adjustments can explain
6 In late 2006 the state-owned surveying company PT Sucofi ndo initiated surveys of
pri-vately held rice stocks on behalf of the Ministry of Trade (Sucofi ndo 2007). The August 2007
survey estimated that private rice stocks as of 1 September 2007 were 3.99 million tonnes and Bulog’s stocks were 1.74 million tonnes. Most private stocks were found to be held by rice farmers (76.1%) and households (7.4%), with traders, wholesalers and rice mills hold-ing only 13.2% of private stocks. The reliability of these new surveys is not known. In par-ticular, since the Indonesian police periodically conduct sweeps of private warehouses in search of hoarders and speculators, it seems likely that private stocks are under-estimated. The Sucofi ndo survey also estimated total national rice consumption, including
consump-tion in the home, outside the home and by industry, at 29.8 million tonnes. This compares with the government’s offi cial estimate of rice production in 2007 of 55.1 million tonnes of
dry paddy, equivalent to 34.7 million tonnes of rice, implying that Indonesia produced a surplus of 4.9 million tonnes of rice in 2007. Nevertheless, Indonesia imported more than one million tonnes of rice in 2007.
BIESApr08.indb 85
BIESApr08.indb 85 29/2/08 9:49:34 PM29/2/08 9:49:34 PM
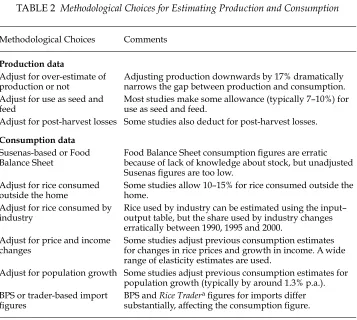
the gap between production and consumption, but there are no reliable or consist-ent data for any of these adjustmconsist-ent variables. Consequconsist-ently, differconsist-ent techniques and assumptions produce widely differing estimates of the rice supply–demand balance in Indonesia. Table 2 shows the key methodological choices that have been made in the various studies undertaken to try to reconcile production and consumption fi gures.
The overall impact of this wide range of methodological choices is large and important. The most important choices are whether to make an adjustment to production to refl ect possible over-estimation, and what basis to use for the con-sumption fi gures. For example, Sastrotaruno and Maksum (2002) adjusted the production data downwards by 17% and used Susenas data adjusted for out-of-home consumption and BPS input–output table data on industrial consumption. With these adjustments, the authors found that most of the implied gap between offi cially reported rice production plus net imports and consumption over the period 1996–2000 could be explained. Researchers at the Agency for Food Security (Badan Bimbingan Masyarakat Ketahanan Pangan, BBKP) used a similar approach
TABLE 2 Methodological Choices for Estimating Production and Consumption
Methodological Choices Comments
Production data
Adjust for over-estimate of production or not
Adjusting production downwards by 17% dramatically narrows the gap between production and consumption. Adjust for use as seed and
feed
Most studies make some allowance (typically 7–10%) for use as seed and feed.
Adjust for post-harvest losses Some studies also deduct for post-harvest losses.
Consumption data
Susenas-based or Food Balance Sheet
Food Balance Sheet consumption fi gures are erratic
because of lack of knowledge about stock, but unadjusted Susenas fi gures are too low.
Adjust for rice consumed outside the home
Some studies allow 10–15% for rice consumed outside the home.
Adjust for rice consumed by industry
Rice used by industry can be estimated using the input– output table, but the share used by industry changes erratically between 1990, 1995 and 2000.
Adjust for price and income changes
Some studies adjust previous consumption estimates for changes in rice prices and growth in income. A wide range of elasticity estimates are used.
Adjust for population growth Some studies adjust previous consumption estimates for population growth (typically by around 1.3% p.a.). BPS or trader-based import
fi gures
BPS and Rice Traderafi gures for imports differ
substantially, affecting the consumption fi gure.
a The Rice Trader is a private publication, available by subscription, that collects world-wide data on
rice trade. Indonesian import data in The Rice Trader are based on port-of-origin export data.
BIESApr08.indb 86
BIESApr08.indb 86 29/2/08 9:49:34 PM29/2/08 9:49:34 PM
to estimate production and consumption, as well as using estimates of supply, demand and income elasticities to forecast future production and consumption (Erwidodo, Molyneaux and Pribadi 2002).They concluded that imports of 2.4 mil-lion tonnes per year will be needed to satisfy demand. By contrast, a study by Ronnie S. Natawidjaja of Padjadjaran University (Natawidjaja 2001), which did not adjust for production over-estimation or consumption outside the home or by industry, suggested that there should have been a surplus of 3.9 million tonnes in 1998, at the height of the 1998 El Niño drought, when in fact a record 6 million tonnes of rice were imported (see also LPEM–FEUI 2005).
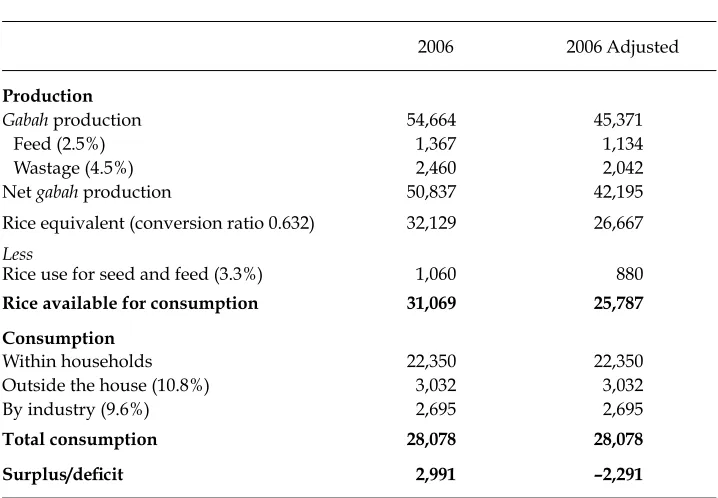
The sensitivity of the calculations of surplus/defi cit to the assumptions made can be shown by comparing the estimated surplus/defi cit with and without the 17% adjustment to production that refl ects BPS calculation of the over-estimation of production. Table 3 shows the result. We employ all the typical assumptions regarding use for seed, feed and wastage, as well as typical estimates of consump-tion outside the home and by industry taken from the Ministry of Agriculture. Without adjusting for production over-estimation, this yields a surplus of almost 3 million tonnes. But adjusting for production over- estimation yields a defi cit of over 2 million tonnes. In short, it is quite impossible to determine Indonesia’s rice surplus/defi cit position using existing production and consumption data.
TABLE 3 Rice Surplus/Defi cit With and Without Adjustment for a 17% Production Over-estimate
(‘000 tonnes)
2006 2006 Adjusted
Production
Gabah production 54,664 45,371
Feed (2.5%) 1,367 1,134
Wastage (4.5%) 2,460 2,042
Net gabah production 50,837 42,195
Rice equivalent (conversion ratio 0.632) 32,129 26,667
Less
Rice use for seed and feed (3.3%) 1,060 880
Rice available for consumption 31,069 25,787 Consumption
Within households 22,350 22,350
Outside the house (10.8%) 3,032 3,032
By industry (9.6%) 2,695 2,695
Total consumption 28,078 28,078 Surplus/defi cit 2,991 –2,291
Source: Ministry of Agriculture and World Bank staff estimates.
BIESApr08.indb 87
BIESApr08.indb 87 29/2/08 9:49:34 PM29/2/08 9:49:34 PM
RICE IMPORTS AND SELF-SUFFICIENCY
Owing to the data weaknesses described above, the best measurement of the actual gap between rice production and consumption is rice imports. If Indonesia was a net surplus rice producer it would not need to import, yet, as noted above, the historical record shows that Indonesia has been a rice importer for at least the past 100 years (fi gure 1), with the share of imported rice in domestic consumption averaging 5% over the past century, and 4% over the past 15 years.
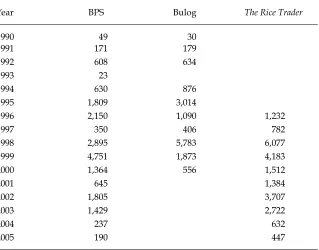
BPS data have also tended to under-state rice imports, however, as shown in table 4.7 Thus, regardless of estimates of the supply–demand balance derived
from comparisons of consumption and production data, trade statistics indicate that consumption almost always exceeds production.
PRICE AS AN INDICATOR OF SUPPLY–DEMAND BALANCE
If the government intends to control the quantity of rice imported using quo-tas and licences, while simultaneously attempting to stabilise prices, it needs to have accurate data on production, consumption and stocks (including accurate forecasts). The problem that policy makers face can be illustrated with the follow-ing identity:
7 Since Bulog had a monopoly on rice imports through the end of 1997, we presume that Bulog rice import data are more accurate pre-1998 than BPS rice import data. The Bulog data are also generally closer to rice export data collected from ports of origin by The Rice Trader.
FIGURE 1 Rice Imports as a Share of Domestic Consumption (rolling fi ve-year average, %)
19000 1910 1920 1930 1940 1950 1960 1970 1980 1990 2000 2
4 6 8 10 12 14
Source: Dawe (2008): fi gure 3a, based on Food and Agriculture Organization, FAOSTAT (FAO Statistical
Databases), accessed 10 January 2006 at <http://www.fao.org/waicent/portal/statistics_en.asp>.
BIESApr08.indb 88
BIESApr08.indb 88 29/2/08 9:49:35 PM29/2/08 9:49:35 PM
It ≡Ct + ΔS – Pt
where
It = net rice imports in time period t;
Ct = rice consumption in time period t; and
ΔS = the change in rice stocks between period t–1 and t;
Pt = rice production in time period t.
Expressed in words, net rice imports are equal to consumption plus change in stocks minus production. If consumption exceeds production, then either stocks will need to be drawn down or rice will need to imported.
To determine accurately the required quantity of imports, policy makers need accurate data for Pt, Ct and ΔS. Unfortunately, as the discussion above makes clear,
there are no accurate data. Rice production may be signifi cantly over-estimated. Estimates of rice consumption are highly infl uenced by estimates of the quantity of rice consumed outside the home, and of rice used by industry, as reported in
TABLE 4 Comparison of Rice Import Data from Various Sourcesa
(‘000 tonnes)
Year BPS Bulog The Rice Trader
1990 49 30
1991 171 179
1992 608 634
1993 23
1994 630 876
1995 1,809 3,014
1996 2,150 1,090 1,232
1997 350 406 782
1998 2,895 5,783 6,077
1999 4,751 1,873 4,183
2000 1,364 556 1,512
2001 645 1,384
2002 1,805 3,707
2003 1,429 2,722
2004 237 632
2005 190 447
a BPS data for 1990–94 are net imports. Bulog data cover Bulog imports only, and do not include
private imports in 1999 and 2000. For an explanation of The Rice Trader, see table 2, note a.
Source: BPS data are from unpublished trade statistics; Bulog data are from Amang and Sawit (2001).
BIESApr08.indb 89
BIESApr08.indb 89 29/2/08 9:49:35 PM29/2/08 9:49:35 PM
the BPS input–output tables. But a comparison of the 1990, 1995 and 2000 input– output tables shows implausible trends for these two variables. Estimates of post-harvest losses are little more than guesses. And since there are no reliable data on privately held rice stocks (see footnote 6), there is no way of knowing the potential magnitude of ΔS.
One lesson to be drawn from the discussion above is the need to improve the quality of existing data. Certainly, repeating and extending the BPS household survey from 1996/97, and adjusting the methodology for making production esti-mates accordingly, would be wise. Similarly, better estiesti-mates of consumption out-side the home and by industry, as well as more accurate measures of other forms of rice use (such as seed, feed and wastage) would be valuable.
However, it is important to recognise that, even if estimates of production and consumption are improved, it is unlikely to be possible to determine from pro-duction and consumption fi gures whether Indonesia is facing a rice surplus or a defi cit. Suppose, for example, that the margin of error on production data and consumption data is just 5% (almost certainly less than the true margin of error). If the expected value for production was 32 million tonnes, and the estimated value for consumption was also 32 million tonnes, and the best guess for stocks was 7 million tonnes8 and stocks were expected not to change, supply and demand
would balance. But if the true production fi gure was 2.5% below the estimated fi g-ure (within the margin of error), and the true consumption fi gure was 2.5% above the estimated value (again within the margin of error), and the public decided to increase their privately held rice stocks by 2.5%, then the data would show that no imports were needed when in fact imports of 1.8 million tonnes would be needed. Very conservative estimates of the margin of error for data on rice production and consumption are therefore compatible with Indonesia being either a major rice importer or a rice exporter.
The message for policy is simple: there is no reliable way to calculate independ-ently the ‘appropriate’ quantity of rice imports. The only useful indicator of the demand–supply balance is the price. If rice prices are rising there is scarcity, and imports may be needed. In a broader sense, the discussion above illustrates one of the dangers of a central planning approach to rice policy as opposed to a market-oriented approach. If government offi cials are required to make judgments about the ‘appropriate’ level of rice imports, they will be obliged to do so on the basis of very unreliable data, which could easily lead them to implement policies that are in fact entirely inappropriate in the short term. By contrast, roughly speak-ing, market participants require only one piece of information, which is directly observable: what is happening to prices? Of course, government offi cials could also base interventionist policies on observed price movements, but they would have much weaker incentives to avoid making mistakes than would private trad-ers with their own wealth at stake.
8 An unpublished estimate of rice stocks from the Ministry of Agriculture shows a month-ly average of 6.7 million tonnes in 2006.
BIESApr08.indb 90
BIESApr08.indb 90 29/2/08 9:49:35 PM29/2/08 9:49:35 PM
REFERENCES
Amang, Beddu and Sawit, Husein (2001) Kebijakan Beras dan Pangan Nasional [National Rice and Food Policy], IPB (Bogor Agricultural Institute) Press, Bogor.
BPS (Badan Pusat Statistik) (1998) Survei Luas Tanaman Padi dengan Pendekatan Rumah Tangga di Jawa, Tahun 1996–97 [Survey of Area Planted to Rice Using a Household Approach in Java, 1996–97), BPS, Jakarta.
BPS (Badan Pusat Statistik) (1999) Evaluasi Luas Tanaman Padi dengan Pendekatan Rumah Tangga 1998 [An Evaluation of Area Planted to Rice Using a Household Approach, 1998], BPS, Jakarta.
Dawe (2008) ‘Can Indonesia trust the world rice market?’, Bulletin of Indonesian Economic Studies 44 (1): 115–32, in this issue.
Erwidodo, Molyneaux, J. and Pribadi, Ning (2002) Household food demand: an Almost Ideal Demand System (AIDS), Draft working paper prepared for the Agency for Food Security, Department of Agriculture (Badan Bimas Ketahanan Pangan, Departemen Pertanian) in association with the Food Policy Support Activities of USAID (United States Agency for International Development)/Indonesia.
JICA (Japan International Cooperation Agency) (nd) Recommendations for further improvement of the paddy production survey, ASTIT (Agriculture Statistics Technol-ogy Improvement and Training) Project, JICA, Jakarta, mimeo.
LPEM–FEUI (Institute for Economic and Social Research, Faculty of Economics, University of Indonesia) (2005) Roadmap Menuju Ketahanan Pangan: Peran Strategies Pembangunan Pertanian dan Pedesaan [Roadmap Towards Food Security: The Role of Agricultural and Rural Development Strategies], A collaboration between Perum Bulog (the national logistics agency) and LPEM–FEUI, Jakarta.
Natawidjaja, Ronnie S. (2001) ‘Dinamika pasar beras domestik [The dynamics of the domes-tic rice market]’, in Bunga Rampai Ekonomi Beras [Key Readings on the Rice Economy], eds A. Suryana and S. Mardianto, Economic and Social Research Institute, University of Indonesia (LPEM–UI), Jakarta: 59–81.
Sastrotaruno, Suwandhi and Maksum, Choiril (2002) ‘Jumlah data beras Indonesia: tin-jauan singkat [Aggregate rice data in Indonesia: a brief overview]’, Report No. 48, BPS, Jakarta, February, accessed 1 February 2008 at <http://www.bps.go.id/papers/ind-statpaper10.pdf?>.
Sucofi ndo (2007) Laporan Survei Stok Beras Nasional Tahap II Tahun 2007, Executive Summary
[Report on the National Rice Stock Survey Stage II 2007, Executive Summary], 25 Sep-tember, Jakarta.
BIESApr08.indb 91
BIESApr08.indb 91 29/2/08 9:49:36 PM29/2/08 9:49:36 PM
Expressing Islam:
Religious Life and Politics
Greg Fealy
and
Sally White
editors
ANU College of Asia and the Pacifi c The Australian National University
Some 190 million Indonesians profess Islam as their faith. Across the archipelago they search for ways to express their religious belief, both in public behaviour and in their private lives. Growing numbers of Muslims, particularly in urban areas, are seeking more overtly Islamic expressions of their identity. Traditional institutions and modes of expression retain their popularity but are undergoing transformation. Islamic spiritual healing and traditional treatments such as cupping and herbal remedies are juxtaposed with the rising popularity of more modern phenomena such as shari’a banking and insurance, Muslim fashions, Islamic multi-level marketing, corporate mystical brotherhoods and new electronic preaching media like mobile phone sermons, cyber chat rooms and internet fatwa services. At the same time, both in the regions and at the centre, a concern for both public and private morality has led to calls for shari’a law to be more comprehensively applied.
This book captures the complexity and rapidly changing nature of Islamic religiosity. It critically examines developments in politics, society and culture, as well as the increasing Islamisation of everyday institutions and life in Indonesia. The contributors explore not only the diversity but also the spiritual, cultural and material aspects of Islam in contemporary Indonesia.
To be published in 2008 by the Institute of Southeast Asian Studies, Singapore, in cooperation with the Australian National University, Canberra
The Managing Editor Tel +65 6870 2447
Institute of Southeast Asian Studies Fax +65 6775 6259 30 Heng Mui Keng Terrace
Pasir Panjang Road e-mail pubsunit@iseas.edu.sg SINGAPORE 119614 http://bookshop.iseas.edu.sg
BIESApr08.indb 92
BIESApr08.indb 92 29/2/08 9:49:36 PM29/2/08 9:49:36 PM