www.iosrjournals.org
Value Addition and Performance of Informal Dairy Enterprises
in Kenya: A Product Diversification Perspective
Ann N. Kariuki
1, Mike A. Iravo
2, John M. Kihoro
31(Department of Entrepreneurship, Technology and Leadership Management /Jomo Kenyatta University of
Agriculture and Technology, Kenya)
2(Department of Entrepreneurship, Technology and Leadership Management /Jomo Kenyatta University of
Agriculture and Technology, Kenya)
3
(Directorate of Computing and e-learning/ Cooperative University College of Kenya, Kenya)
Abstract:
The informal dairy sector in Kenya has undergone a tremendous transformation from being anillegal enterprise to its legalization and adoption of “formal” status as from 2007. Questions have been raised
on whether a smallholder dominated economy can diversify and whether smallholders participate significantly in product diversification towards high value products. Results of the study showed that small scale milk vendors (SSMVs) have the ability to diversify into high value dairy products which attract higher profits compared to raw fresh milk. There were more women than men engaged in SSMV business in the study group and well educated people who had not been absorbed into formal employment had joined the informal dairy sector. Product diversification into value added dairy products can therefore help to improve food security and increase incomes of SSMVs hence reduce poverty. The study adds to the available limited evidence on the contribution of the informal sector in the growth and development of developing countries.
Key Words:
Dairy, Informal, Performance, Product Diversification, Value AdditionI.
Introduction
The dairy industry in Kenya and specifically milk has been documented as the most important livestock product contributing 70 per cent of the gross value of livestock production to the agricultural sector as of 2009 (Intergovernmental Authority on Development Center for Pastoral Areas and Livestock Development, 2013). The importance of the informal sector to growth and development in Kenya has been recognized in Vision 2030 (Baiya and Kithinji, 2010). Evidence suggests that the informal dairy sector in Kenya employs more people than the formal sector accounting for 70 per cent of total jobs in dairy marketing and processing (Muriuki, 2011). To this end, the legalization of the informal milk sector in 2007 saw dairy traders record an increase of 54 per cent of milk volume traded in 2009 (Baiya and Kithinji, 2010). Most of the milk sold in Kenya before and immediately after liberalization in 1992 was through the Kenya Cooperative Creameries (KCC), who had a monopoly to process all the milk but since it’s near collapse in the 1990s, farmers were left with no outlet for much of their production (Bolo et al., 2011). This resulted in rapid growth of the informal milk trade. Questions have been raised on whether a smallholder dominated economy can diversify and whether smallholders participate significantly in product diversification towards high value products (Birthalet al.,
2007).
Previous studies on the dairy sector in Kenya have revealed that milk losses in the informal sector are high due to lack of milk collection and gluts during the rainy season (Kenya Agricultural Research Institute, 2009; StichtingNederlandseVrijwilligers, 2013; Techno Serve, 2008; Wambuguet al., 2011). Informal milk traders often cite the lack of sustainability of their businesses given the erratic supply of milk: during periods of excess supply (glut), the price of milk drastically falls making it difficult for them to make profits (Republic of Kenya, 2011). Product diversification is therefore an appealing strategy for them to pursue as it leads to poverty reduction and generates quick returns with most high-value food commodities, hence offering smallholders, youth and the urban labour force a perfect opportunity to increase their incomes (Baiya and Kithinji, 2010; Birthalet al., 2007; Singh, 2011).
(Kaitibieet al., 2010;Kamundi, 2014; TechnoServe, 2008). This definition should however be expanded to include small scale retailers who also sell raw milk and value added dairy products.
A call has been made to conduct research on value addition of livestock products especially milk to prolong its shelf life (Kipatarus, 2005). It has also been noted that there is little authoritative quantifiable data on milk at the national level which impedes evidence- based discussions on dairy policy making (Intergovernmental Authority on Development Center for Pastoral Areas and Livestock Development, 2013). Little attention has been given to mainstream and support the informal dairy sector despite its strong dominance compared to many other sectors in Kenya (Baiya and Kithinji, 2010). This paper is a response to these calls and the observations presented provide justification for this paper. It presents results of an empirical investigation on informal dairy enterprises in Kiambu County, Kenya. The paper is structured as follows; first is a review of the theoretical framework and review of literature. Second is the methodology employed in the study. Finally, the paper gives recommendations for future research on the informal dairy sector in Kenya.
II.
Literature Review
Product diversification has become an important aspect of business strategy with reasons for this increased focus being increased profitability, reduction in risk, increasing competition, higher growth and more efficient resource allocation (Afzaet al., 2008; Benito-Osorio, 2012; Burgers et al., 2009; Johnson and Scholes, 2005; McDougall and Round, 1984). Investigations carried out on product diversification strategy are inconclusive and empirical studies investigating the relationship between diversification and performance of firms have arrived at conflicting results and lack of consensus (Afzaet al., 2008; Johnson and Scholes, 2005; Mc Dougall and Round, 1984). The lack of consensus has been attributed to the use of different theoretical views, time periods, databases, samples, operationalization of variables, different econometric techniques and the countries in which the study was carried out (Benito-Osorio, 2012; Chang, 2007).
A general theory on the diversification effect does not exist (Afzaet al., 2008; Mc Dougall and Round, 1984). As such, there are various theories that have been presented to explain the relationship between related product diversification strategy and performance of businesses. Based on the divergent theories used and lack of consensus, this study proposes that related product diversification may lead to increased performance or vice versa. Higher performance may be attributed to value addition to a product which may attract better prices in the market. On the other hand, consumers have different tastes and preferences for commodities and therefore if consumers do not prefer a certain value added product, it may fail to sell leading to decreased performance.
Initial empirical studies seemed to agree that relatedly diversified firms performed better than unrelatedly diversified firms (Rumelt, 1975; Rumelt, 1982). The findings were supported by Palepu (1985) based on a study of 30 firms in the food manufacturing industry finding superior profitability of related firms compared to unrelated ones. Similar findings by Varadarajan (1986)indicated that firms diversifying through greater depth in diversity were likely to enjoy superior financial performance than firms that diversified through greater breadth in diversity.Support for these findings was also reinforced by Capon et al(1988) with regard to superior financial performance for related diversification, but they suggested that relatedness by market type (consumer or industrial) could be the explanatory factor.
A different perspective by other researchers alludes to the fact that high product diversification is a means of escaping the poor profitability in the industry and a means of reducing perceived performance gaps by a firm (Christensen and Montgomery, 1981). This argument was supported by Burgers et al (2009) who indicated that the initial profitability situation, the opportunities available as well as the challenges faced are what determine the strategy that a firm was likely to pursue; with high profitability encouraging specialization and low profitability encouraging diversification. The central argument underlying this proposition is that neither related nor unrelated diversification is the better strategy, but the prevailing environment is what determines the strategy that a business is likely to pursue.The preceding arguments underscore the need for carrying out research based on specific industries, countries and even sectors.
2.1. Change in the Regulatory Framework in the Informal Dairy Sector in Kenya
consultation with the Kenya Dairy Board (KDB) and other sector players (Baiya and Kithinji, 2010). It was also based on efforts spearheaded by Smallholder Dairy Project (SDP)to revise the old dairy policy which was based on the “colonial dairy policy that criminalized the activities of small scale milk vendors to protect the interests of large scale settler dairy producers professing to be concerned about food safety and quality” (Kaitibieet al.,
2010 p.1494).
There has been proactive engagement by the KDB in training and certification of small-scale milk vendors (SSMVs) in the informal sector to safeguard public health and address quality concerns rather than trying to stamp it out (Baiya and Kithinji, 2010; Kamundi, 2014; Leksmonoet al., 2006). The Dairy Traders Association (DTA), a body formed in 2009 to ensure self regulation of the informal milk market at cluster level, enforces a traders’ code of conduct and members seen not to be adhering to it are subjected to fines which has reduced milk adulteration (Baiya and Kithinji, 2010). The regulation of the informal milk sector in Kenya has had positive effects with statistics indicating that the dairy enterprises have been recording increased profitability leading to upgrading of skills, equipment, quality and increased traded milk volumes (Baiya and Kithinji, 2010). Evidence presented by two key studies on the impact of the legalization of the informal sector in Kenya suggest that there has been a marked economic improvement in performance of smallholder dairy farmers and small scale milk vendors (Kaitibieet al., 2010; Leksmonoet al., 2006).
2.2. Formalizing or Informalizing in the Dairy Sector in Kenya?
A review of past studies suggests that there is limited strategic management literature with regard to the strategic choices made by African business firms especially on smallholder farmers and their performance (Jayne et al., 2010; Tvedtenet al, 2014). Gelb et al (2009) noted that there is no difference in the performance of small formal and small informal firms in East Africa with both having the same level of productivity, their argument being that the explanation could lie in the weak delivery of services and ability to enforce formalization. There has been a tendency to give across the board generalizations on enterprise performance in Africa yet there is need to focus on specifics in terms of country, industry, sector and strategy dynamics with regard to performance in order to understand why businesses operating in similar circumstances adopt different strategies and perform in different ways (Muriuki, 2003; Tvedtenet al., 2014). While successful performance of business enterprises in Africa is sometimes pegged on transitioning from the informal to the formal sector (Tvedtenet al., 2014), evidence indicates that informal institutions are just as important shapers of enterprise development in Africa as the formal institutions are (Pedersen and McCormick, 1999). A study comparing the performance of small informal and small formal firms in South and East Africa indicated that informal firms in the latter region are potential sources of growth and employment creation (Gelb et al., 2009). The dominance of the informal dairy sector in Kenya is exemplified by similar trends in Uganda, Tanzania and India with the latter being the leading country in the world in dairy production, though the economic gains in Kenya since the legalization of the sector stand out (Kaitibieet al., 2010).
In Kenya, about 80 per cent of the milk consumed in the domestic market is produced by small-scale producers and marketed through informal channels (Government of Kenya, 2003). This could be attributed to various reasons. Key among them are; the informal channel fetches better prices for the farmers and is sold at lower prices to consumers than the formal channel, it generates immediate cash flow to farmers, the preference by Kenyans for raw milk due to the high butterfat content, easy accessibility and the fact that it can be sold in variable quantities (Muriuki, 2011; TechnoServe, 2008). Farmers selling their milk through the informal market attract prices that are 22 percent higher than those selling through the formal market with the cash based traders selling through the informal market charging prices that are 48 per cent lower per litre compared to the formal market (Haggbladeet al., 2012; Karanja, 2003). Producers selling to bulking agents such as cooperatives and chilling hubs receive a lower price of about $ 0.30-0.33 per litre of milk while cash based traders in the informal sector purchase the milk at $ 0.33-0.44 per litre, (Haggbladeet al., 2012; StichtingNederlandseVrijwilligers, 2013) representing a difference of about $ 0.11 per litre. A farmer selling milk through the formal sector needs 6 cows to break even, but a farmer selling through the informal sector needs only 5 cows to break even (StichtingNederlandseVrijwilligers, 2013). As noted by Gelb et al., (2009 p.2) the decision on whether to formalize or stay informal may be quite “idiosyncratic” in East Africa.
were unable to sell their milk, the informal sector recorded increased sales picking up most of the milk that the formal sector was rejecting as a result of reduced demand (Baiya and Kithinji, 2010). There has been a behavioural change since the informal sector was legalized with some milk processors in the formal sector encouraging the informal sector to undertake milk processing into value added dairy products (Leksmonoet al.,
2006). This suggests that exploring value addition opportunities in informal dairy sector could indeed be a solution to the milk glut problem.
2.3. Value Addition in the Dairy Sector
The concept of value has attracted debate in the research field. There seems to be no consensus with regard to the definition of the term “value”. For instance, the Resource Base View (RBV) theory has been criticized for tautology in the definition of value (Kraaijenbrink, 2010). There is a strand of knowledge that indicates that value is determined endogenously, by the firm (Makadok, 2001). This is supported by Capon et al. (1988) who inferred that value addition may refer to related or linked diversification, that is, organizations in which the group of businesses emerged as a result of incremental steps from a core. It is also supported by Thompson Jr. et al(2005) who alluded to the fact that related diversification only makes strategic business sense if the outcome in terms of performance was added shareholder value. The central argument underlying these propositions is that value is determined by the firm based on the performance outcome of its internal activities. A different strand of knowledge argues that value is determined exogenously, by the market (Priem and Butler, 2001). This study seeks to show that value addition can be tested through related product diversification strategy. It also seeks to agree with the assertion that value is determined endogenously through the business’ internal activities.
While adding value to farm and livestock products before they reach the local and international market is one of the key aims of Vision 2030, value addition in the dairy value chain is still a challenge in Kenya (Republic of Kenya, 2007). In the informal market, only 16 per cent of the milk goes through artisanal processing and is sold as homemade sour milk (mala or lala) or yoghurt, while in the formal sector, very similar statistics prevail with 85 per cent of the milk being sold fresh, yoghurt makes 3 per cent, fermented milk 7 per cent, powder milk 3 per cent, with cheese and butter making a paltry 2 per cent of value added products sold (Techno Serve, 2008; Muriuki, 2011). These statistics indicate that there is very little value addition in the dairy sector in Kenya.
Value addition has been hailed as one of the solutions to the perishability challenge of milk by converting it to a more durable form and hence reducing farm losses (Kiptarus, 2005). However, value addition to milk in Kenya has been fraught with challenges especially the prohibitive taxation policy. For instance, there is a high level of taxation for yoghurt processing (TechnoServe, 2008). This may explain why very few of them undertake value addition to milk despite its perceived benefits. However, with the legalization of the informal milk market in Kenya, many mobile traders are opening milk bars and increasingly processing milk into mala
and yoghurt with the DTA providing business training, quality improvement courses and protection from harassment from authorities (Baiya and Kithinji, 2010).
There are different perspectives as to the actual performance of dairy products. One perspective is that the dairy sector worldwide has continued to grow expansively due to the increased global demand for a variety of milk based products(DairyNZ, 2009; Jayne et al., 2010). Evidence from Latin America suggests that the production of cheese by small Salvadoran enterprises had increased, albeit the cheese was targeted at the local market (Pietrobelli and Rabelotti, 2006). The other perspective is that among the problems facing the dairy sector is the absence of proper consumer education to appreciate the value of fresh milk and milk products suggesting below expected thresholds of performance (Ranaweera, 2009). In the informal sector, most dairy enterprises lack the necessary knowledge and business skills to measure the costs and hence the profitability or otherwise of their businesses (TechnoServe, 2008). This indicates challenges in estimating and calculating the actual performance of these enterprises. Based on the arguments presented, it is hypothesized that:
Hypothesis: Dairy products thathave value added perform better compared to dairy products that have no value added.
III.
Research Methodology
informal dairy sector are not available, to obtain data one has to rely on the use of recall information (Kaitibieet al., 2010). Based on these facts, the information obtained from respondents on performance was based on recall. The county has 12 sub-counties namely: Gatundu South, Gatundu North, Ruiru, Thika, Githunguri, Kiambu, Limuru, Kikuyu, Lari, Juja, Kiambaa and Kabete. Kiambu County is dominated by milk bars and small scale mobile traders (Kaitibieet al., 2010). The milk bars were mainly targeted in this study as they have a business premises and therefore have the potential to undertake value addition to milk. Clustered sampling was used to divide Kiambu County into sub-counties or clusters. The 12 sub-counties were treated as clusters and then quota sampling was used to identify 32 respondents from each. The total sample size was therefore 384 respondents.
3.1 Data Collection Procedure and Analysis
Questionnaires were used as the data collection instruments. Consistent with Kaitibieet al., (2010) study on the informal dairy sector in Kenya, profit per litre was used to capture information on level of profitability. Information on profit per litre of milk vis a vis that of value added dairy products over a three year period was elicited from the respondents. The International Standard Industrial Classification of All Economic Activities (ISIC), Rev.4 codes were used to define the industry segments and groups (United Nations, 2008). Products belonging to different four-digit ISIC industries within the same two-digit industry group were treated as related while products from two-digit ISIC industry groups were treated as unrelated (Hittet al., 1997; Palepu, 1985).
Analysis of data collected was first done using descriptive statistics including mean and standard deviation and then hypothesis testing was done using the t-test. A non directional (two-tailed test) was used to test whether the sample means are different (Salkind, 2010).
IV.
Presentation And Discussion Of Findings
The response rate for the questionnaires was 65% (n=250) and was deemed sufficient for the analysis. Descriptive statistics indicated that 56.8% of the respondents were female while 43.2% were male. This indicates that there are more women engaged in small scale milk vendor business compared to men in the study group. The findings also suggest that more women are being empowered to start their own income generating activities and have the ability to run successful businesses. On marital status, 52.4% were single while 47.2% were married. Most of the respondents had acquired basic education with 11.6% having a degree, 39.6% having a diploma, 46.8% having secondary education and only a paltry 2% having primary education as the highest level of education acquired. This indicates that the sector is attracting a high number of well educated people with over 51% having acquired tertiary education. This may also point to the fact that an increasing number of well educated people who cannot get formal employment are joining the informal small scale sector. It may also suggest that the business owners are able to understand skills on adding value to milk and possess knowledge of conducting business.
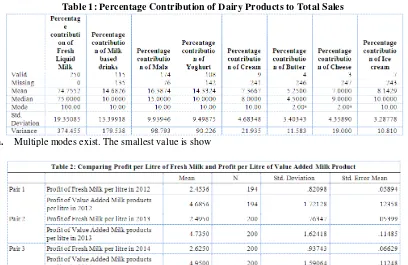
Table 1 provides descriptive statistics on the percentage contribution of the dairy products to the total sales of the business. All the respondents sell raw milk but they add value to milk at varying degrees. The contribution of milk to the total sales is highest (X = 74.76, SD= 19.35), followed by mala (fermented milk) at
(X =16.39, SD= 9.94), milk based drinks (such as tea with milk)
(X =14.68, SD= 13.40), yoghurt ( X =14.33, SD= 9.50), ice cream (X =8.14, SD= 3.29), cream (X
=7.37, SD= 4.68), Cheese (X =7.00,SD= 4.36) and lastly butter (X =5.25, SD=3.40). The variation between the contribution of milk to the total sales and the other value added dairy products is high. This provides credence to the findings by various researchers on the preference for purchasing raw fresh milk by Kenyans (TechnoServe, 2008; Muriuki, 2011) and that there is very little value addition to dairy products (Republic of Kenya, 2008; TechnoServe, 2008; Muriuki, 2011). The findings also support that there is very little diversity of milk products and that their consumption is very low in the domestic market (Republic of Kenya, 2010). The findings also point out that despite the perception that SSMVs only add value in terms of milk based drinks,
mala and yoghurt, a few of the enterprises are processing ice cream, cheese and butter. This indicates that with adequate training, more of them can venture into these higher value added products.
in 2012 was (X = 4.69, SD= 1.72) and that of fresh milk was (X = 2.45, SD= 0.82). The mean profit per litre for value added milk products in 2013 was (X = 4.74, SD= 1.62) and that of fresh milk was
(X = 2.50, SD= 0.76). The mean profit per litre for value added milk products in 2014 was ( X = 4.95, SD= 1.59) and that of fresh milk was (X = 2.63, SD=0.94). The deviation from the mean profit per litre for value added milk products is also higher than that of profit per litre of fresh milk in all the three years. Table 3 shows the paired sample t-test results which revealed a significant difference in profits per litre made before and after value addition in 2012; (t (193) = -18.18, p < 0.001). Similar results were replicated in 2013 (t (199) = -18.98, p < 0.001) and in 2014 (t (199) = -19.78; p < 0.001).
The results therefore provide support for the hypothesis that products thathave value added perform better in terms of profitability compared to products that have no value added in the informal dairy sector in Kenya. However the percentage contribution of milk to the total sales of the businesses is very high compared to that of value added dairy products in the informal dairy sector providing support for the dominance of milk sales compared to value added dairy products in Kenya. The results seem to suggest that depending on the measure of performance used, different results may be obtained on the diversification and performance linkage. This is in line with findings of Hall Jr. and Lee (2010) who obtained different results on the diversification and performance relationship when they used performance based on Return on Assets (ROA) and found they were negatively related but no significant results were found when they used market-based performance measures.
Table 4 reveals that there is a high pair-wise correlation between profit of fresh milk per litre and profit of value added milk products per litre in 2012 (r = 0.252, p< 0.001), in 2013 (r = 0.175, p= 0.013) and also in 2014 (r = 0.217, p= 0.002). The gender pair-wise correlation as shown on table 5 revealed that for women, high profits were made in selling value added products as well as with selling fresh milk. In 2012, the statistics for women revealed a high pair-wise correlation between profit of fresh milk per litre and profit of value added milk products per litre (r = 0.268, p= 0.004), in 2013 (r = 0.211, p= 0.022) and also in 2014 (r = 0.279, p= 0.002). On the other hand for the men, the statistics revealed no pair-wise correlation between profit of fresh milk per litre and profit of value added milk products per litre in 2013 (r = 0.124, p= 0.267) and also in 2014 (r = 0.135, p= 0.226). This could be attributed to the fact that in Africa, there are more women than men involved in agricultural related businesses and in the informal trade. It could also be attributed to the fact that women tend to be more patient than men in business. Any interventions made especially on training on value addition to milk are likely to benefit women to a larger extent compared to men based on the preceding results.
The high profitability of value added dairy products compared to raw fresh milk indicates that if more dairy entrepreneurs are trained to produce products like yoghurt, butter and cheese targeted at the local market, their performance may increase especially during periods of milk gluts. Assistance can also be given to the traders by providing them with simple equipment for the processing of products like cheese. This can be done by clustering the traders into groups, with the equipment being owned jointly by the group. Processing and marketing of the value added products can then be done at group level with government and key stakeholder support. This will enhance efficiency and quality control of the processed products. However, success in undertaking value addition to milk must be pegged on creating consumer awareness on the need to diversify their diets from just consuming milk and on key nutrients found in products like yoghurt and cheese. For instance, vitamin K2 found in cheese and butter has been cited as having the ability to prevent some diseases (Lock et al., 2008).
V.
Conclusion, Recommendations And Limitations
The study was conducted to find out if related product diversification in form of value added milk products yields better performance compared to the performance of raw fresh milk in the informal sector. The study found significant superior performance for value added dairy products compared to raw fresh milk in terms of profit per litre. It also found that raw fresh milk contributed largely to the total sales of the business compared to value added dairy products.
The large percentage of well educated participants in the dairy informal sector point to a need to create awareness that entrepreneurship is an attractive and alternative source of employment to the growing number of graduates leaving colleges and universities in Kenya each year. It also suggests that the well educated business owners are able to understand concepts on value addition. Policies on training the informal dairy sector participants on value addition should therefore be drafted with an awareness that those trained could also serve as trainers to other SSMVs especially if done at group level creating a multiplicity effect. The policy framework on entrepreneurship training at institutions of higher learning should be strengthened to incorporate a business incubation model for students with innovative ideas to nurture their practical business skills.
The findings indicate that value addition to dairy products has positive implications on the profitability of the business and more informal dairy enterprises should be encouraged to add value to milk. A few enterprises are venturing into processing ice cream, cheese and butter indicating that SSMVs have the ability to process high value dairy products which attract better profits. The excess milk generated during the rainy season can be used for value addition, hence reducing its wastage by transforming it into profitable products. It was however noted that most of the traders do not keep business records and therefore this is an area that stakeholders should target in terms of training and sensitization. The findings provide useful insights on the implications of related product diversification into value added products in the informal sector in developing countries. They also add to the available limited evidence that legalizing the informal sector in developing countries instead of criminalizing it can result in improved gains to the SSMVs and therefore to the economy as a whole. The government, KDB as well as key actors in the dairy sector therefore have a major role to play to continue offering more support to it. This paper provides initial findings on the effect of value addition to milk on performance of informal dairy enterprises after legalization of the sector in Kenya.
The findings from this study are based on certain limitations. One is that most of the traders do not keep records of their business activities and therefore the figures they provided were based on estimates. As a result, it was not possible to estimate overall profitability of the entire business activities from the enterprises. Secondly, the study was conducted in Kiambu County which has the advantage of close proximity to Nairobi, the capital city of Kenya. This may make it have an advantage over other counties due to high demand for dairy products and better prices in the market. A study covering other counties is therefore recommended in order to have a holistic picture on the implications of value addition to dairy products in the entire country. Finally, this study has used the product diversification perspective. Past studies that have used the related product diversification perspective have yielded different findings based on its effect on performance. The results should therefore not be generalized to all developing countries and to all informal sector studies.
Acknowledgement
I wish to acknowledge the support of Africalics, Globelics, Aalborg University and Mount Kenya University for their support.
References
[1]. Afza, T., Slahudin, C. and Nazir, M. (2008). Diversification and Corporate Performance: An Evaluation of Pakistani Firms. South Asian Journal of Management, 15(3), 7-18.
[2]. Amin, M. (2010). How Do Manufacturing and Service FirmsDiffer within the Informal Sector? Enterprise Surveys. Enterprise Series, No.14. World Bank Group.
[3]. Ansoff, H. I. (1957). Strategies for Diversification. Harvard Business Review,35 (5), 113-124.
[4]. Baiya, H. and Kithinji, J. (2010). Transforming the Dairy Sector: Benefits from the Formalization of the Raw Milk Trade in Kenya. SITE Case Study. Nairobi: SITE Enterprise Promotion.
[5]. Benito-Osorio, D., Guerras-Martı´n, L. and Zun˜iga-Vicente, J. (2012). Four Decades of Research on Product Diversification: A Literature Review. Management Decision, 50 (2), 325-344.
[6]. Benjamin, N. and Mbaye, A. (2014). Informality, growth, and development in Africa. United Nations University, World Institute for Development Economics Research. WIDER Working Paper 2014/052.
[7]. Birthal, P., Joshi, P., Roy, D. and Thorat, A. (2007). Diversification in Indian Agriculture towards High-Value Crops: The Role of Smallholders. International Food Policy Research Institute (IFPRI) Discussion Paper 00727.
[8]. Bolo, A. Z., Lorika, J.Obonyo, P. (2011). Effectiveness of the Value Chain Strategy In the Selected Producer-Owned Dairy Groups in Kenya. Prime Journal of Business Administration and Management (BAM), 1(3), 93-100.
[9]. Burgers, W., Padgett, D., Bourdeau, B. and Sun, A. (2009).Revisiting the Link Between Product and Industry: Diversification and Corporate Performance. International Review of Business Research Papers, 5(1), 367- 379.
[10]. Capon, N., Hulbert, J., Farley, J. and Martin, L. E. (1988).Corporate Diversity and Performance: The Impact of Market Specialization. Strategic Management Journal, 9(1), 61-74.
[11]. Chang, J. (2007). Ownership Structure, Diversification Strategy and Performance: Implications For Asian Emerging Market Multinational Enterprises Value Creation in Multinational Enterprise. International Finance Review, 7(1), 125–148.
(AAAE) and 48th Agricultural Economists Association of South Africa(AEASA) Conference, Cape Town, South Africa, September 19-23, 2010.
[13]. Christensen, H. K., and Montgomery, C.A., (1981).Corporate Economic Performance: Diversification Strategy versus Market Structure. Strategic Management Journal, 2(4), 327-343.
[14]. County Government of Kiambu (2013).County Integrated Development Plan (CIDP) 2013-2017.
[15]. DairyNZ (2009).Strategy for New Zealand Dairy Farming, 2009/2020. Retrieved October 6th, 2013 from http://www.dairynz.co.nz/file/fileid/16856.
[16]. Gajigo, O. and Hallward- Driemeir, M. (2012). Why do some Firms abandon Formality for Informality? Evidence from African Countries. Working Paper Series, No. 159. African Development Bank, Tunis, Tunisia.
[17]. Gelb, A., Mengistae, T., Ramachandran, V. and Shah, M. (2009).To Formalize or Not to Formalize? Comparisons ofMicroenterprise Data from Southern and East Africa.Working Paper Number 175. Washington, D.C.: Center for Global Development
[18]. Government of Kenya (2003). Economic Recovery Strategy for Wealth and Employment Creation 2003-2007. Nairobi: Government Printers.
[19]. Grant, R. M., Jammine, A.P. and Thomas, H. (1988) Diversity, Diversification and Profitability among British Manufacturing Companies. Academy of Management Journal, 31, 771-801.
[20]. Grant, R.M. (1991). The Resource- Based Theory of Competitive Advantage: Implications for Strategy Formulation. California Management Review, 33(3), 114-135.
[21]. Haggblade, S., Theriault,V., Staatz, J. Dembele, N. and Boubacar Diallo (2012). A Conceptual Framework for Promoting Inclusive Agricultural Value Chains.Improving the Inclusiveness of Agricultural Value Chains in West Africa. Paper prepared for the International Fund for Agricultural Development (IFAD). Michigan State University.
[22]. Hall Jr., E. and Lee, J. (2010). Profitability and Curvilinearity: A Study of Product and International Diversification. The Journal of International Management Studies, 5(1), 109-117.
[26]. Intergovernmental Authority on Development Center for Pastoral Areas and Livestock Development (2013). The Contribution of Livestock tothe Kenyan Economy. IGAD Centre for Pastoral Areas and Livestock Development (ICPALD). Policy Brief No.ICPALD 4/CLE/8/2013.
[27]. Jayne, T., Mather, D. and Mghenyi, E. (2010). Principal Challenges Confronting Smallholder Agriculture in Sub-Saharan Africa. World Development, 38 (10), 1384–1398.
[28]. Johnson G. and Scholes K. (2005). Exploring Corporate Strategy, Texts and Cases (6thed.). Singapore: Pearson Education. [29]. Kaitibie, S., Omore, A., Rich, K. and Kristjanson, P. (2010). Kenyan Dairy Policy Change: Influence Pathways and Economic
Impacts. World Development 38 (10), 1494–1505.
[30]. Karanja, A. (2003).The Dairy Industry in Kenya: The Post-Liberalization Agenda. Tegemeo Institute. Retrieved September 27th, 2013 from www.tegemeo.org/documents/other/dairy.pdf
[31]. Kenya Agricultural Research Institute (2009). Eastern Africa Agricultural Productivity (EAPP). Country Document. The Regional Dairy Center of Excellence
[32]. Kamundi, K. (2014). Corporate Leadership in Dairy Industry: Case of Kenya Dairy Board. European Journal of Business and Management, 6(33), 22-35.
[33]. Kiptarus, J. K. (2005, March). Focus on Livestock Sector: Supply Policy Framework Strategies Status and Links with Value Addition. Paper presented at workshop on value assessment food and export investment report, Nairobi.
[34]. Kraaijenbrink, J., Spender, J.C. and Groen, A.J. (2010). The Resource Based View: A Review and Assessment of its Critiques. Journal of Management,36(1), 349-372.
[35]. Lancaster, K. J. (1966). A New Approach to Consumer Theory. Journal of Political Economy, 74(2), 132-157.
[36]. Lee, K., Peng, M.W. and Lee, K. (2008).From Diversification Premium to Diversification Discount During Institutional Transitions. Journal of World Business, 43(1), 47–65.
[37]. Leksmono, C., Young, J., Hooton, N., Muriuki, H. and Romney, D. (2006). Informal Traders Lock Horns with the Formal Milk Industry: The role of research in pro-poor dairy policy shift in Kenya. Overseas Development Institute (ODI) working paper 266. Nairobi: ODI and ILRI.
[38]. Lock, A., Destaillats, F., Kraft, J. and German, B. (2008).Introduction to the Proceedings of the Symposium“Scientific Update on Dairy Fats and CardiovascularDiseases”.Journal of the American College of Nutrition, 27(6), 720-754.
[39]. Makadok, R. (2001). Dialogue: A Pointed Commentary on Priem and Butler. Academy of Management Review, 26(4), 498-499. [40]. McDougall, F. M. and Round, D. K. (1984).A Comparison of Diversifying and Non-diversifying Australian Industrial Firms.
Academy of Management Journal, 27(2), 384-398.
[41]. Muriuki, H.G. (2003). Milk and Dairy Products, Post-harvest Losses and FoodSafety in Sub- Saharan Africa and theNear East. FAO Prevention of Food Losses Programme. A Review ofthe Small Scale Dairy Sector – Kenya.
[42]. Muriuki, H.G. (2011). Dairy Development in Kenya. Report presented to Food and Agriculture Organization of the United Nations, Rome.
[43]. Palepu, K. (1985). Diversification Strategy, Profit Performance and Entropy Measure. Strategic Management Journal, 6(3), 239-255.
[44]. Palich, L.E, Cardinal, L.B. and Miller, C.C. (2000). Curvilinearity in the Diversification Performance Linkage: An Examination of over Three Decades of Research. Strategic Management Journal, 21(2), 155-174.
[45]. Pedersen, P. and McCormick, D. (1999). African business systems in a globalising world. The Journal of Modern African Studies, 37, (1), 109-135.
[46]. Pietrobelli, C. and Rabellotti, R. (2006). Upgrading to Compete:Global Value Chains, Clusters,and SMEs in Latin America.
Inter-American Development Bank,
[47]. Priem, R. L. and Butler, J.E. (2001). Is the Resource Based-View a Useful Perspective for Strategic Management Research? Academy of Management Review, 26(1), 22-40.
[48]. Ranaweera (2009). Sri Lanka: Opportunities for Dairy Sector Growth. Report presented to Animal Production and Health Commission for Asia and Pacific Food and Agriculture Organization of the United Nations Regional Office for Asia and the Pacific, Bangkok.
[49]. Republic of Kenya (2007). Kenya Vision 2030: A Globally Competitive and Prosperous Kenya. Nairobi: Government Printers. [50]. Republic of Kenya (2008). Kenya Vision 2030: A Globally Competitive and Prosperous Kenya. First Medium Term Plan
(2008-2012).Nairobi: Government Printers.
[51]. Republic of Kenya (2010). Kenya National Dairy Master Plan; Volume 1: A Situational Analysis of the Dairy Sub-sector. Ministry of Livestock Development. Nairobi: Government Printers. Retrieved September 24th, 2013 from http://www.livestock.go.ke. [52]. Republic of Kenya (2010). Housing and Population Census of 2009; Volume 1.Nairobi: Government Printers.
[53]. Republic of Kenya (2011). Ministry of Livestock Development Dairy Commercialization Programme (SDCP):Final Report; Volume 1.Impact Assessment Study. Nairobi: Government Printers.
[54]. Rumelt, R.P. (1975). Strategy, Structure and Economic Performance. The Business History Review, 49(2), 282-284. [55]. Rumelt, R.P. (1982).Diversification Strategy and Profitability. Strategic Management Journal, 3(4), 359-36. [56]. Salkind, N.J. (2010). Encyclopedia of Research Design: Volume 3. Los Angeles: SAGE Publications Inc. [57]. Singh, A. (2011). Diversification in agriculture. Retrieved from http://www.eoearth.org/view /article / 151757.
[58]. StichtingNederlandseVrijwilligers (2013). SNV Kenya/ Netherlands Development Organization: Dairy Sector Policy Study and Capacity Needs Assessment ofStakeholder Associations Report.
[59]. Techno Serve (2008, August). The Dairy Value Chain in Kenya. East Africa Dairy Development Program Report, Nairobi, Kenya. [60]. Thompson Jr. A., Strickland III, A. and Gamble, J. (2005). Crafting and Executing Strategy, Text and Readings (14thed.).New
York: Mc Graw Hill Irwin.
[61]. Tvedten, K., Hansen, M. and Jeppesen, S. (2014). Understanding the Rise of African Business: In search of business perspectives on African enterprise development. African Journal of Economic and Management Studies, 5 (3), 249-268.
[62]. United Nations (2008). International Standard Industrial Classification of All Economic Activities, Department of Economics and Social Affairs, Statistics Division, Statistical Papers. Series M No. 4/Rev4, New York.
[63]. Varadarajan, P.R. (1986).Product Diversity and Firm Performance: An Empirical Investigation. Journal of Marketing, 50(3) 43-57. [64]. Wambugu, S., Kirimi, L. and Opiyo, J. (2011). Productivity Trends and Performance of Dairy Farming in Kenya. Tegemeo
Institute of Agricultural Policy and Development. Egerton University, Kenya. WPS 43/2011.
Appendix: Tables
Table 1: Percentage Contribution of Dairy Products to Total Sales
Table 4: Pair-wise Correlation between Profit per Litre of Fresh milk and Profit per Litre of Value Added Milk Products