L
Journal of Experimental Marine Biology and Ecology 249 (2000) 145–163
www.elsevier.nl / locate / jembe
Effects of hypoxia on movements and behavior of selected
estuarine organisms from the southeastern United States
*
Catherine M. Wannamaker , James A. Rice
North Carolina State University, Department of Zoology, Box 7617, Raleigh, NC 27695-7617, USA
Received 6 October 1999; received in revised form 1 November 1999; accepted 18 January 2000
Abstract
Hypoxia, or low dissolved oxygen, remains a common occurrence in estuarine waters as human activity in coastal areas expands. Fish kills, probably the most recognized indicator of these and other water quality problems, have significantly increased in recent years in many Southeastern United States estuaries. While entire aquatic communities are impacted by changes in available oxygen, estuarine organisms serve as appropriate indicators of these changes as they exhibit complex physiological and behavioral responses to hypoxia. The consequences of hypoxia for these species depend on their ability to detect and avoid areas of low dissolved oxygen. We conducted a series of two-way, replicated choice experiments with juvenile spot (Leiostomus
xanthurus), pinfish (Lagodon rhomboides), croaker (Micropogonias undulatus), menhaden (Bre-voortia tyrannus), white mullet (Mugil curema), mummichog (Fundulus heteroclitus), and brown
shrimp (Penaeus aztecus) to determine their ability to detect and avoid specific levels of hypoxia. Additional data on organisms’ movement patterns, aquatic surface respiration, and ventilation rates
21
were collected. All species tested could detect and avoid 1 mg l dissolved oxygen. The hypoxia avoidance response differed among species, as some species exhibited an avoidance threshold while others exhibited a graded avoidance response. These data supply baseline information necessary to assess how some mobile estuarine organisms respond behaviorally to oxygen concentrations, and to understand how hypoxia more broadly impacts fish populations and estuarine community health. 2000 Elsevier Science B.V. All rights reserved.
Keywords: Avoidance; Dissolved oxygen; Fish behavior; Hypoxia; Sublethal effects
*Corresponding author. Present address: Senate Committee on Commerce, Science, and Transportation, Subcommittee on Oceans and Fisheries, 566 Dirksen Senate Office Building, Washington, DC 20510, USA. Tel.: 11-202-224-4767; fax: 11-202-228-0303.
E-mail address: catherine [email protected] (C.M. Wannamaker)]
1. Introduction
Coastal ecosystems are often negatively affected by the continuing growth of human activity around estuarine areas. Increased activity in coastal habitats and upstream nutrient loading often pollute these areas, causing subsequent changes in the oxygen budget of estuarine water. Hypoxia, or a low level of dissolved oxygen, is a typical consequence of the loading of nutrients such as nitrogen and phosphorus. It is clear that habitat degradation and continuing decreases in water quality are occurring in many coastal estuaries (Harned and Davenport, 1990; Breitburg, 1992; Howell and Simpson, 1994; American Rivers Foundation, 1997; Paerl et al., 1998), but the direct and indirect links between habitat quality and fish population responses remain unclear. Fish and invertebrates in both marine and freshwater systems exhibit complex responses to hypoxia (Cameron, 1970; Cech and Wohlschlag, 1973; Greaney and Powers, 1978; Burton et al., 1980; Steffensen et al., 1982; Vetter and Hodson, 1982; Weber and Kramer, 1983; Cech et al., 1984; Kramer, 1987; Lallier et al., 1987; Rutledge and Beitinger, 1989; Bejda et al., 1992; Petersen and Pihl, 1995). Although direct effects of hypoxia are more easily quantified, the indirect effects of hypoxia may be of equal or greater importance in understanding the links between water quality, fish populations, and estuarine community health.
Direct physiological responses to hypoxia are well documented. Mortality may result from exposure to hypoxia, and tolerances differ among species and life stages (Dorfman and Westman, 1970; Sylvester et al., 1975; Burton et al., 1980; Coutant, 1985). Juveniles have been documented to have decreased growth rates and predation efficiency in moderate to extreme hypoxia (Breitburg, 1992; Breitburg et al., 1994; Tallqvist et al., 1999). Increases in ventilation rate with declining oxygen, which may ultimately affect energy allocation to other activities and result in reduced fitness, are common among marine fishes (Cech and Wohlschlag, 1973; Steffensen et al., 1982; Kramer, 1987; Lallier et al., 1987; Pihl et al., 1991; Breitburg et al., 1994). When activities necessary to maintain homeostasis are performed at a higher metabolic cost in the absence of oxygen, less of the organism’s energy budget is available for growth; consequently, decreases in growth rates in hypoxic conditions are well documented, in some cases even resulting from episodic exposure (Atkinson, 1968; Vetter and Hodson, 1982; Weber and Kramer, 1983; Cech et al., 1984; Bejda et al., 1992; Petersen and Pihl, 1995).
Indirect or sublethal effects of hypoxia may include impacts on fish distribution, behavior, feeding rate, competition, and vulnerability to predators (Kramer, 1987; Pihl et al., 1991; Llanso, 1992; Pihl et al., 1992; Breitburg, 1992; Breitburg et al., 1994; Howell and Simpson, 1994; Rahel and Nutzman, 1994; Petersen and Pihl, 1995). Habitat shifts, often critical for survival, are well documented in hypoxic zones (Pihl et al., 1991; Howell and Simpson, 1994; Thiel et al., 1995). While there is a general pattern of migration away from areas of low dissolved oxygen, there are species-specific differences in the level of hypoxia that elicits this emigration (Magnuson et al., 1985; Marotz et al., 1990; Pihl et al., 1991, 1992; Rosenberg et al., 1992; Howell and Simpson, 1994; Thiel et al., 1995; Petersen and Pihl, 1995).
hypoxia, potentially resulting in higher densities and increased competition for resources in well-oxygenated areas (Eby and Crowder, 1998, personal communication). Studies in other estuarine systems document both opportunistic exploitation of benthic organisms that emerge with the onset of hypoxia (Llanso, 1992; Pihl et al., 1992; Rahel and Nutzman, 1994), and depressed predator feeding rates in low dissolved oxygen (Breitburg et al., 1994; Petersen and Pihl, 1995).
The mechanisms by which fish detect and avoid hypoxia remain unclear. Early studies by Jones (1952) suggested that fish could not actively detect and avoid hypoxia but that escape movements were initiated as a result of respiratory stress. More recently, studies have documented avoidance of typically favored habitats when conditions of hypoxia prevail, suggesting that fish can detect and avoid hypoxia and that there is a critical avoidance threshold (Stott and Cross, 1973; Stott and Buckley, 1979; Beitinger and Petit, 1984; Suthers and Gee, 1986).
Southeastern US estuarine systems support a wide array of both ecologically and commercially important species. While data on hypoxia tolerance exist for some species (Table 1), there is still a shortage of crucial information necessary to link decreased water quality and fish population responses. Models that predict water quality based on land use, nutrient loading, and hydrodynamics are being developed for the Neuse River, North Carolina, the Chesapeake Bay of Maryland and Virginia, and other systems. Most current models predict water quality based on nutrient loading, water motion, and other parameters including phytoplankton biomass, salinity, and dissolved oxygen concen-tration (Bowen, 1997). However, at present they lack the ability to include the potential impact of hypoxia on survival, movements, growth, and population dynamics of estuarine species.
We attempted to generate data necessary to begin establishing the link between fish and shellfish population response, water quality, and estuarine community health by experimentally determining: (1) if juvenile estuarine species including spot, croaker, pinfish, menhaden, striped mullet, mummichog, and brown shrimp could detect hypoxia and subsequently move away from areas of hypoxic water, (2) if these species exhibited a threshold response or a graded response to dissolved oxygen concentrations offered in a series of sequential two-way choice experiments, and (3) ventilation rates over a range of oxygen concentrations for selected species in order to identify ventilatory response to declining oxygen and to identify species-specific differences in magnitude of the response.
2. Methods
2.1. Collection and maintenance of study organisms
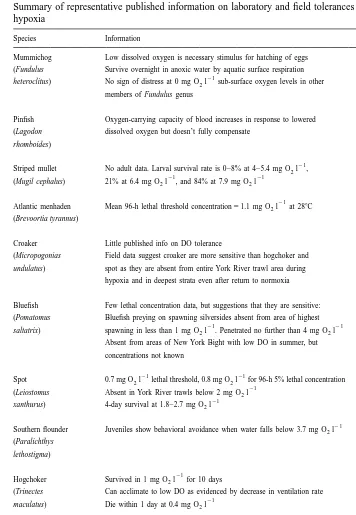
Table 1
Summary of representative published information on laboratory and field tolerances of estuarine organisms to hypoxia
Species Information Source
Mummichog Low dissolved oxygen is necessary stimulus for hatching of eggs Di Michele and Taylor, 1980 (Fundulus Survive overnight in anoxic water by aquatic surface respiration Abraham, 1985
21
heteroclitus) No sign of distress at 0 mg O l2 sub-surface oxygen levels in other Rutledge and Beitinger, 1989 members of Fundulus genus
Pinfish Oxygen-carrying capacity of blood increases in response to lowered Cameron, 1970 (Lagodon dissolved oxygen but doesn’t fully compensate
rhomboides)
21
Striped mullet No adult data. Larval survival rate is 0–8% at 4–5.4 mg O l2 , Sylvester et al., 1975
21 21
(Mugil cephalus) 21% at 6.4 mg O l2 , and 84% at 7.9 mg O l2
21
Atlantic menhaden Mean 96-h lethal threshold concentration51.1 mg O l2 at 288C Burton et al., 1980 (Brevoortia tyrannus)
Croaker Little published info on DO tolerance Lassuy, 1983 (Micropogonias Field data suggest croaker are more sensitive than hogchoker and Pihl et al., 1991 undulatus) spot as they are absent from entire York River trawl area during
hypoxia and in deepest strata even after return to normoxia
Bluefish Few lethal concentration data, but suggestions that they are sensitive: Middaugh et al., 1981 (Pomatomus Bluefish preying on spawning silversides absent from area of highest
21 21
saltatrix) spawning in less than 1 mg O l2 . Penetrated no further than 4 mg O l2
Absent from areas of New York Bight with low DO in summer, but Oliver et al., 1989 concentrations not known
21 21
Spot 0.7 mg O l2 lethal threshold, 0.8 mg O l2 for 96-h 5% lethal concentration Burton et al., 1980
21
(Leiostomus Absent in York River trawls below 2 mg O l2 Pihl et al., 1991
21
xanthurus) 4-day survival at 1.8–2.7 mg O l2
21
Southern flounder Juveniles show behavioral avoidance when water falls below 3.7 mg O l2 Deubler and Posner, 1963 (Paralichthys
lethostigma)
21
Hogchoker Survived in 1 mg O l2 for 10 days Pihl et al., 1991 (Trinectes Can acclimate to low DO as evidenced by decrease in ventilation rate
21
maculatus) Die within 1 day at 0.4 mg O l2
21
Striped Bass Less than 2 mg O l2 lethal Coutant, 1985
21
(Morone Reduce active swimming, agitated below 3 mg O l2 Breitburg et al., 1994
21
saxatilis) Abundant when bottom water greater than 4 mg O l2 , partial avoidance
21
at 2.5 mg O l2 MD-DNR, unpublished
21
Depressed growth at less than 3.5 mg O l2 Cech et al., 1984
21
Naked goby Concentrations as low as 0.75 mg O l2 don’t affect survival Breitburg et al., 1994
21
(Gobiosoma bosc) Abundant in environments with periodic oxygen levels less than 2 mg O l2
Bay anchovy Most abundant fish in pollution stressed areas, and caught in areas with Robinette, 1983
21
conditions in the field. For all experiments, organisms of a given species were selected to be of similar size. Average total lengths were as follows: spot, 58.0 mm (66.9 S.D.), pinfish, 64.3 mm (64.2 S.D.), croaker, 82.3 mm (612.3 S.D.), menhaden, 103 mm (65.6 S.D.), mullet, 56.8 mm (65.9 S.D.), mummichogs, 55.8 mm (67.78 S.D.), and brown shrimp, 118.4 mm (611.5 S.D.).
All specimens were transported back to the National Marine Fisheries Service Beaufort Laboratory immediately following capture. Fish were held at 25–268C and ambient seawater salinity, which ranged from 28 to 35‰ throughout the study period. Holding tanks were aerated; dissolved oxygen in holding tanks ranged from 5.6 to 6.3
21
mg O l2 at all times. Pinfish, spot, mullet, croaker, mummichogs, and brown shrimp were held in separate flow-through 250-l rectangular holding tanks. Shrimp were provided with a layer of sand, since they typically burrow during daylight (Hughes, 1968). Menhaden were maintained in a 1500-l flow-through circular holding tank to allow individuals to swim continuously in schools. All species were acclimated in the laboratory for 3–10 days before experiments and were maintained on a photoperiod of 12-h light / dark.
2.2. Experimental protocol for choice trials
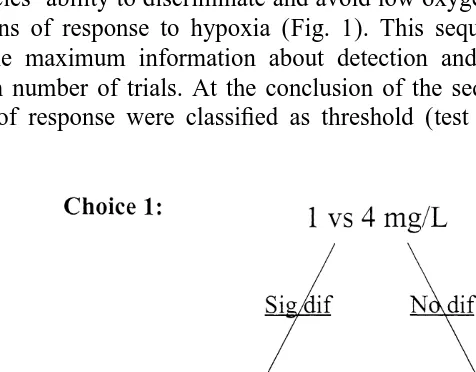
A sequence of replicated, two-way choice experiments was conducted to determine each species’ ability to discriminate and avoid low oxygen concentrations and to identify its patterns of response to hypoxia (Fig. 1). This sequential design was employed to obtain the maximum information about detection and avoidance responses with the minimum number of trials. At the conclusion of the sequence of choice trials, species’ patterns of response were classified as threshold (test organisms preferred the higher
oxygen concentrations only above a certain threshold level) or graded (test organisms preferred the higher oxygen concentration at several levels).
21
Initial trials offered a choice between 4 and 1 mg O l2 . If there was avoidance of 1
21
mg O l2 in this pairing, then the following experiment presented a narrower choice
21 21
between 2 and 1 mg O l2 . Conversely, if no avoidance of 1 mg O l2 occurred, then
21
fish were offered a wider choice between 6 and 1 mg O l2 . A third sequence of choice
21
experiments was then conducted for all species (Fig. 1). Following 2 vs. 1 mg O l2 21
trials, fish were offered a choice between 4 vs. 2 mg O l2 if there was no avoidance of
21 21
1 mg O l2 observed. Alternatively, if there was avoidance of 1 mg O l2 in 2 vs. 1
21 21
mg O l2 trials, fish were offered a third choice between 6 vs. 4 mg O l2 to test for a graded response in hypoxia avoidance. Depending on the outcome of the 6 vs. 1 mg
21
O l2 trials, fish were either presented with a third series of choice experiments
21 21
between 6 vs. 4 mg O l2 or 2 vs. 1 mg O l2 In addition, supplemental trials to further clarify response to less extreme hypoxia were conducted for some species.
2.3. Experimental procedure
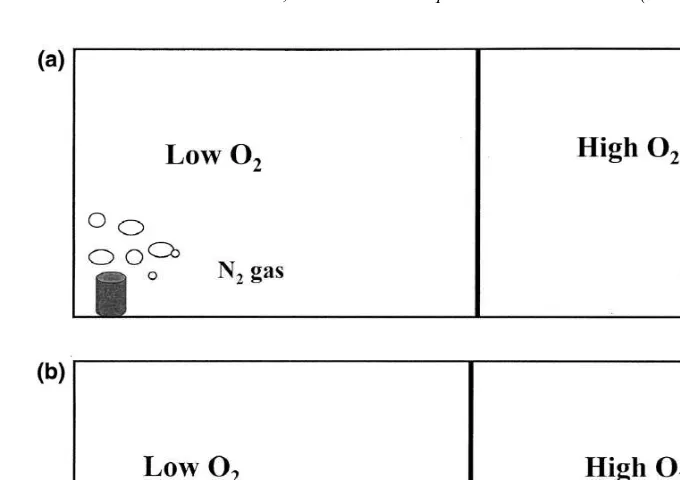
All trials followed the same procedure with modifications for some species to ensure natural behavior (see below). Experiments were conducted at temperatures of 25–268C and salinities between 28 and 35‰. These conditions are typical of summer conditions in the lower reaches of the Neuse River estuary and were consistent with conditions in the organisms’ holding tanks. Six replicate trials for each demersal species (spot, pinfish, croaker, and mummichogs) were conducted in a 234391-cm rectangular chamber. Water depth was 28 cm, and the chamber was divided into two 117391-cm halves by a removable scoured Plexiglas divider (Fig. 2A). The entire chamber was surrounded by a black plastic curtain with 636 cm eyeholes cut for observation to eliminate any effect of the observer on fish behavior.
Prior to fish introduction, nitrogen or air was bubbled in each side of the tank as necessary to establish the desired oxygen concentration. The water surface in both sides of the tank was covered with 3-mil thick clear plastic sheeting to minimize diffusion of oxygen from the air. Oxygen concentrations were monitored with Yellow Springs Instruments Models 57 and 85 dissolved oxygen meters. Probes were calibrated at the start of each experiment, and membranes were changed every 10 days.
At the beginning and end of experiments, dissolved oxygen readings were taken on each side of the tank 10 cm from the center divider and 10 cm from the end walls at mid- and near-bottom depths. In addition, spot checks were made throughout the chamber to ensure that starting dissolved oxygen concentrations never deviated from
21
target levels by more than 0.4 mg O l2 . Prior to introduction into the experimental chamber, three fish of a given species were held in their holding tanks in a cage measuring 27327320 cm constructed from black plastic mesh.
Fig. 2. The basic experimental setup. (A) Depicts the experimental chamber prior to fish introduction with the Plexiglas center divider in place and the nitrogen and air bubblers on. (B) Depicts the setup once fish are introduced, with the divider raised 60 mm and the bubblers off for the duration of the experiment.
experimental chamber where fish were released with minimal disturbance. The point of fish introduction, 70 cm from the left end of the experimental chamber, was the same for all trials. The lower and higher oxygen sides of the experimental chamber were switched after the first three replicates to eliminate bias toward any particular side of the tank or away from the point of introduction. Fish were allowed a 10-min acclimation period during which no data were recorded.
At the conclusion of the 10-min acclimation period, an observer positioned behind the curtain recorded observations on one focal individual picked at random from the three individuals. Data recorded during the 30-min trial included the number of moves between the two sides of the tank and the duration of time spent on each side of the tank. All observations were recorded using a datalogging program run on a Dell Latitude XP computer. Prior to trials, pilot studies were performed with each species to ensure that test organisms moved readily between sides of the tank if both were normoxic.
expected that lower oxygen concentrations would be avoided, calculated t-values were compared to one-tailed values at a 50.05.
2.4. Experimental modifications
While all experiments followed the general procedure described above, trials with white mullet, brown shrimp, and Atlantic menhaden required modification of the experimental chamber as these species would not readily pass beneath the raised divider. Experiments with white mullet were conducted in the same experimental chamber as demersal species, but because white mullet are a pelagic species, the raised divider was replaced by a 91337-mm Plexiglas divider with five 32-mm wide vertical slots to allow movement throughout the entire water column. This slotted vertical divider only
21
maintained oxygen concentrations within 0.4 mg O l2 of target concentrations for 30 min, so mullet trials were run for 20 min (following 10-min acclimation) and replicated seven times.
Because menhaden behavior is abnormal in tanks with corners, we constructed a figure eight-shaped experimental chamber within the tank using 0.8 mm thick fiberglass sheeting. Each half of the chamber was 85 cm in diameter by 90 cm long, and the entire chamber was 60 cm in height. The two sides of the chamber were connected by a 4-cm wide vertical passageway to allow fish movement between sides during experiments, and each set of choice trials was replicated six times.
Shrimp experiments were conducted in an experimental chamber similar to that used in the menhaden experiments. An aquarium measuring 54343.53120 cm with a water depth of 37 cm was fitted with a 6-cm wide passageway in the center by affixing two curved pieces of 1.56 mm thick GE Lexan Plexiglas to both sides of the tank. As in choice experiments with spot, pinfish, croaker, and mummichogs, a divider was raised 60 mm to allow shrimp to walk or swim through the passageway and experiments were replicated six times. The bottom of the tank was covered with 5-7 mm of beach sand. The experimental chamber was lit with a hanging lamp (7-W bulb) suspended 1.4 m over the tank. Shrimp experiments were run at light levels below 0.36 micro Einsteins
2 21
per m s to prevent burrowing, as studies suggest that members of the genus Penaeus often burrow during daylight and become active at low light intensities (Fuss and Ogren, 1966, Hughes, 1968). Shrimp experiments were carried out with one individual in each trial since shrimp were never observed schooling in the lab.
2.5. Ventilation rate experiments
Experiments to document ventilatory response to hypoxia were performed on spot, pinfish, white mullet, and croaker at dissolved oxygen concentrations of 1, 2, 3, 4, 5, and
21
6 mg O l . Experiments were conducted at 268C and 35‰ salinity in a 9-l aquarium
2
experimental chamber. Fish were allowed a 10-mm acclimation period, and then an observer counted the number of opercular beats over a 30-s interval. For each test oxygen concentration, data were recorded on ten different individuals of each species. Water was changed at the conclusion of each set of replicates.
Ventilation data were analyzed with linear regression to assess how ventilation rate varied with dissolved oxygen concentration. The slopes and intercepts of regression lines were compared among species using ANOVA at a 50.05.
2.6. Aquatic surface respiration experiments
Because mummichogs were observed attempting to perform aquatic surface
respira-21
tion in choice trials, experiments were conducted with mummichogs held in 1 mg O l2
to determine if individuals would perform aquatic surface respiration when prevented
21
from leaving hypoxic conditions. Hypoxic (1 mg O l2 ) and control normoxic (6 mg
21
O l2 ) trials were conducted in 9-l aquaria surrounded by black plastic blinds. The water level was 30 cm, and each tank was covered by a Styrofoam lid placed on the top of the aquarium to prevent diffusion but still allow fish access to the surface. Experimental treatments were created by bubbling nitrogen or air until the desired concentration was reached. Dissolved oxygen readings were recorded with a YSI Model 57 oxygen meter both before and after each trial.
At the start of experiments, two fish were introduced into the experimental chamber and allowed to acclimate for a 10-min period; for the next 30 min, we then recorded the duration of trips to the surface made by one randomly selected individual to perform aquatic surface respiration. Aquatic surface respiration was defined as attempting to breathe at the water’s surface by gulping air from the surface film (Kramer, 1987). Both control and hypoxic treatments were replicated seven times. Duration of aquatic surface respiration was calculated for each replicate. Time spent performing aquatic surface respiration in normoxia and hypoxia was compared using a two-tailed t-test ata 50.05.
3. Results
3.1. Choice experiments
21
Most species tested detected and avoided 1 mg O l2 in choice trials between 4 vs. 1
21 21
mg O l2 and 2 vs. 1 mg O l2 . There were additional differences between species according to treatment condition.
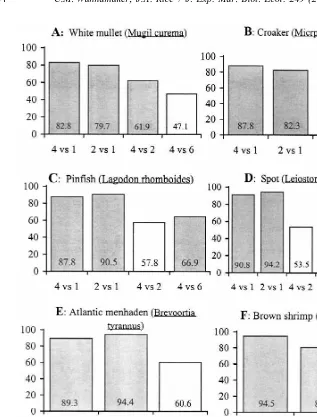
White mullet showed a strong preference for the higher oxygen concentration
21
concentration in 4 vs. 1 and 2 vs. 1 mg O l2 trials (Fig. 3A). In 4 vs. 1 and 2 vs. 1 mg
21
O l2 trials, mullet spent significantly more time in the higher oxygen concentrations (83 and 80%, respectively) than the lower dissolved oxygen side. This species also showed a significant preference (62%) for the higher oxygen concentration in the 4 vs. 2
21 21
Fig. 3. (A–G) Mean percentage of time spent in the higher oxygen concentration ( y-axis) for all treatments (x-axis). Shaded bars indicate significant preferences for the higher oxygen concentration.
significant preference for the higher oxygen concentration at oxygen levels below 4 mg
21
O l2 .
Croaker responses followed a similar trend to those of white mullet. Croaker exhibited
21
a strong preference for the higher oxygen concentration in 4 vs. 1 and 2 vs. 1 mg O l2
trials, spending 82–87% of their time in the higher oxygen side of the tank in these trials
21
21
4 mg O l2 trial, spending slightly less than 50% of the time in the higher-oxygen side of the tank, on average (Fig. 3B). Similar to the pattern observed in mullet trials, the response of croaker to the hypoxia levels tested was graded at oxygen levels below 4 mg
21
O l2 .
Pinfish showed a significant preference for the higher oxygen concentration in both 4
21
vs. 1 and 2 vs. 1 mg O l2 trials (Fig. 3C). Pinfish spent 88% of the time in higher
21
oxygen in 4 vs. 1 mg O l2 trials and 91% of the time in higher oxygen in 2 vs. 1 mg
21 21
O l2 trials. In 6 vs. 4 mg O l2 trials, pinfish again spent significantly more of their
21
time (67%) in higher oxygen. However, in trials of 4 vs. 2 mg O l2 , pinfish showed no statistically significant preference for higher oxygen, and there was high variance in response (Fig. 2C). The pattern of response observed for pinfish differed from that observed in croaker and mullet trials. Pinfish response initially suggested an avoidance
21
threshold of 1 mg O l2 (as fish avoided this concentration but did not prefer higher
21
oxygen in 4 vs. 2 mg O l2 trials). However, because pinfish again preferred higher
21
oxygen in 6 vs. 4 mg O l2 trials, their response pattern exhibited elements of both a graded and an avoidance threshold response.
Spot responded in choice trials similarly to pinfish (Fig. 3D). Spot showed preferences
21
for the higher oxygen concentration in 4 vs. 1, 2 vs. 1, and 6 vs. 4 mg O l2 trials. In
21
both 4 vs. 1 and 2 vs. 1 mg O l2 trials, spot spent an average of over 90% of their time in the higher oxygen concentration. Spot also spent a significantly higher mean percent
21
of their time in the higher oxygen concentration (80%) in the 6 vs. 4 mg O l2 trials. Like pinfish, spot showed no preference for the higher oxygen concentration in 4 vs. 2
21
mg O l2 trials (Fig. 3D).
Because spot exhibited the same unusual preference pattern as pinfish, showing no
21
significant preference in 4 vs. 2 mg O l2 trials but significant preferences in 4 vs. 1
21
and 6 vs. 4 mg O l2 trials, we conducted additional trials with the former in the 2–4
21 21
mg O l2 range (4 vs. 3 mg O and 3 vs. 2 mg O l2 2 ) to assess response in even closer intervals of oxygen concentration. Spot did not show a significant preference for the higher oxygen concentration in either of these intermediate oxygen concentrations; the mean percent of time in the higher oxygen concentration ranged from 26 to 74% (Fig. 3D). These data confirm that spot response, like that observed for pinfish, has elements of both a graded and an avoidance threshold response.
Menhaden strongly avoided the lower oxygen concentration in 4 vs. 1 and 2 vs. 1 mg
21 21
O l2 trials (Fig. 3E). In trials of 6 vs. 4 mg O l2 , menhaden on average spent more than 60% of their time on the higher oxygen side of the tank, but there was high variation among replicates and thus this result was not significantly different from 50% (Fig. 3E).
Brown shrimp strongly avoided the lower oxygen concentration in both the 4 vs. 1 mg
21 21
O l2 and 2 vs. 1 mg 0 l2 trials (Fig. 3E). Like menhaden, brown shrimp in the 6 vs.
21
4 mg O l2 trials spent more time in the higher oxygen concentration (64.9%), but this trend was not statistically significant (Fig. 3F). While the responses observed in Atlantic
21
menhaden and brown shrimp trials suggested an avoidance threshold of 1 mg O l2 ,
21
Mummichogs exhibited a markedly different response pattern than all of the other species we examined. Regardless of the alternative oxygen concentration available (2, 4,
21
or 6 mg O l2 ), mummichogs were the only species tested that did not avoid 1 mg
21
O l2 (Fig. 3G). Qualitatively, mummichogs appeared to simply spend proportionally more time performing aquatic surface respiration when in lower oxygen concentrations. Variation among replicates in the proportion of time spent in the higher oxygen concentration differed substantially among treatments. Variance about the mean percent of time spent in the higher oxygen concentration was relatively low, regardless of the
21
species, in trials that included 1 mg O l2 as a choice. Variances were often higher when the trials involved less extreme levels of hypoxia, such as in the spot and pinfish
21
trials between 4 vs. 2 mg O l2 .
3.2. Ventilation rate experiments
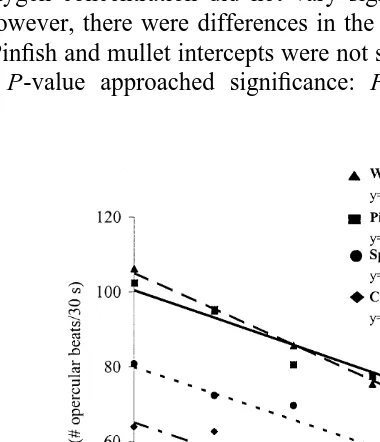
All species showed a significant increase in ventilation rate with declining oxygen concentration (Fig. 4). Dissolved oxygen concentration explained over 93% of the variation in ventilation rate for all species tested. The slopes of ventilation rate as a function of oxygen concentration did not vary significantly among species (F52.25,
P50.122). However, there were differences in the intercepts of these lines (F540.39,
P,0.0001). Pinfish and mullet intercepts were not statistically different from each other (although the P-value approached significance: F54.29, P50.07), but were
21
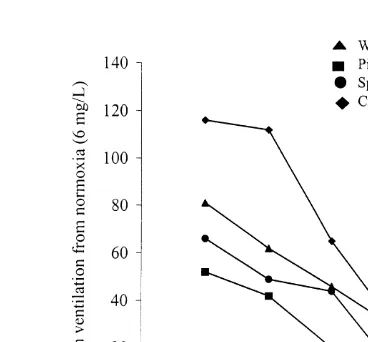
Fig. 5. Percent increases in ventilation rate from normoxia (6 mg O l2 ) for all species tested.
nificantly higher than those of spot and croaker. The lower intercepts of croaker and spot regression lines were each significantly different from all other species (P,0.0001).
To compare the relative rate of increase in ventilation among species, we calculated the percent increase in ventilation rate at each oxygen concentration relative to that
21
observed at normoxia (6 mg O l2 ) for each species (Fig. 5). Croaker showed the highest percent increase at all oxygen concentrations, increasing more than 100% at both
21
1 and 2 mg O l2 . Pinfish generally had the lowest percent increases in ventilation rate,
21
with rates increasing only about 50% at 1 mg O l2 . However, the change in percent increase is a reflection of the normoxic ventilation rate; the absolute rate of increase was the same for all species.
3.3. Aquatic surface respiration trials
In aquatic surface respiration (ASR) trials, mummichogs spent a significantly higher percent of the time performing aquatic surface respiration in hypoxic treatments (1 mg
21 21
O l ) than in normoxic (6 mg O l ) trials at (P50.016). Over seven 30-min
2 2
replicates, mean time spent in ASR in normoxic treatments was 5.02 min, whereas at 1
21
mg O l2 fish spent an average of 17.9 min performing ASR.
4. Discussion
All of the estuarine organisms tested in this study could detect and behaviorally respond to low levels of hypoxia. Spot, pinfish, croaker, mullet, menhaden, and shrimp responded to low dissolved oxygen by moving away from the hypoxic area; mummich-ogs responded by performing aquatic surface respiration. With the exception of
21
21 21
between 1 and 2 mg O l2 , as well as between 1 and 4 mg O l2 . It should be noted, however, that organisms were removed directly from normoxic holding tanks and placed into hypoxic conditions. Therefore, the threshold values determined in this study might differ if animals were allowed to acclimate to decreasing oxygen as might occur in nature.
Past field studies have suggested that there is a general migration out of areas of low dissolved oxygen, but that there are species-specific differences in tolerance (Magnuson et al., 1985; Marotz et al., 1990; Pihl et al., 1991, 1992; Howell and Simpson, 1994; Petersen and Pihl, 1995; Thiel et al., 1995). Therefore, we expected that there would be marked species-specific differences in avoidance behaviors. Most species responded
21 21
similarly in choice trials between 4 vs. 1 mg O l2 and 2 vs. 1 mg O l2 . Nonetheless,
21
there were different responses in trials with choices above 1 mg O l2 (4 vs. 2 and 6 vs.
21
4 mg O l2 ). While we expected that many species would exhibit an avoidance threshold response to hypoxia, choice trial results suggest that the response to hypoxia by certain estuarine species is often graded at dissolved oxygen levels greater than 1 mg
21
O l2 .
Croaker and mullet exhibited a clear graded response to hypoxia. Both species
21 21
avoided 1 mg l O in 4 vs. 1 and 2 vs. 1 mg O l2 2 trials; furthermore, these species
21 21 21
avoided 2 mg O l2 in 4 vs. 2 mg O l2 trials. Their avoidance of 2 mg O l2 in the 4
21
vs. 2 mg O l2 choice trials suggests that croaker and mullet are more sensitive to
21
moderate hypoxia than spot and pinfish as the latter species did not avoid 2 mg O l2 in
21
the 4 vs. 2 mg O l2 trials.
Results from the spot and pinfish choice trials suggest a different pattern of response to hypoxia which is more difficult to explain. While both species detected and avoided 1
21 21
mg O l2 in 4 vs. 1 and 2 vs. 1 mg O l2 trials, neither preferred the higher oxygen
21
concentration in trials of 4 vs. 2 mg O l2 . Initially, these results suggested an avoidance threshold response. However, unlike any of the other species, spot and pinfish
21
did prefer higher oxygen in 6 vs. 4 mg O l2 trials. Preference for higher oxygen in these trials suggests that these species also have a graded response to hypoxia, although it is of a different pattern than the response observed for croaker and mullet.
It is difficult to conclusively assess patterns of response observed in shrimp and
21
menhaden trials. Both species avoided low oxygen in 4 vs. 1 and 2 vs. 1 mg O l2 21
trials, and neither preferred higher oxygen in 6 vs. 4 mg O l2 trials. However, trials
21
with these species were not conducted at 4 vs. 2 mg O l2 , so it is impossible to determine the oxygen concentration at which avoidance begins and whether these species exhibit a graded or threshold response.
The lack of preference for the higher oxygen concentration by spot and pinfish in 4 vs.
21 21
2 mg O l2 trials is a surprising result, as concentrations around 2 mg O l2 are often cited in field studies as the level at which general species abundance drastically drops or emigration begins (Beitinger and Petit, 1984; Marotz et al., 1990; Pihl et al., 1991; Lisa Eby, unpublished data). While it is possible that spot and pinfish cannot detect
21
differences in oxygen concentration between 4 and 2 mg O l2 , it seems more plausible that the species-specific physiological costs of remaining at the lower level may not be as severe for these species as they are for croaker and mullet.
21 21
confirm that spot do not avoid hypoxia within this zone. Previous studies suggest that spot are tolerant of concentrations in this range. For example, Pihl et al. (1991)
21
documented spot survival in the laboratory at 1.8–2.7 mg O l2 for at least 96 h. In addition, field data suggest that there may be energetic benefits to tolerance of less extreme hypoxia. In the York River, which is affected by periodic hypoxic events on a small spatial scale, spot actually move into hypoxic zones to feed opportunistically on large polychaetes, anemones, and the siphons of bivalves that emerge from sediments during low dissolved oxygen (Pihl et al., 1992). This opportunistic exploitation of hypoxic zones was also documented in a stratified lake by Rahel and Nutzman (1994), who showed that mudminnows actively venture into hypoxic bottom waters to feed on
Chaoborus.
Mummichogs were the only species that did not exhibit avoidance behavior in any trials. During choice experiments, mummichogs made attempts to perform aquatic surface respiration (ASR), but access to the surface was prevented by the plastic covering. In ASR trials, mummichogs spent a significantly higher amount of time performing ASR in hypoxic conditions than in control normoxia. The use of ASR by fishes inhabiting hypoxic habitats is well documented (Lewis, 1970; Chapman et al., 1976; Kramer and Mehegan, 1981; Kramer and McClure, 1982), including accounts of mummichogs surviving overnight in anoxic water by performing ASR (Abraham, 1985). The ability of mummichogs to efficiently extract oxygen from the surface layer might account for their lack of avoidance of low oxygen water in choice trials. Greaney and Powers (1978) suggested that Fundulus heteroclitus may have the ability to lower ATP concentration in erythrocytes in order to increase the oxygen binding affinity of hemoglobin, and therefore more efficiently extract oxygen from hypoxic waters. ASR may not be employed strictly as an emergency response (Kramer, 1987). In fact, the ability to perform ASR may be an avenue of increased fitness as it allows normal activity and growth, and ultimately survival, at potentially lethal levels of hypoxia (Weber and Kramer, 1983). In this study, mummichogs performed ASR 17% of the time even in normoxic conditions.
Attempts at aquatic surface respiration in choice trials were not observed for any of the other species tested. However, this should not be construed as evidence that these species do not perform ASR in the field. The experimental set-up employed in choice trials was not optimal for testing ASR as there was no vertical dissolved oxygen gradient and chambers were covered with a layer of plastic. Separate ASR experiments were only performed for mummichogs.
Kramer (1987) categorized ventilatory response as the main facet of fish activity affected by dissolved oxygen concentrations and suggested that increased energy allocation to ventilation may be the reason growth rates of fishes in hypoxic conditions are often reduced. All species had different ventilation rates in normoxic conditions (6
21
mg O l2 ) but exhibited a similar rate of increase in ventilation rate in response to hypoxia. However, the magnitude of this increase as a proportion of normoxic ventilation rate varied among species.
on ventilation rates of the species tested in this study. Pihl et al. (1991) reported
21
ventilation rates of spot during severe hypoxia (0.8–1.0 mg O l2 ) which were three times higher than under control conditions. In our study, the percent increases in ventilation rates of spot and pinfish were the most similar and the lowest of all species
21
tested, increasing less than 70% between 6 and 1 mg O l2 dissolved oxygen. Croaker and mullet had the highest percent increases in ventilation of all species. These ventilation data lend additional support to patterns observed in choice trials. In
21 21
choice trials, croaker and mullet avoided 2 mg O l2 (in 2 vs. 4 mg O l2 trials) while spot and pinfish did not. Therefore, croaker and mullet either detect this level of hypoxia more readily or are less tolerant of hypoxia than spot and pinfish. Pihl et al. (1991) suggested that croaker are more sensitive than spot and hogchoker (Trinectes
maculatus), mantis shrimp (Squilla empusa), and blue crab (Callinectes sapidus) as they
were absent in catches throughout three periods of summer hypoxia (DO51.4, 0, and
21
0.9 mg O l2 ). Earlier studies suggested that an increase in ventilation during hypoxia may explain the mechanisms behind patterns of hypoxia avoidance, and further proposed that fish do not detect and avoid hypoxic water but respond instead to the respiratory distress that it induces (Jones, 1952). In this study, croaker and mullet had the highest percent increases in ventilation rate; it appears that hypoxia causes greater respiratory distress in these species, which may explain why they start avoiding hypoxic zones at
21
relatively higher concentrations (2 mg l ) than spot and pinfish. Data from these species, then, suggest that fish may be responding either directly to hypoxic water or respiratory distress; therefore, these patterns observed do not allow rejection of the previously mentioned conclusion of Jones (1952).
This study provides evidence that hypoxia does have significant effects on the behavior of all estuarine species tested, and provides valuable information on the patterns of these responses. However, it is difficult to draw decisive conclusions about the relative sensitivity of the species tested. Responses to hypoxia were strikingly similar among species.
4.1. Implications for management
The ability of estuarine organisms to detect and avoid hypoxia is not only the cornerstone for assessing other consequences of hypoxia including its effect on growth and feeding, reproduction, and predation and competition, but is also important information for future management plans. These data supply necessary information to assess the capability of mobile estuarine organisms to adjust their spatial distribution in response to water quality. In addition, they help answer the broader question of how fish populations and estuarine communities are influenced by environmental perturbations. Both of these components are crucial for subsequent water quality models capable of predicting changes in fish populations as a direct result of land uses, nutrient loading, and hydrodynamics.
limiting factors, including oxygen availability, that influence habitat selection (Peters and Cross, 1992). The results of this study provide a basis for understanding the link between dissolved oxygen and fish distributions. Understanding these links and translating them into effective policy is crucial for present and future attempts to protect and enhance our coastal and estuarine environments.
Acknowledgements
The authors express thanks to the following for their thoughtful comments and assistance: Tim Targett, Denise Breitburg, David Eggleston, Lundie Spence, Walter Clark, David Dickey, Larry Crowder, Lisa Eby, William Hettler, John Burke, Marc Fonseca, Don Hoss, Chris Taylor, Trevor Yip-Hoi, Bill Miller, Janet Howard, Bryan Smith, and Steve Nixon. The authors also express gratitude to the National Sea Grant College Program for supporting this work and the National Marine Fisheries Service Beaufort Laboratory for providing lab space and equipment during the summers of 1997 and 1998. This work was supported by Grant NA86RG0036, project RIMRD-42, from the National Sea Grant College Program, National Oceanic and Atmospheric Adminis-tration to the North Carolina Sea Grant Program and by the North Carolina Agricultural Experiment Station. The views expressed herein are those of the authors and do not necessarily reflect the views of NOAA or any of its sub-agencies. [SS]
References
Abraham, B.J., 1985. Species profiles: life histories and environmental requirements Mummichog and Striped Killifish. US Fish Wild. Serv. Biol. Rep. 82 (11.40), 23.
American Rivers Foundation, 1997. Report On the 20 Most Threatened American Rivers, American Rivers Foundation, New York.
Atkinson, D.E., 1968. The energy charge of the adenylate pool as a regulatory parameter: interaction with feedback modifiers. Biochemistry 7, 4030–4034.
Beitinger, T.L., Petit, M.J., 1984. Comparison of low oxygen avoidance in a bimodal breather, Erpetoichthys calabaricus and an obligate breather, Percina caprodes. Environ. Biol. Fish. 11, 235–240.
Bejda, A.J., Phelan, B.A., Studholme, A.L., 1992. The effect of dissolved oxygen on growth of young-of-the-year winter flounder, Pseudopleuronectes americanus. Environ. Biol. Fish. 34, 321–327.
Bowen, J.D., 1997. Evaluating the uncertainty in water quality predictions: a case study. In: 5th Int. Conf. on Estuarine and Coastal Modeling, Alexandria, VA.
Breitburg, D.L., Steinberg, N., DuBeau, S., Cooksey, C., Houde, E.D., 1994. Effects of low dissolved oxygen on predation on estuarine fish larvae. Mar. Ecol. Prog. Ser. 104, 235–246.
Breitburg, D.L., 1992. Episodic hypoxia in Chesapeake Bay: Interacting effects of recruitment, behavior, and physical disturbance. Ecol. Monogr. 62 (4), 525–546.
Burton, D.T., Richardson, L.B., Moore, C.J., 1980. Effect of oxygen reduction rate and constant low dissolved oxygen concentrations on two estuarine fish. Trans. Am. Fish. Soc. 109, 552–557.
Cameron, J.N., 1970. The influence of environmental variables on the hematology of pinfish (Lagodon rhomboides) and striped mullet (Mugil cephalus). Comp. Biochem. Physiol. 32, 175–192.
Cech, Jr. J.J., Mitchell, S.J., Wragg, T.E., 1984. Comparative growth of juvenile white sturgeon and striped bass: effects of temperature and hypoxia. Estuaries 7 (1), 12–18.
Chapman, A.G., Miller, A., Atkinson, D.E., 1976. Role of the adenylate deaminase reaction in regulation of adenine nucleotide metabolism in Ehrlich ascites tumor cells. Cancer Res. 36, 1144–1150.
Coutant, C.C., 1985. Striped bass, temperature, and dissolved oxygen: a speculative hypothesis for environmental risk. Trans. Am. Fish. Soc. 114, 31–61.
Deubler, Jr. E.F., Posner, G.S., 1963. Response of postlarval flounders to water of low oxygen concentrations. Copeia 1963, 312–317.
Di Michele, L., Taylor, M.H., 1980. The environmental control of hatching in Fundulus heteroclitus: development and physiology. J. Exp. Zool. 217 (1), 73–80.
Dorfman, D., Westman, J., 1970. Responses of some anadromous fishes to varied oxygen concentrations and increased temperatures, New Jersey Water Resources Research Institute, The State University of Rutgers, New Brunswick, NJ, Project B-012-NI.
Fuss, Jr. C.M., Ogren, L.H., 1966. Factors affecting activity and burrowing habits of pink shrimp, Penaeus duorarum Burkenroad. Biol Bull. (Woods Hole) 130, 179–191.
Greaney, G.S., Powers, D.H., 1978. Allosteric modifiers of fish hemoglobin: in vitro and in vivo studies of the effect of ambient oxygen and pH on erythrocyte ATP concentrations. J. Exp. Zool. 203, 339–350. Harned, D.A., Davenport, M.S., 1990. Water quality trends and basin activities and characteristics for the
Albemarle-Pamlico estuarine system, NC and VA, USGS, Raleigh, NC, Report 90-398.
Howell, P., Simpson, D., 1994. Abundance of marine resources in relation to dissolved oxygen in Long Island Sound. Estuaries 17 (2), 394–402.
Hughes, D.A., 1968. Factors controlling emergence of pink shrimp (Penaeus duorarum) from the substrate. Biol. Bull. 134, 48–59.
Jones, J.R.E., 1952. The reaction of fish to water of low oxygen concentration. J. Exp. Biol. 29, 403–415. Kramer, D.L., 1987. Dissolved oxygen and fish behavior. Environ. Biol. Fish 18 (2), 81–92.
Kramer, D.L., McClure, M., 1982. Aquatic surface respiration, a widespread adaptation to hypoxia in tropical freshwater fishes. Environ. Biol. Fish. 7, 47–55.
Kramer, D.L., Mehegan, J.P., 1981. Aquatic surface respiration, an adaptive response to hypoxia in the guppy, Poecilia reticulata (Pisces, Poeciliidae). Environ. Biol. Fish. 6, 299–313.
Lallier, F., Boitel, F., Truchot, J.P., 1987. The effect of ambient oxygen and temperature on haemolymph
L-lactate and urate concentrations in the shore crab Carcinus maenas. Comp. Biochem. Physiol. 86A (2), 255–260.
Lassuy, D.R., 1983. Species profiles: life histories and environmental requirements of coastal fishes and invertebrates — Atlantic croaker. US Fish. Wildl. Div. Biol. Serv TR EL 82–84, 15, FWS / OBS-82 / 11.14, US Army Corps of Engineers.
Lewis, Jr. W.M., 1970. Morphological adaptations of cyprinodontoids for inhabiting oxygen deficient waters. Copeia 1970, 319–326.
Llanso, R.J., 1992. Effects of hypoxia on estuarine benthos; the lower Rappahannock river (Chesapeake Bay), a case study. Estuar. Coast. Shelf Sci. 35, 491–515.
Magnuson, J.L., Beckel, A., Mills, K., Brandt, S., 1985. Surviving winter hypoxia – behavioral adaptations of fishes in a northern Wisconsin winterkill lake. Environ. Biol. Fish. 14 (4), 241–250.
Marotz, B.L., Herke, W.H., Roger, B.D., 1990. Movement of gulf menhaden through three marshland routes in southwestern Louisiana. N. Am. J. Fish Man 10 (4), 408–417.
Middaugh, D.P., Scott, G.I., Dean, J.M., 1981. Reproductive behavior of the Atlantic silverside, Menidia menidia. Environ. Biol. Fishes 6, 269–276.
Oliver, J.D., Van Den Avyle, M.J., Bozeman, E.L., 1989. Species profiles: life histories and environmental requirements of coastal fishes and invertebrates-bluefish. US Fish. Wildl. Div. Biol. Serv. Biol. Rep 82 (11.96), 4–15, US Army Corps of Engineers, TR EL 82.
Paerl, H.W., Pinckney, J.L., Fear, J.M., Peierls, B.L., 1998. Ecosystem responses to internal and watershed organic matter loading: consequences for hypoxia in the eutrophying Neuse River Estuary, North Carolina, USA. Mar. Ecol. Prog. Ser. 166, 17–25.
Peters, D.S., Cross, F.A., 1996. Relating habitat stress to fish productivity: Problems and approaches. The Northeast Shelf Ecosystem: assessment, sustainability, and management. Blackwell Science, Cambridge, pp. 397–404.
Pihl, L.S., Baden, P., Diaz, R.J., 1991. Effects of periodic hypoxia on distribution of demersal fish and crustaceans. Mar. Biol. 108, 349–360.
Pihl, L., Baden, S.P., Diaz, R.J., Schaffher, L.C., 1992. Hypoxia-induced structural changes in the diet of bottom-feeding fish and crustacea. Mar. Biol. 112, 349–361.
Rahel, F.J., Nutzman, J.W., 1994. Foraging in a lethal environment: fish predation in hypoxic waters of a stratified lake. Ecology 75 (5), 1246–1253.
Robinette, H.R., 1983. Species profiles: life histories and environmental requirements of coastal fishes and invertebrates — Bay anchovy and striped anchovy. US Fish. Wildl. Div. Biol. Serv TR EL 82–84, 15, FWS / OBS 82 / 11.14, US Army Corps of Engineers.
Rutledge, C.J., Beitinger, T.L., 1989. The effects of dissolved oxygen and aquatic surface respiration on the critical thermal maxima of three intermittent-stream fishes. Environ. Biol. Fish. 24 (2), 137–143. Sokal, R.R., Rohlf, F.J., 1969. Biometry: the Principles and Practice of Statistics in Biological Research,
Freeman, San Francisco, CA.
Steel, Robert G.D., Torrie, James H., Dickey, David A., 1997. Principles and procedures of statistics: a biometrical approach. McGraw-Hill, New York, NY.
Steffensen, J.F., Lomholt, J.P., Johansen, K., 1982. Gill ventilation and oxygen extraction during graded hypoxia in two ecologically distinct species of flatfish, the flounder (Platichthys flesus) and the plaice (Pleuronectes platessa). Environ. Biol. Fish. 7 (2), 157–163.
Stott, B., Buckley, B.R., 1979. Avoidance experiments with homing shoals of minnows, Phoxinus phoxinus, in a laboratory stream channel. J. Fish. Biol. 14, 135–146.
Stott, B., Cross, D.G., 1973. The reactions of roach (Rutilus nitilus) to changes in the concentration of dissolved oxygen and free carbon dioxide in a laboratory channel. Water Res. 7, 793–805.
Suthers, I.M., Gee, J.H., 1986. Role of dissolved oxygen in limiting diel spring and summer distribution of yellow perch in a prairie marsh. Can. J. Fish Aquat. Sci. 43 (8), 1562–1570.
Sylvester, J.R., Nash, C.E., Emberson, C.R., 1975. Salinity and oxygen tolerances of eggs and larvae of Hawaiian striped mullet, Mugil cephalus L. J. Fish. Biol. 7, 621–629.
Tallqvist, M., Sandberg-Kilpi, E., Bonsdorff, E., 1999. Juvenile flounder Platichthys flesus, under hypoxia: effects on tolerance, ventilation rate and predation efficiency. J. Exp. Mar. Biol. Ecol. 242 (1), 75–93. Thiel, R., Sepulveda, A., Kafemann, R., Nellen, W., 1995. Environmental factors as forces structuring the fish
community of the Elbe Estuary. J. Fish Biol. 46, 47–69.
Vetter, R.D., Hodson, R.E., 1982. Use of adenylate concentrations and adenylate energy charge as indicators of hypoxic stress in estuarine fish. Can. J. Fish. Aquat. Sci. 39 (4), 535–541.