GEOPAN AT@S: A BROKERING BASED GATEWAY TO GEOREFERENCED
HISTORICAL MAPS FOR RISK ANALYSIS
M. Previtali
Politecnico di Milano, Department of Architecture, Built Environment and Construction Engineering, Via Ponzio 31, 20133 Milano, Italy – [email protected]
Commission VI, WG VI/4
KEY WORDS: Open data, brokering, historical maps, land changes, interoperability, web services
ABSTRACT:
Importance of ancient and historical maps is nowadays recognized in many applications (e.g., urban planning, landscape valorisation and preservation, land changes identification, etc.). In the last years a great effort has been done by different institutions, such as Geographical Institutes, Public Administrations, and collaborative communities, for digitizing and publishing online collections of historical maps. In spite of this variety and availability of data, information overload makes difficult their discovery and management: without knowing the specific repository where the data are stored, it is difficult to find the information required. In addition, problems of interconnection between different data sources and their restricted interoperability may arise. This paper describe a new brokering based gateway developed to assure interoperability between data, in particular georeferenced historical maps and geographic data, gathered from different data providers, with various features and referring to different historical periods. The developed approach is exemplified by a new application named GeoPAN Atl@s that is aimed at linking in Northern Italy area land changes with risk analysis (local seismicity amplification and flooding risk) by using multi-temporal data sources and historic maps.
1. INTRODUCTION
Nowadays, importance of ancient and historical maps is not only connected to their intrinsic historic and artistic value but also as a source of information to derive the former organization of the territory (urbanized areas, field cultivations, etc.) as well as their evolution over time. Since territory and urban areas are organism in continuous evolution, to understand on-going dynamics, the study of the current state is not sufficient for their protection, conservation and future planning. In order to understand the evolution over time of these complex structures historical maps are an important tool and can be efficiently used as a reference for urban planning and territorial management as well as urban and landscape preservation and land changes identification.
For this reason in the last years projects for digitizing and publish on the web historical maps significantly increased. Those project were mainly carried out by National Geographical Institutes (e.g., IGN published the “Carte d'État-Major”), Public Administrations (e.g, the Municipality of Zaragoza - http://idezar.zaragoza.es/visorHistorico/) and National Archives (e.g., Divenire project by the National archive of Milan - http://www.asmilano.it/Divenire/home.htm). Also some collaborative communities were established to gather crowdsourced contributions. Due to this effort several web portal are nowadays available to access and visualize historical maps. In addition, many project for georeferencing maps and publishing them online were carried out in the last years. However, few catalogue services exists and in spite of a large variety and availability of data, information fragmentation makes the discovery of dataset a challenging task: without knowing the specific repository where the data are stored, it is difficult to find the information required. In addition, problems can also arise due to restricted interoperability between different data sources. Indeed, different providers may use different protocols and services both for data and metadata, preventing this way an easy integration between data. For example either
WFS service or OpenSearch (an Atom-format with link to the download) are frequently used for downloading datasets (Technical Guidance for the implementation of INSPIRE Download Services). However, integration of those two services in not a trivial task.
Furthermore, current web platform and services dealing with historical maps generally allows for a simple visualization of the maps and no further knowledge is extracted from them. On the other hand Historical GIS (HGIS) proved to be one of the most promising frameworks, which can provide innovative tools and methodological approaches in this field, since they allow a complete and exhaustive framework of the transformation occurred. Examples of proving this are: for the city of Lyon (France) (Gauthiez et al., 2009, 2014), the GBHGIS realized by the University of Portsmouth on the whole Great Britain territory (Gregory et al., 2002) and the GIS on historic estate atlases in the Netherlands (Heere, 2006). In Italy interesting HGIS concern medieval data related to Southern Italy (Carrion et al., 2013), the city of Rome (Baiocchi et al., 2005; Lelo et al., 2005; Micalizzi et al., 2012), the city of Como (Brovelli et al., 2012) and the town of Cumiana (Torino) (Farruggia, 2009; Panzeri, 2008), for example.
In this paper a new historical maps gateway is presented to access historical maps served by different data provides . This gateway relies on the approach developed in the European project ENERGIC OD (Competitiveness and Innovation Framework Programme by the European Community – CIP – GA n°620400). To provide a single point of access to heterogeneous data sources the developed approach uses a virtual node, a gateway based on a broker approach (Nativi et al., 2011), where users can seamlessly discover and access potentially unlimited datasets. In particular, this gateway is exemplified through the description of a case study, the development of a new application named GeoPAN Atl@s. This application is aimed at linking in Northern Italy area land changes with risk analysis (local seismicity amplification, flooding risk) by using multi-temporal data sources and historic
maps. To achieve this goal the application GeoPAN Atl@s is using a set of georeferenced maps coming from different providers (National Archives, Private Archives and Private collections) giving a single point of access to them.
This paper is organized as follows. Section 2 describes the general concept of the developed virtual gateway, and its application in order to facilitate the integration of ancient cadastres and historical maps coming from different sources. In particular, Section 3 presents the virtual node, based on a brokering approach, allowing to connect different data sources and access them in a seamlessly way. This integration is exemplified through the description of an application (GeoPAN Atl@s APP) referred to historical datasets of the Lombardy Region (Section 4). GeoPAN Atl@s APP is an application aimed at providing to professional users (e.g., geologists, architects, urban planners) a set of datasets available for territorial and landscape management. In particular, GeoPAN Atl@s provides both modern cartographic layers coming from regional/local Spatial Data Infrastructures (SDIs) and historical maps in order to track territorial changes by relating historical maps to current maps. Section 5 presents some conclusions.
2. HISTORICAL MAPS GATEWAY – GENERAL CONCEPT
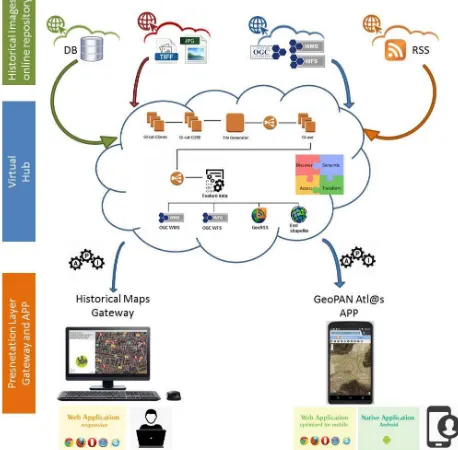
The architecture of the developed gateway for historical maps is presented in Figure 1. In particular, the architecture of the gateway can be considered as a three-tier one: (i) a data/resource layer represented by existing data sources and repository of historical maps, (ii) a virtual layer, named Virtual Hub, allowing the discovery and the access to the different resources contained in the first tier and exposing a set of APIs allowing to build application on the top of this virtual node and (iii) a presentation layer represented by two products, a web application for pc and a mobile app, allowing to discover and browse historical maps.
Figure 1. Architecture of the historical maps gateway
As previously anticipated the main aim of the gateway is to provide a seamlessly discover and access to potentially unlimited datasets. In particular this means that:
i. the data sources connected are not duplicated into a new infrastructure but are accessed in their original repository. This aspect allows to have a distributed data/resource layer, reducing data volume issues. Indeed, since each data is accessed to its original source data volume issues are reduced with respect to a solution based on data harvesting. In addition, this type of solution allow to respect IPR constraints.
ii. the solution can discover datasets by using a set of specific constraints (e.g., based on semantic keyword, spatial and temporal constraints, etc.), and
iii. the system is able to face the Big Data issue of data variety allowing to access datasets provided with different data models and standards. Indeed, one of the great advantages of this solution is the fact that it is based on a brokered approach, this means that no common models (in terms of protocols and publication standard) are necessary, and each dataset connected to the broker can adopt or maintain their preferred interfaces, metadata and data models. A specific component (the Virtual Hub) is in charge of accessing the participant systems, providing all the required mediation and harmonization functionalities.
One of the main features of this mediation layer is the availability of both REST and web APIs allowing web programming and the creation of web/mobile application on the top of the Virtual Hub. To prove this functionality two products, a web application for pc and a mobile app, were developed representing the presentation layer of Figure 1. In particular, these two products are connecting different historical map data sources to track the evolution of the Lombardy territory (Northern Italy) focusing in particular on riverbed changes. Indeed, areas that were previously crossed by a riverbed are more vulnerable under different point of view (both hydrological and seismic). The possibility to combine multiple dataset is provided by the “machine-to-machine” interface (APIs) that allows to interact with the historical map gateway.
3. VIRTUAL HUB LAYER
To link (discover and access) different data sources of historical maps the developed gateway relies on the approach developed in the European project ENERGIC OD. In particular, within the project a novel approach based on the Virtual Hub concept was developed to overcame the heterogeneity of data sources. The term virtual hub is adopted referring to the hub-and-spoke distribution paradigm. An ENERGIC OD Virtual Hub (VH) is defined as a virtual node where users can seamlessly access potentially unlimited datasets by brokering heterogeneous geospatial data sources (ENERGIC-OD Consortium, 2015). In particular, these statements underline some key aspects of the Virtual Hub concept:
• An ENERGIC OD VH accesses datasets in a seamlessly way heterogeneous geospatial data sources: the heterogeneity in data formats, standards and protocols is solved by the VH, allowing a higher interoperability between services and datasets; • An ENERGIC OD VH is based on a brokering
architecture: a software architecture adopting the (message) broker pattern is usually referred as a hub-and-spoke architecture;
• An ENERGIC OD VH is aimed to connect heterogeneous geospatial data sources: different geospatial data sources can be connected by using a VH.
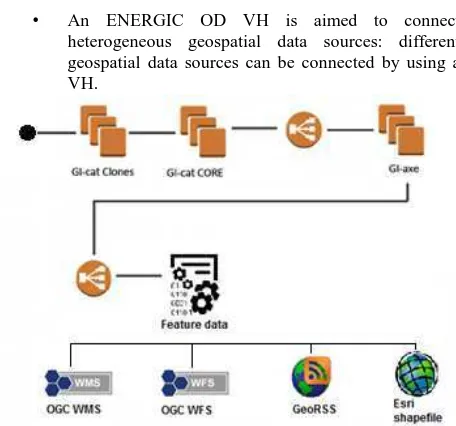
Figure 2. Architecture of the Virtual Hub
In particular, an ENERGIC OD VH is a solution able to reduce the interoperability problems between data providers and applications. It requires to extend the Service Oriented Architecture (SOA) archetype by introducing a new component that interconnects the different service protocols and standards, mediating their models and interface specifications. Specifically, ENERGIC OD VH, relies upon a brokering approach (Nativi et al. 2013). A specific components (the broker) is in charge of accessing different data sources, providing all the required mediation and harmonization functionalities. In particular, the main components (Figure 2) of the Virtual Hub are:
• GI-cat: allows to access a multiplicity of catalogue services, as well as inventory and access services to discover heterogeneous resources. Specific components implement mediation services for interfacing heterogeneous service providers which expose multiple standard specifications; they are called Accessors. These mediating components map the heterogeneous providers metadata models into a uniform data model which implements ISO 19115, based on official ISO 19139 schemas and its extensions (check out more information about the internal GI-cat format). Accessors also implement the query protocol mapping; they translate the query requests expressed according to the interface protocols exposed by GI-cat, into the multiple query dialects spoken by the resource service providers. Currently, a number of well-accepted catalog and inventory services are supported, including several OGC Web Services (e.g. WCS, WMS), THREDDS Data Server, SeaDataNet Common Data Index, and GBIF.
• GI-axe: implements Access Broker functionalities, providing transparent access to normalized data, through the invocation of an appropriate sequence of data processing services, including sub-setting (i.e. trimming, slicing); format conversion; CRS transformation; data interpolation. Files can be accessed in their original format or can be converted into different services like OGC Web Services (e.g. WCS, WMS, WFS), GeoRSS and Esri schapefiles.
By using a brokering approach the only interoperability agreement is the availability of documentation describing the published interfaces, metadata and data models. No (major) re-engineering of existing systems is required for connecting different services or other data sources. The brokered approach allows communities-of-practice free from defining their own specifications, and mediating between different specifications. Obviously brokering is not magic, the complexity of interoperability is still there, but it is simply shifted from data/product users and providers towards the brokers. Data users and providers are set free of interoperability – i.e. they do not have to make their clients and server compliant with specifications anymore – but new components, the brokers, are in charge of handling all the complexity. This shift of complexity from clients/servers to brokers has two main advantages: (a) it implements the general engineering pattern called “separation-of-concerns”: where there is a specific functionality (interoperability), there should be a specific responsible (broker), (b) a third tier between clients and servers can host added-value services (e.g. semantics, data transformations). A broker is a mediator (Figure 1) which implements some services (i.e. discover, access, distribution, added value, etc.) to facilitate the interconnection between client and server components in a Client-Server architecture.
4. GEOPAN ATL@S
The possibility to reach different data sources in an homogeneous way is exemplified by a new application, named GeoPAN Atl@s, developed in the context of ENERGIC OD project.
Integration of historical maps with modern cartographic layers can be fruitfully used for a wide range of proposes: landscape change analysis, urban development studies, archaeological research, territorial planning, etc. In particular, the purpose of GeoPAN Atl@s application is to combine historical maps in Lombardy Region (Italy) with local cartography provided by local authorities (e.g., municipalities, regions, etc.) for urban planning and risk mitigation purposes. Indeed, historical maps can be used to track land and territorial changes (e.g., changes in riverbed) during the centuries, which are not generally reported by modern maps. However, such information can be helpful in land management. Indeed, these area are not only more prone to be flooded but also they are characterized by a larger seismic risk. The looser soil that generally characterize former riverbed areas generate an amplification of an earthquake.
A large set of services and cartographic, including both historical maps and information provided by local SDI (e.g., seismic risk map, landslide map, etc.), are used to link all these different kinds of information. The Virtual Hub layer provide a gateway to access heterogeneous data, both historical and current maps, giving a single point of access to data that are provided by different actors. By using this brokering framework GeoPAN Atl@s provides a new and easy way for consulting historical maps. Indeed, GeoPAN Atla@ represents a single point of access to historical maps provided by different actors (Public Administration, National Archives, etc.) reducing the searching time among different data sources. The high modernization level of tools and the archive availability through the web should also enlarge the potential public compared to the current one.
4.1 Implementation of GeoPan Atl @s APP
GeoPAN Atl@s deals with multi-temporal and multi-source geospatial data query, visualisation and consultation by using a webGIS geo-portal concept as a gateway to information. During the development of the web application, choices were made by paying attention to the needs and peculiarities of the project: (i) visualization and management of large dimension raster maps, (ii) organization of cartographic resources for easy consultation, and (iii) interface with a visual impact able to attract and to clearly communicate the information requested. Different FOSS (Free/Open Source Software) solutions were considered for both server and client-side implementation. The general architecture of the GeoPAN Atl@s APP is presented in Figure 3. An architecture with the VH gives a simpler access to geographic OD giving a single point of access with a standard protocol and interface
a.
b.
Figure 3. GeoPAN Atl@s architecture (a) and server-client architecture of POLIMI Server (b).
In particular, the Virtual Hub Layer is used to collect and access different services and cartographic information provided by local SDI, historic maps provider and datasets (historical and thematic layers) published by the POLIMI Server (Figure 3b). The server-side software used is GeoServer, which allows publishing spatial data and interactive mapping applications on the web and the visualization of georeferenced historic maps through the use of an OGC standard interfaces. To develop the client-side of the system of the Geopan Atla@s, different FOSS libraries were used. In particular, front-end/interface is developed as a classic HTML/CSS/JS approach. It uses WebGL for hardware-accelerated graphics, and is platform, cross-browser, and tuned for dynamic-data visualization, it also is supported by Android, iOS and Window tablet. In addition, the application is released also as an .apk file, developed by using the Apache Cordova technology (Phonegap), for Android devices. The Geopan Atla@s was developed using a set of Open Libraries (delivered under the Apache 2.0 license, which means they are free for commercial and non-commercial uses):
• Phonegap (Apache Cordova): PhoneGap is a free and open source framework that allows to create mobile manage layers returned from queries performed by users.
• giapi-1.2.9-beta: Virtual HUB javascript library. Required to interface the application with the Virtual HUB. License information can be found at http://api.eurogeoss-broker.eu/
The GeoPan Atl@s web client consists of two parts: a layer menu and a main map panel. The layer menu itself is additionally divided into two parts: the first one, that is devoted to user with basic IT skills, allows users to view and select all the georeferenced historical maps which are ordered into separate trees, while the second one, devoted to users with programming skills, allows direct interaction with the Virtual Hub formulating queries and displaying results.
4.2 GeoPAN Atl@s @s APP in action: Valtellina case study
As previously described GeoPAN Atl@s is aimed at combining historical maps with local current cartography to track land and territorial changes during the centuries. Specifically, the application is focusing on riverbed since those areas are more vulnerable to both hydrological and seismic risk. This paragraph is aimed at presenting two examples of riverbed change tracking by using GeoPAN Atl@s in the Valtellina area (Northern Italy).
The first case study is the area of the so called “Pian di Spagna”. The Pian di Spagna origins are connected with the transportation of sediments by the Adda river around XVI century. In that period the amount of sediment transported by Adda caused the outcrop of a broad plain. The new-born Pian of Spain became thus a vast area of marshes and swamps, wild and malaise, tormented by malaria. A map of XVII century (Figure 4a) shows the path of Adda directing towards the Lake of Mezzola in the surroundings of Ponte del Passo. For another two centuries, the Pian of Spain retained more or less the same aspect (Figure 4b). In 1829 the Austrian government took care of channeling and rectifying the final part of the Adda, with the aim of reclaiming the land, making them more healthy and safe. Indeed, in 1829 Giuseppe Cusi had the task of "drafting a new rectilinear riverbed for the Adda and a canal for the emissary of Lake Mezzola that would allow navigation." So, in the surroundings of Piantedo, the riverbed was diverted to a channel 4.2 km long and 140 wide; the soil was dried and cultivated. Following these works in 1858, the Adda abandoned forever its old riverbed and moved from the emissary of Lake
a.
b.
c.
d.
Figure 4. Adda river in XVII century (a) and in XIX century (b) before rectification works. Current riverbed (light blue) and former riverbed (dark blue) (c) shows good match with areas characterized by higher seismic risk (olive) as highlighted in the
red area (d).
The second case study is the area of the so called “Pian della Selvetta”. The plan of the Selvetta is a vast territory occupying the middle part of Valtellina between St. Pietro Berbenno and the Masino stream in the municipality of Ardenno. This territory has always been a swampy territory due to several meandering, in the plan of Buglio, Forcola and Ardenno, allowing different changes in the riverbeds during to spring and summer flooding (Figure 5a). In 1841 the project, supported by the Austrian government, was to force the Adda to flow into a new traced riverbed from the opposite side with respect to the
old path, not far from the houses of Selvetta and Sirta. For this reason it was necessary to dig a new riverbed more than 4 km long, to make new streams, to fix the outskirts of the nearby streams and the military road giving to the area the current structure (Figure 5b).
a.
b.
Figure 5. Adda river in the area Pian della Selvetta in XIX century (a) and currently (b) with overlaid current riverbed
(light blue) and former riverbed (dark blue).
4.3 GeoPAN Atl@s @s APP extension
The GeoPAN Atl@s APP was firstly designed to focus on Northern Italy area. However, due to the higher flexibility allowed by the brokering approach can be easily extended to include new datasets at international level provided by different institutions. In this paragraph a couple of examples are presented showing the possibility to extend the presented approach to new areas.
The first area analysed concern the Rhine river between Basel and Lauterburg. The Upper Rhine from Basle downstream to the city of Worms was the most diversified part of the Rhine in the past and it is also known as the "furcation zone". Swift stretches extend over a length of about 190 km (Figure 6a). The canalisation of the Upper Rhine, the so-called Tulla rectification, was carried out between 1817 and 1876. Figure 6a shows in red the design of the new riverbed. The river was deepened and channelled between embankments, new sections were dug to straighten out its meandering course, and numerous small islands were removed. As a result, the length of the Rhine in this stretch had been shortened to 81 km (23 percent of total length). Figures 6c and 6d shows the work progress.
a. b. c.
Figure 6. Rhine river in correspondence of Meißenheim: the original riverbed in 1830 (light blue) and the rectification project (red) (a), the riverbed (light blue) in 1852 (b) and 1872 (c).
a b
Figure 7. The Rhine at the estuary of (a) and in correspondence of Rotterdam (b) before the Nieuwe Waterweg dig (left) and currently (right).
A second example represent changes of riverbeds due to anthropogenic pressure. In the middle of the 19th century, Rotterdam was already one of the largest port cities in the world, mainly because of transhipment of goods from Germany to Great Britain. The increase in shipping traffic created a capacity problem since there were too many branches in the river delta, making the port difficult to reach. For this reason in 1863 to improve the connection to the North Sea, the Nieuwe Waterweg ("New Waterway"), a large canal, was designed to connect the Rhine and Meuse rivers to the sea. Construction began on 31 October 1863. Figure 7a and 7b shows the changes induced by these works.
5. CONCLUSIONS
This paper aimed to describe a new brokering based gateway to georeferenced historical maps. Many of the technical issues that have been addressed concerned the interoperability between data, in particular spatial and geographic data, gathered from different data providers, with different features and referred to different historical periods. It is important to highlight how the interaction between various data sources and cartographical products gives more value to the analysis of the territory and the possibility of enlarging the knowledge about it. The capability to integrate different informative layers, both historical and modern, can be an important opportunity of development with application areas still largely unexplored. In a so complex environment, it is evident how the possibility of having an architecture a single point of access ensuring an easy interoperability between different sources becomes crucial. By using this approach data can be produced independently from one another, with the only requirements to be accessible and conform to OGC standards, in order to be discovered, catalogued and used. Moreover, thanks to brokering
architectures, such as the Virtual Hub, their interaction is a problem that does not involve neither the providers nor the final users, since solving interoperability problems are shifted in the intermediate level represented by the Virtual Hub.
ACKNOWLEDGEMENTS
The research leading to the results of this paper is partially funded under the ICT Policy Support Programme (ICT PSP) as part of the Competitiveness and Innovation Framework Programme by the European Community (CIP) GA n°620400.
REFERENCES
Baiocchi, V., & Lelo, K., 2005. Georeferencing the historical maps of Rome between the seventeenth and eighteenth centuries. CIPA 2005 XX International Symposium-International cooperation to save the world's cultural heritage. Torino. September 2005, Vol. 26, pp. 114-118.
Brovelli, M. A., Minghini, M., Giori, G., & Beretta, M., 2012. Web geoservices and ancient cadastral maps: the Web CARTEProject. Transactions in GIS, 16(2), 125-142.
Carrion, D., Migliaccio, F., Minini, G., & Zambrano, C., 2013. Rappresentazione cartografica e condivisione di dati storici in ambiente GIS. Atti 17a conferenza nazionale ASITA, 5-7 novembre 2013, Riva del Garda – Italy, pp.379-384.
ENERGIC-OD Consortium. Virtual hubs - system architecture - D5.1 (2015).
Farruggia, A., 2009. Cartografia tematica e analisi diacroniche: casi di studio del Catasto antico sabaudo ai SIT contemporanei.
In Panzeri M., & Farruggia, A., Fonti, metafonti e GIS per l’indagine della struttura storica del territorio, Celid, Torino, pp. 71-78.
Gauthiez, B., & Zeller, O., 2009. Espace costruit, espace social à Lyon aux XVII-XIXe seècles: l'apport du SIG. In M. Panzeri, & A. Farruggia, Fonti, metafonti e GIS per l'indagine della struttura storica del territorio, Celid, Torino, pp. 39-49.
Gauthiez, B., & Zeller, O., 2014. Lyons, the Spatial Analysis of a City in the 17th and 18yh Centuries. Locating and Crossing Data in a GIS Built from Written Sources. In Mapping Spatial Relations, Their Perceptions and Dynamics, Lecture Notes in Geoinformation and Cartography, pp. 97-118.
Geoserver. http://geoserver.org/ (06 Jun. 2017).
Gregory, I. N., Bennett, C., Gilham, V. L., & Southall, H. R., 2002. The Great Britain Historical GIS Project: from maps to changing human geography. The Cartographic Journal, 39(1), 37-49.
Heere H., 2006. The use of GIS with property maps. e-Perimetron, vol.1, n.4, pp. 297-307
Lelo, K., & Travaglini, M., 2005. The GIS-based historical atlas of Rome. In XXth International CIPA Symposium, September 2005, Vol. 26.
Micalizzi, P., Magaudda, S., Buonora, P., & d’Elia, L. S., 2012. A GIS for the city of Rome: archives, architecture, archeology. e-Perimetron, 7(1), 28-35.
Nativi, S., Khalsa Siri Jodha, D. B., Craglia, M., Pearlman, J., Mazzetti, P., Rew, R., 2011. The Brokering Approach for Earth Science Cyberinfrastructure. EarthCube White Paper.
Nativi, S., Craglia, M., Pearlman, J., 2013. Earth science infrastructures interoperability: the brokering approach. Selected Topics. Applied Earth Observations and Remote Sensing, IEEE Journal of, 6(3), 1118-1129.
Panzeri M., 2008. Fonti catastali e spazi digitali: il Cattastro della Molto Magnifica Communità di Cumiana (1738-1755) da documento storico a risorsa per il territorio. In Longhi A., Catasti e territori. L’analisi dei catasti storici per l’interpretazione del paesaggio e per il governo del territorio, Alinea Editrice, Firenze 2008, pp. 199-211.