CHANGE DETECTION AND LAND USE / LAND COVER DATABASE UPDATING USING
IMAGE SEGMENTATION, GIS ANALYSIS AND VISUAL INTERPRETATION
Jean-Franc¸ois Mas and Rafael Gonz´alez
Centro de Investigaciones en Geografia Ambiental (CIGA) Universidad Nacional Aut´onoma de M´exico (UNAM)
Antigua Carretera a Patzcuaro No. 8701 Col. Ex-Hacienda de San Jos´e de La Huerta
C.P. 58190 Morelia Michoacan MEXICO [email protected]; [email protected]
KEY WORDS:Land cover database, Updating, Uncertainty, Image segmentation, Visual interpretation
ABSTRACT:
This article presents a hybrid method that combines image segmentation, GIS analysis, and visual interpretation in order to detect discrepancies between an existing land use/cover map and satellite images, and assess land use/cover changes. It was applied to the elaboration of a multidate land use/cover database of the State of Michoac´an, Mexico using SPOT and Landsat imagery. The method was first applied to improve the resolution of an existing 1:250,000 land use/cover map produced through the visual interpretation of 2007 SPOT images. A segmentation of the 2007 SPOT images was carried out to create spectrally homogeneous objects with a minimum area of two hectares. Through an overlay operation with the outdated map, each segment receives the “majority” category from the map. Furthermore, spectral indices of the SPOT image were calculated for each band and each segment; therefore, each segment was characterized from the images (spectral indices) and the map (class label). In order to detect uncertain areas which present discrepancy between spectral response and class label, a multivariate trimming, which consists in truncating a distribution from its least likely values, was applied. The segments that behave like outliers were detected and labeled as “uncertain” and a probable alternative category was determined by means of a digital classification using a decision tree classification algorithm. Then, the segments were visually inspected in the SPOT image and high resolution imagery to assign a final category. The same procedure was applied to update the map to 2014 using Landsat imagery. As a final step, an accuracy assessment was carried out using verification sites selected from a stratified random sampling and visually interpreted using high resolution imagery and ground truth.
1. INTRODUCTION
Due to its latitudinal position, its topography, climate and geol-ogy diversity, Mexico presents a high biodiversity. In particular, there are many types of vegetation, including temperate and tropi-cal forests (Toledo, 1994). Besides, Mexico presents high rates of land use/cover change (LUCC) including important processes of deforestation and forest degradation (Mas et al., 2004, Vel´azquez et al., 2010). LUCC results in complex mosaics of land use and forest patches. For these reasons, mapping land use/cover is not an easy task.
As a result of this large diversity, land use/cover (LUC) map’s classification schemes are complex. For instance, LUC maps from the National Institute of Statistics and Geography (INEGI), the Mexican mapping agency, have 57 different types of vege-tation and 20 types of land use (INEGI, 2011). Different types of covers present similar spectral response and the same type of cover can present different spectral responses depending on the phenology, the conservation state and the density of vegetation. Due to LUCC, frequent updating and the elaboration of multi-date cartographic databases are required to assess change. Differ-ent approaches can be used to elaborate and update existing LUC maps. On the one hand, visual interpretation, often computer-aided, has been widely used to elaborate LUC cartography in-cluding cartography over large areas such as Europe (Feranec et al., 2007), Africa (Disperati and Virdis, 2015) and, China (Zhang et al., 2014). It enables map producers to include many classifi-cation criteria such as texture, shape, pattern, size of object and proximity between object, interpreter’s knowledge, etc. and has been shown to achieve more accurate results than spectral-based digital approaches (Sader et al., 1990, Mas and Ramirez, 1996,
Palacio Prieto and Gonz´alez, 1994, van den Broek et al., 2004). When visual interpretation is used to update existing cartography, LUCC are extracted accurately (Zhang et al., 2014, Disperati and Virdis, 2015). On the other hand fully automatic processing ap-proaches based on digital classification of spectral data eventu-ally combined with ancillary information (Gebhardt et al., 2014) permit a faster analysis but they present often more classification errors than visual interpretation.
This study aims at developing a hybrid method (semi-automatic processing and computer-aided visual interpretation) which com-bines image segmentation, GIS analysis, and visual interpretation to elaborate a multidate cartographic database from remote sens-ing data, to produce an updated cartography and assess LUCC (deforestation).
2. STUDY AREA AND MATERIALS
The State of Michoac´an (Fig.1), which encompasses about 60,000 square kilometers, is one of the most diverse State of Mexico with different types of tropical and temperate forests. It also presents important processes of land use/cover change (Bocco et al., 2001).
Figure 1: State of Michoac´an, Mexico. The red square is the area represented in the subsequent figures
3. METHODS
Method was modified from the approach proposed by Radoux & Defourny (2010) and Radoux et al., (2014) to update cartogra-phy and/or detect changes. This approach consists of using an existing but outdated LUC map to classify a recent image. In this case, a segmentation of the 2007 SPOT (Syst`eme Probatoire d’Observation de la Terre) images was carried out using a region growing algorithm, creating spectrally homogeneous objects with a minimum area of two hectares. Then the segmented image and the outdated map were overlaid in order to assign a label (cate-gory) at each segment: Each segment was labeled based on the class from visual interpretation-based map covering the largest proportion of its area. The spectral response of each segmented was also computed. Therefore each segment was associated to a category (from the map) and spectral indices (mean and stan-dard deviation of digital number values for each spectral band). Each category was then defined by a density function (figure 2), which describes the relative likelihood for a pixel with a given spectral value to belong to a particular LUC category. Segments whose label from the map did not match the “typical” spectral re-sponse of their category were identified as uncertain segments (outliers) by trimming (removal of extreme “outliers“ values). These segments were classified using spectral response by means of the tree C5 classifier as a help for the visual interpreter. How-ever, the final category was assigned by visual interpretation of a false color composite of the SPOT images. Finally, an accuracy assessment was carried out using a stratified random sampling and panchromatic fused SPOT images following the method pro-posed by Card (1982).
The same procedure was applied to update the map to 2014 us-ing Landsat imagery. In the update of 2007 map to 2014, it can be reasonably assumed that many discrepancies were effective land use/cover change. As a final step, an accuracy assessment was carried out using verification sites selected from a stratified random sampling and visually interpreted using high resolution
imagery and ground truth.
Figure 2: Density function per analysed band.
4. RESULTS
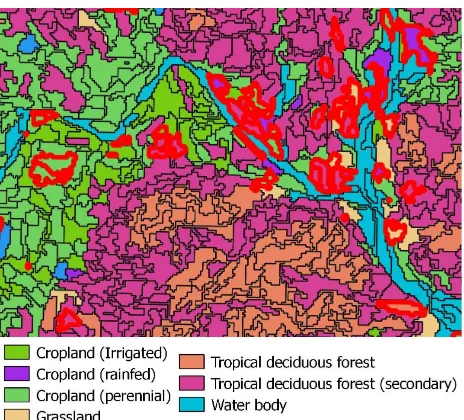
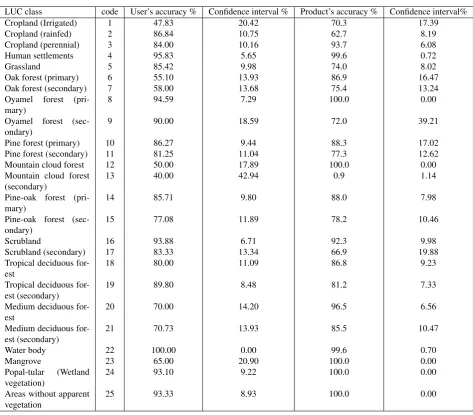
A classification scheme of 25 LUC categories including 15 for-est categories was defined (Table 1) In this 1:100,000 2003 LUC map, objects representation depends on cartographic rules as min-imum cartographic area and polygon generalization (Figure 3). The segmentation of the 2007 SPOT images created spectrally homogeneous objects with a minimum area of two hectares (Fig-ure 4). The segmented image was therefore spatially more de-tailed than the 2003 map obtained through visual interpretation (Figure 5).
The accuracy assessment from the 2007 updated segmentation indicated an overall accuracy of 79.5 %±3.3 and user and pro-ducer accuracies between 50 and 100% (Table 2 in Appendix). The 2007 map was used to update the information using 2014 Landsat imagery (Figures 6 and 7 ). In summary, this method permits to update maps from different imagery inputs.
5. DISCUSSION AND CONCLUSION
Visual interpretation is widely used to update existing cartogra-phy. According to Zhang et al. (2014) processes of LUCC are extracted more accurately by visual interpretation than by digital classification. However, in case of the elaboration of new car-tography (without existing previous map) or when the outdated existing map is represented at a coarser scale, visual delimitation of polygons, a time consuming task, has to be carried out. In these cases, digital image segmentation is a way to capture the limits between the different LUC types. In addition, hybrid approach allowed optimizing the work of the interpreter by identifying ar-eas with likely errors or changes. Spectral classification is used but the “last word” is given to the visual interpretation because, due to spectral confusion, we considered expert opinion more ac-curate.
LUC category code
Cropland (Irrigated) 1
Cropland (rainfed) 2
Cropland (perennial) 3
Human settlements 4
Grassland 5
Oak forest (primary) 6
Oak forest (secondary) 7
Oyamel forest (primary) 8
Oyamel forest (secondary) 9
Pine forest (primary) 10
Pine forest (secondary) 11
Mountain cloud forest 12
Mountain cloud forest (secondary) 13 Pine-oak forest (primary) 14 Pine-oak forest (secondary) 15
Scrubland 16
Scrubland (secondary) 17
Tropical deciduous forest 18 Tropical deciduous forest (secondary) 19
Medium deciduous forest 20
Medium deciduous forest (secondary) 21
Water body 22
Mangrove 23
Popal-tular (Wetland vegetation) 24 Areas without apparent vegetation 25
Table 1: Classification scheme.
Figure 3: 2003 LUC map.
for the elaboration of a whole time series to monitor LUCC in Michoacan. Further work is necessary to deeply evaluate classifi-cation errors. the LUC map will be evaluated by interpreters from INEGI and verification sites used in the first accuracy assessment will be interpreted again by a second interpreter and, eventually verified in field in case of incongruence between the first and sec-ond interpretations. Finally, information from field plots from the National Forest Inventory will be integrated in the database.
ACKNOWLEDGEMENTS
This study was supported by the project”Monitoreo de la cu-bierta del suelo y la deforestaci´on en el Estado de Michoac´an: un an´alisis de cambios mediante sensores remotos a escala re-gional”(Fondo Mixto Conacyt - Gobierno del Estado de Mi-choac´an, grant number 192429). We would like to thank Luis
Figure 4: False color composite of the SPOT 5 Image, 2007. c
CNES.
Figure 5: SPOT 5 based updated segmentation (2007).
Figure 6: False color composite of the Landsat 8 Image, 2014. c
USGS/NASA Landsat. Red objects were the “uncertain” seg-ments.
Figure 7: Landsat 8 based updated segmentation (2014) Probable classification by C5 algorithm. Red objects were the “uncertain” segments before visual interpretation.
REFERENCES
Berkeley Image Segmentation, 2015.
Bocco, G., M´endoza, M. and Masera, O. R., 2001. La din´amica del cambio del uso del suelo en Michoac´an. Una propuesta metodol´ogica para el estudio de los procesos de deforestaci´on. Investigaciones Geogr´aficas 44, pp. 18–38.
Card, D. H., 1982. Using known map category marginal frequen-cies to improve estimates of thematic map accuracy.
Disperati, L. and Virdis, S. G. P., 2015. Assessment of land-use and land-cover changes from 1965 to 2014 in tam giang-cau hai lagoon, central vietnam. Applied Geography 58(0), pp. 48 – 64.
Feranec, J., Hazeu, G., Christensen, S. and Jaffrain, G., 2007. Corine land cover change detection in europe (case studies of the netherlands and slovakia). Land Use Policy 24(1), pp. 234 – 247.
Gebhardt, S., Wehrmann, T., Ruiz, M. A. M., Maeda, P., Bishop, J., Schramm, M., Kopeinig, R., Cartus, O., Kellndorfer, J., Ressl, R. et al., 2014. Mad-mex: Automatic wall-to-wall land cover monitoring for the mexican redd-mrv program using all landsat data. Remote Sensing 6(5), pp. 3923–3943.
INEGI, 2011. Metodolog´ıa para la Generaci´on y Actual-izaci´on de la Informaci´on de Uso de Suelo y Vegetaci´on, escala 1:250,000, Serie IV. Technical report.
Mas, J. and Ramirez, I., 1996. Comparison of land use classifi-cations obtained by visual interpretation and digital processing. ITC Journal (3), pp. 278–283.
Mas, J.-F., Vel´azquez, A., D´ıaz-Gallegos, J., Mayorga-Saucedo, A., Alc´antara, C., Bocco, G., Castro, R., Fern´andez, T. and P´erez-Vega, A., 2004. Assessing land use/cover changes: A nationwide multidate spatial database for Mexico. International Journal of Applied Earth Observation and Geoinformation 5(4), pp. 249– 261.
Palacio Prieto, J. and Gonz´alez, L. L., 1994. Clasificaci´on es-pectral autom´atica vs. clasificaci´on visual: un ejemplo al sur de la ciudad de m´exico. Investigaciones Geogr´aficas Bolet´ın 29, pp. 25–40.
R Core Team, 2013. R: A Language and Environment for Statisti-cal Computing. R Foundation for StatistiStatisti-cal Computing, Vienna, Austria.
Radoux, J. and Defourny, P., 2010. Automated image-to-map discrepancy detection using iterative trimming. Photogrammetric Engineering & Remote Sensing 76(2), pp. 173–181.
Radoux, J., Lamarche, C., Van Bogaert, E., Bontemps, S., Brock-mann, C. and Defourny, P., 2014. Automated training sample extraction for global land cover mapping. Remote Sensing 6(5), pp. 3965–3987.
Sader, S. A., Stone, T. A. and Joyce, A. T., 1990. Remote sens-ing of tropical forests: an overview of research and applications using non-photographic sensors. Photogrammetric Engineering and Remote Sensing 56(10), pp. 1343–1351.
Soares-Filho, B. S., Cerqueira, G. C. and Pennachin, C. L., 2002. Dinamica—a stochastic cellular automata model designed to sim-ulate the landscape dynamics in an amazonian colonization fron-tier. Ecological modelling 154(3), pp. 217–235.
Toledo, V. M., 1994. La biodiversidad de M´exico. Ciencias 34, pp. 43–57.
van den Broek, A. C., Smith, A. J. E. and Toet, A., 2004. Land use classification of polarimetric sar data by visual interpretation and comparison with an automatic procedure. International Journal of Remote Sensing 25(18), pp. 3573–3591.
Vel´azquez, A., Mas, J.-F., Bocco, G. and Palacio-Prieto, J. L., 2010. Mapping land cover changes in Mexico, 1976-2000 and applications for guiding environmental management policy. Sin-gapore Journal of Tropical Geography 31(2), pp. 152–162.
APPENDIX
LUC class code User’s accuracy % Confidence interval % Product’s accuracy % Confidence interval%
Cropland (Irrigated) 1 47.83 20.42 70.3 17.39
Cropland (rainfed) 2 86.84 10.75 62.7 8.19
Cropland (perennial) 3 84.00 10.16 93.7 6.08
Human settlements 4 95.83 5.65 99.6 0.72
Grassland 5 85.42 9.98 74.0 8.02
Oak forest (primary) 6 55.10 13.93 86.9 16.47
Oak forest (secondary) 7 58.00 13.68 75.4 13.24
Oyamel forest (pri-mary)
8 94.59 7.29 100.0 0.00
Oyamel forest (sec-ondary)
9 90.00 18.59 72.0 39.21
Pine forest (primary) 10 86.27 9.44 88.3 17.02
Pine forest (secondary) 11 81.25 11.04 77.3 12.62
Mountain cloud forest 12 50.00 17.89 100.0 0.00
Mountain cloud forest (secondary)
13 40.00 42.94 0.9 1.14
Pine-oak forest (pri-mary)
14 85.71 9.80 88.0 7.98
Pine-oak forest (sec-ondary)
15 77.08 11.89 78.2 10.46
Scrubland 16 93.88 6.71 92.3 9.98
Scrubland (secondary) 17 83.33 13.34 66.9 19.88
Tropical deciduous for-est
18 80.00 11.09 86.8 9.23
Tropical deciduous for-est (secondary)
19 89.80 8.48 81.2 7.33
Medium deciduous for-est
20 70.00 14.20 96.5 6.56
Medium deciduous for-est (secondary)
21 70.73 13.93 85.5 10.47
Water body 22 100.00 0.00 99.6 0.70
Mangrove 23 65.00 20.90 100.0 0.00
Popal-tular (Wetland vegetation)
24 93.10 9.22 100.0 0.00
Areas without apparent vegetation
25 93.33 8.93 100.0 0.00