VOLUMETRIC FOREST CHANGE DETECTION THROUGH VHR SATELLITE
IMAGERY
Devrim Akca a, *, Efstratios Stylianidis, Konstantinos Smagas b, Martin Hofer c, Daniela Poli a, Armin Gruen a, d, Victor Sanchez Martin e, Orhan Altan f, g, Andreas Walli c, Elisa Jimeno e, Alejandro Garcia e
a
4DiXplorer AG, Zurich, Switzerland – <devrim, daniela>@4dixplorer.com b
GeoImaging Ltd, Nicosia, Cyprus – [email protected] c
GeoVille Information Systems GmbH, Innsbruck, Austria – <hofer, walli>@geoville.com d Chair of Information Architecture, ETH Zurich, Switzerland – [email protected] e
Ingeniería Y Soluciones Informáticas S.L., Sevilla, Spain – <vsanchez, elisa.jimeno, agarcia>@isoin.es f
Ekinoks Surveying Software Engineering Ltd, Istanbul, Turkey – [email protected] g
Department of Geomatics Engineering, Istanbul Technical University, Turkey – [email protected]
Commission VIII, WG VIII/7
KEY WORDS: Forest, VHR satellite imagery, orientation, image matching, DSM generation, 3D change detection
ABSTRACT:
Quick and economical ways of detecting of planimetric and volumetric changes of forest areas are in high demand. A research platform, called FORSAT (A satellite processing platform for high resolution forest assessment), was developed for the extraction of 3D geometric information from VHR (very-high resolution) imagery from satellite optical sensors and automatic change detection. This 3D forest information solution was developed during a Eurostars project. FORSAT includes two main units. The first one is dedicated to the geometric and radiometric processing of satellite optical imagery and 2D/3D information extraction. This includes: image radiometric pre-processing, image and ground point measurement, improvement of geometric sensor orientation, quasi-epipolar image generation for stereo measurements, digital surface model (DSM) extraction by using a precise and robust image matching approach specially designed for VHR satellite imagery, generation of orthoimages, and 3D measurements in single images using mono-plotting and in stereo images as well as triplets. FORSAT supports most of the VHR optically imagery commonly used for civil applications: IKONOS, OrbView – 3, SPOT – 5 HRS, SPOT – 5 HRG, QuickBird, GeoEye-1, WorldView-1/2, Pléiades 1A/1B, SPOT 6/7, and sensors of similar type to be expected in the future. The second unit of FORSAT is dedicated to 3D surface comparison for change detection. It allows users to import digital elevation models (DEMs), align them using an advanced 3D surface matching approach and calculate the 3D differences and volume changes between epochs. To this end our 3D surface matching method LS3D is being used. FORSAT is a single source and flexible forest information solution with a very competitive price/quality ratio, allowing expert and non-expert remote sensing users to monitor forests in three and four dimensions from VHR optical imagery for many forest information needs. The capacity and benefits of FORSAT have been tested in six case studies located in Austria, Cyprus, Spain, Switzerland and Turkey, using optical data from different sensors and with the purpose to monitor forest with different geometric characteristics. The validation run on Cyprus dataset is reported and commented.
* Corresponding author
1. INTRODUCTION
Traditionally, forest monitoring and information gathering is done through expensive and time consuming field studies in combination with aerial surveys (optical imagery and or Airborne Laser Scanning-ALS/LiDAR). This is followed by digital data analysis in image processing suites and Geographic Information Systems (GIS) to derive basic parameters such as area coverage, species, height, volume, health, damage, change, deforestation, etc. Subsequently the map and statistical data is used for management decisions, implementations of regulations or simply for industry operations.
The range of requirements calls for more direct remote sensing capacities and technologies offering a high level of reliable information quickly, and at reduced costs. The satellite earth observation (EO) industry has foreseen such market opportunities and responds to these increasing demands. The investments and the confidentially in this constantly growing market are very high. The very high resolution (VHR)
stereoscopic acquisitions from space offer less expensive, faster and more agile remote sensing capacities than the aerial ones, thereby providing a complementary, single source for orthoimages and ground elevation information. In addition, satellite systems offer other advantages to aerial photography and laser scanning, such as no overflight permissions needed, a much greater ground coverage capacity, and repetition of image acquisitions on a certain area of interest until cloud coverage is free.
Although the infrastructure (satellite) investment have been made, investment and development of exploitation technologies (i.e. processing chains) which can put the new EO capacities to work, are lacking behind. We have identified this market opportunity for the forestry sector, and carried a project to develop a new software platform and associated services (products) specifically forest monitoring and management tasks. The project is entitled as a satellite processing platform for high resolution forest assessment (FORSAT), which is a research & development project co-funded by the national funding
authorities of the participating partners under Eurostars and the European Commission (Figure 1).
Figure 1. The FORSAT project
The aim of the FORSAT project (www.forsat.eu) is to raise the current technological level of aerial imagery in combination with ALS for forest cover mapping applications to a standalone satellite-based monitoring capacity. Specifically, to transfer the existing precise processing capabilities of airborne techniques to VHR optical, stereographic satellite data, thereby providing a single source forest information solution. The FORSAT software platform, described in Section 2, enables high resolution (HR) thematic mapping of forest areas along with canopy height, thereby allow derivation of forest volume. Based on new image acquisitions as well as historical data, the system allows automatic change detection of forest / non-forest areas along with change in forest volume.
The FORSAT functionalities, accuracy, capacities and applicability to specified market segments were tested by executing application case studies located in Cyprus, Turkey, Switzerland, Austria and Spain. The results have generated the necessary facts and needed trust of other public bodies and private organisations to use VHR satellite data for many forest information needs, which do not require centimetre accuracy. In Section 3 the results achieved on Cyprus test case are reported and discussed, followed by final conclusions.
2. TECHNICAL APROACH
The FORSAT software allows analysing raw satellite imagery and extracting meaningful and quantitative information about the world's forests, such as area, volume and measurements of deforestation or even regeneration of a forest.
The FORSAT software has a workflow which is graphically represented in Figure 2. The overall architecture comprises four building blocks (pre-processing, geo-referencing, Digital Surface Models (DSMs) generation and 3D comparison), being each block tightly coupled in a software suite framework.
The same workflow could be seen as the combination of two main tasks. The first one is dedicated to the geometric and radiometric processing of satellite imagery and 2D/3D information extraction, that is: radiometric pre-processing, image and ground point measurement and sensor orientation, quasi-epipolar image derivation for 3D stereo measurements, DSMs extraction, orthorectification, 3D vector measurement. This unit supports most of the HR and VHR optical imagery commonly used for civil applications, for example IKONOS, GeoEye-1, WorldView-1/2, SPOT-5/6/7, Pleiades-1A/1B and can be easily updated to similar images from future missions.
The second task is dedicated to 3D surface comparison for change detection. The unit allows the users to import DSMs and Digital Terrain Models (DTMs), align them using advanced 3D
surface matching techniques and calculate the 3D volume differences.
The technical approach comprises a bunch of interconnected algorithms whose details are given in Poli (2005), Zhang (2005) and Akca (2007) all of which are the doctoral studies performed at the photogrammetry group of ETH Zurich.
Figure 2. Main components of the FORSAT software
2.1 Metadata files
The VHR satellite images are provided together with their metadata by the vendors. Before applying the algorithms for the geo-referencing of the images, some operations are required in order to prepare the input data. The pre-processing includes both the analysis of the metadata files for the extraction of the required information and the radiometric improvement of the images in order to facilitate the point measurements (Poli, 2007).
2.2 Radiometric pre-processing
The performance of the image matching and feature extraction procedures depend on the quality and quantity of information being carried out by them. Compared to the traditional scanned 8-bit/pixel images, digital imagery from linear array sensors has better radiometric performance e.g. higher dynamic range and signal-to-noise ratio. Nowadays, most of the linear array sensors have the ability to provide high quality digital images. However, some radiometric problems still have to be considered: poor image contrast, the image blur problems mainly caused by CCD line jitter, kappa jitter and motion blur and deficiencies of the lens system, image noise, and radiometric problems caused by the variations in the sensor view angle, the sun angle, shadowing, and the seasonal and the atmospheric conditions. These problems are usually beyond the control of the users. However, they have to be restored as much as possible. In order to reduce the effects of such radiometric problems and optimise the images for subsequent feature extraction and image matching, the image pre-processing methods have to be employed (Zhang, 2005).
Although the gamma correction, contrast enhancement, histogram equalisation are trivial applications and can be found
in many standard image processing software, the Wallis filter is a specific and powerful algorithm (Wallis, 1976). The filter forces the mean and standard deviation of an image to given target values. The FORSAT software includes the Wallis image pre-processing method.
2.3 Image pyramids
An image pyramid is a multi-resolution representation of the original image. It is used to speed-up the image matching computation while at same time keeping the finest spatial resolution of the final DSM output.
The image pyramids are used for coarse-to-fine hierarchical image matching methods. At present, many of the modern matching algorithms are based on the image pyramids. With coarse-to-fine hierarchical strategy based on image pyramid representation, the matches obtained at a coarse resolution are used to guide and limit the search space for the matching of finer-resolution features. In this strategy, the usual way is to start matching at a low resolution pyramid level, where the influence of image noise is reduced and coarse approximate values are sufficient to stay within the pull-in range of the matching procedure. In addition, in the low resolution images, the regions of interest for correspondence analysis in levels of higher resolution can be found at low cost because irrelevant details are no longer available there. The computations are usually performed successively on each level of the hierarchy using the results of the higher level as approximate information (Ackermann and Hahn, 1991; Zhang and Gruen, 2006).
Figure 3. Image pyramid levels at FORSAT software; the level size defined according to 33-n x 33-n formula where n stands for
the level number
Given these motivations, FORSAT software generates the image pyramids after the pre-processing step, starting from the original resolution images. Each pyramid level is generated by multiplying a generating kernel and reduces the resolution by factor 3 (Figure 3).
2.4 Geo-referencing
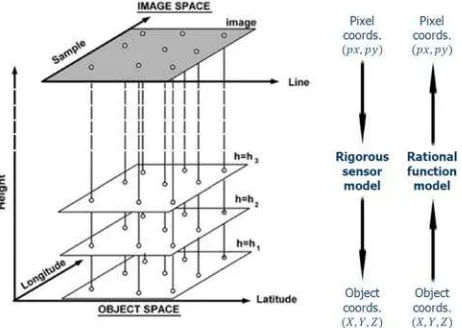
The FORSAT software uses the rational function model (RFM), a well-known non-rigorous (generalised) orientation method based on the rational polynomials functions. A RFM is generally the ratio of two polynomials derived from the rigorous sensor model and the corresponding terrain information, which does not reveal the sensor parameters. The commercial high-resolution satellite imaging systems are supplied with only rational polynomials coefficients (RPCs) instead of rigorous sensor model parameters.
In the RFM, the image pixel coordinates are expressed as the ratios of polynomials of object coordinates, which are usually correspond to latitude, longitude and height values. The RFM is usually computed based on a rigorous sensor model (Figure 4).
Figure 4. RPC computation (Grodecki and Dial, 2003)
With the given parameters of the rigorous model and by projecting evenly distributed image points into the object space, multiple-layer 3D object points can be computed and used as virtual (fictitious) control points. The control points are created based on the full extent of the image and the range of elevation variation in the object space. The entire range of elevation variation is sliced into several layers. Then, the RPCs are calculated by a least squares adjustment with these virtual control points (Tao and Hu, 2001).
Grodecki and Dial (2003) proposed a block adjustment method for the VHR satellite imagery where the geo-referencing accuracy of the RFM is improved by use of a few numbers of control points. This RPC block adjustment method was implemented in the FORSAT software. It can run for stereo, triplet and block image configurations.
2.5 DSM generation
The automated DSM generation was performed using a modified version of the multiple primitive multi-image (MPM) matching method introduced by Zhang and Gruen (2004), Zhang (2005) and Zhang and Gruen (2006).
In order to achieve successful and reliable matching, the method matches a dense pattern of features with an appropriate matching strategy, making use of all available and explicit knowledge, concerning sensor model, network structure, image content and geometrical constraints such as the epipolar geometry constraint. The approach combines area-based
matching (ABM) and feature-based matching (FBM), matching parameter self-tuning, generation of more redundant matches and a coarse-to-fine hierarchical matching strategy (Zhang et al., 2006; Baltsavias et al., 2007).
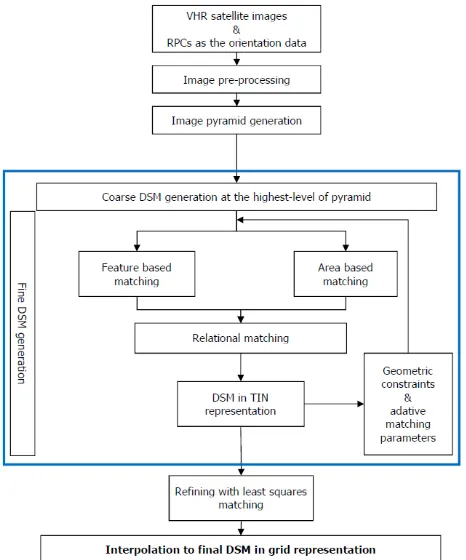
The overall data flow is given schematically in Figure 5.
Figure 5. Workflow of the automated DSM generation in the FORSAT software
After the pre-processing of the original images and production of the image pyramids, the area based and the feature based matching methods are run in parallel. Starting from the low-density features on the images with the low resolution, the matching procedure progressively approaches finally on the original resolution images. Since all the matching procedures are based on the concept of multi-image matching (two-fold and three-fold images) guided from the object space, any number of images could be processed simultaneously. The triangulated irregular network (TIN) from DSM is reconstructed from the matched features on each level of the pyramid using the Delaunay triangulation method, which in turn is used in the subsequent pyramid level for the approximations and adaptively computation of the matching parameters. Finally least squares matching methods are used to achieve more precise matches for all the features and identify some false matches.
The entire system consists of three mutually connected sub-systems: the image pre-processing module, the multiple primitive multi-image matching (MPIM) module and the refined matching module. The image pre-processing module is used to reduce the effects of the radiometric problems and optimise the images for subsequent feature extraction and image matching procedure. A combined matching process (point matching, edge matching and relational matching processes) goes through all the image pyramid levels in the MPIM module and generates good enough approximations for the refined matching module. In the final refined matching
module, the least squares matching methods are performed only on the original resolution images to achieve sub-pixel accuracy matches for all matched features obtained in the MPIM module (Zhang, 2005).
2.6 3D comparison and analysis
The co-registration is crucially needed wherever spatially related data sets can be described as surfaces and has to be transformed to each other. Examples can be found in medicine, computer graphics, animation, cartography, virtual reality, industrial inspection and quality control, change detection, spatial data fusion, cultural heritage, photogrammetry, etc.
Since DSMs derived by any method or device represent the object surface, the problem can be defined as a surface registration problem. There have been some studies on the co-registration of DSMs for control information and for change detection tasks. This work is known as DEM matching (Ebner et al., 1988; Rosenholm and Torlegard, 1988; Mitchell and Chadwick, 1999). This method basically estimates the 3D similarity transformation parameters between two DEM patches, minimising the sum of the squares of the elevation differences (1D along the z-axes). The 1D elevation differences may not truly represent the surface-to-surface distance where terrain is complex with undulations.
For quality evaluation of DSMs, often a reference DSM is interpolated in the DSM to be checked. This approach is suboptimal (Gruen et al., 2004), since:
at surface discontinuities surface modelling errors may lead to large height differences although the measurements are correct (Figure 6a), and
if the reference frames of the two DSMs differ (e.g. shifts and tilts), then again large differences occur, especially at discontinuities although the heights may be correct (Figure 6b).
(a) (b)
Figure 6. The sub-optimality between 1D elevation difference (Δz) and the spatial distance (d)
These shortcomings can be overcome by employing the approach where the shortest 3D (Euclidean) distance between each reference point and the produced DSM is used (Gruen and Akca, 2005; Akca, 2010; Akca et al., 2010).
As a consequence, fully satisfying general solution was developed and implemented in the FORSAT software. Although the registration of 3D point clouds and DSMs is a very actively working area in many disciplines, we notice that a contribution that responds favourably to the following aspects is needed.
1. co-registration capability with higher order spatial transformation models,
2. co-registration and comparison of full 3D surfaces (as opposed to 2.5D),
3. a rigorous mathematical formulation for high accuracy demands,
4. a flexible model for further algorithmic extensions, 5. mechanisms and statistical tools for internal quality
control,
6. capability of matching of data sets in different quality and resolution.
We opted for the least squares 3D surface matching (LS3D) method (Gruen and Akca, 2005; Akca, 2007; Akca, 2010). The LS3D method is a rigorous algorithm for the matching of overlapping 3D surfaces and/or point clouds. It estimates the transformation parameters of one or more fully 3D surfaces with respect to a template surface, using the generalised Gauss– Markov model, minimising the sum of the squares of the
Euclidean distances between the surfaces. This formulation gives the opportunity to match arbitrarily oriented 3D surfaces, without using explicit tie points. It is a powerful method whose accuracy and precision potential is directly dependent on the quality of the input data. Details of the procedure can be found in Akca and Gruen (2005; 2007). The 3D co-registration/comparison module of the FORSAT software is a specialised implementation of the LS3D method.
2.7 User interface
FORSAT Software suite is not a monolithic system which means every core module works independently but related to each other at the same time. FORSAT Software suite uses GUI (Graphical User Interface) which eases users to work with the software (Figure 7).
Figure 7. Graphical user interface of the FORSAT software
3. APPLICATION RESULTS: DEFORESTATION ANALYSIS IN CYPRUS
The climate of Cyprus is characterised by mild and rain-laden winters as well as dry and hot summers. Due to its climate conditions it is predestined for the breakout of forest fires. The high risk for forest ecosystems is also boosted through human interventions.
The forest fire of Saittas, raged in 2007, was defined as demonstration site for the generation of the pilot application. A reason for this decision was the disastrous impact of the fire to the local vegetation which is still visible despite the long period of years between the event and image acquisition.
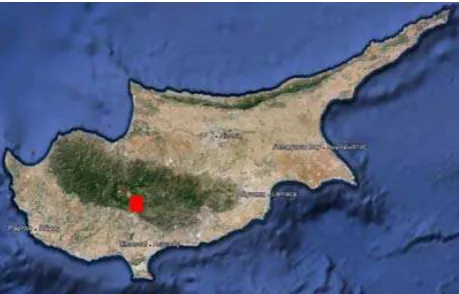
The area of interest (AOI) delimited by a red frame covers an area of about 45 km² and includes the city of Pelentri in the Limassol district (Figure 8). There was an Ikonos stereo pair from October 2001 available which was used for the calculation of the DSM before the forest fire. For the actual date no VHR
stereo coverage was available so a new Pléiades stereo acquisition was ordered for the specific area. The Pléiades coverage was acquired in July 2014 (Fig. 9).
Figure 8. The AOI is located in the centre of Cyprus (Source: Google Earth)
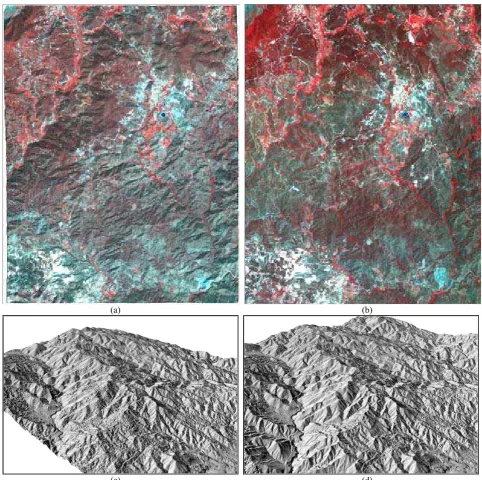
(a) (b)
(c) (d)
Figure 9. (a) Ikonos image © of October 2001, (b) Pléiades image © of July 2014, (c) Ikonos DSM, (d) Pléiades DSM. FORSAT Consortium © copyright. All rights reserved.
Based on the archived Ikonos stereo pair and the new Pléiades stereo pair, a historic DSM (Figure 9c) and an actual DSM (Figure 9d) were generated using the FORSAT software. The resulting DSMs were generated with a resolution of 2.0 meters. On the basis of the generated DSMs, the change analysis was performed with “3D Comparison and Analysis” module of the FORSAT software. The effect of the forest fire of year 2007 can be seen in the west of the change map (see the large blue ellipse in Figure 10a). Furthermore, there are smaller burned areas near Pelentri in the north-east of the AOI (see the blue circle in the north-east of Figure 10a). The decreased areas in the south-east of the AOI are man-made changes.
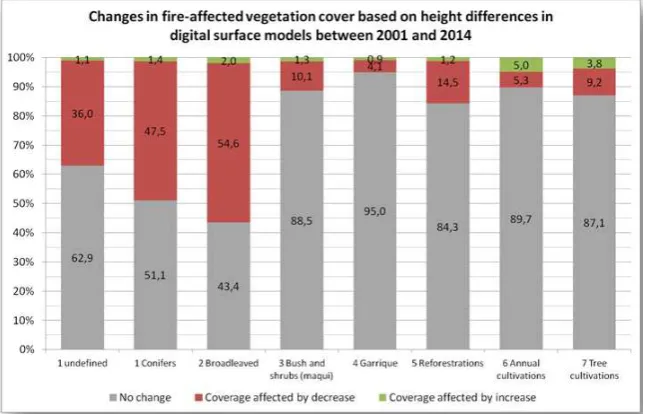
Figure 11 shows that more than half (54.6 %) of the broadleaved forest area, 47.5 % of conifer forest and more than a third (36.0 %) of the undefined (forest) area were affected by
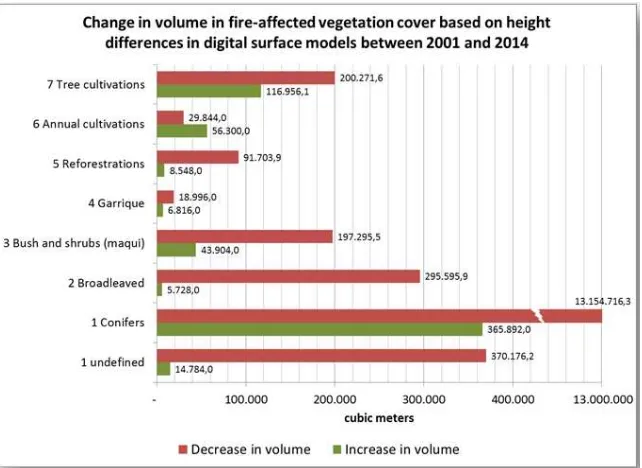
the decrease in height. We noticed that the forest has still not recovered from the fire in 2007. Figure 12 visualizes the change in volume in fire-affected vegetation cover based on height differences in DSMs between 2001 and 2014. It illustrates that there is a large decrease (approx. 13 Mio. m3
) of conifer forest. However, this class has also the highest volume increase (365.892 m3) but it has to be noticed that conifer forest cover almost 70% of the whole fire-affected area. Other land cover classes with a volume decrease of nearly 200’000 m3 and more are undefined and broadleaved forest, tree cultivations as well as bush and shrubs (maqui). Besides conifer forest only tree cultivations have a volume increase of more than 100’000 m3. An interesting fact is that the area affected by decrease in height of land cover class annual cultivations is larger but regarding the change in volume the increase dominates.
(a)
(b)
(c)
(d)
(e)
Figure 10. Change map (a); 3D view of west ellipse region (b), north-east circle region (c), and south-east small ellipse region (d). Legend showing difference in height in meter unit (e). FORSAT Consortium © copyright. All rights reserved.
Figure 11. Change in fire-affected vegetation cover
Figure 12. Change in volume in fire-affected vegetation cover
4. CONCLUSIONS
We developed a software suite, so called FORSAT which is capable of providing spatial information for long term monitoring of forest areas. The basic input data is VHR satellite imagery. The software consists of mutually linked modules which are pre-processing, geo-referencing, DSM generation and post-processing, and 3D comparison and analysis. The pilot application study demonstrates the capability of the FORSAT software especially for forest change analysis and provides an insight in the various service applications related to forest as well as other topics. The results of FORSAT provide single source, flexible forest information solutions with a very competitive price/quality ratio, allowing for new market entry in the forest sector.
REFERENCES
Akca, D., Gruen, A., 2005. Recent advances in least squares 3D surface matching. In: Gruen, A., Kahmen, H. (Eds.), Optical 3-D Measurement Techniques VII, Vienna, Austria, October 3-5, vol. II, pp. 197-206.
Akca, D., 2007. Least Squares 3D surface matching. Ph.D. thesis, Institute of Geodesy and Photogrammetry, ETH Zurich, Switzerland. Mitteilungen Nr.92, 78 pages.
Akca, D., Gruen, A., 2007. Generalized Least Squares multiple 3D surface matching. ISPRS Workshop on Laser Scanning 2007 and SilviLaser 2007, Espoo, Finland, September 12-14. International Archives of the Photogrammetry, Remote Sensing and Spatial Information Sciences, vol. 36, part 3 / W52, pp. 1-7.
Akca, D., 2010. Co-registration of surfaces by 3D Least Squares matching. Photogrammetric Engineering and Remote Sensing, 76 (3), 307-318.
Ackermann, F., Hahn, M., 1991. Image pyramids for digital photogrammetry. Digital Photogrammetric Systems, Ebner/Fritsch/Heipke (Eds.), Wichmann, pp. 43-58.
Baltsavias E., Kocaman S., Akca D., and Wolff K., 2007. Geometric and Radiometric Investigations of Cartosat-1 Data. ISPRS Hannover Workshop 2007, "High Resolution Earth Imaging for Geospatial Information", Hannover, Germany, May 29- June 1, (on CD-ROM).
Ebner, H., and G. Strunz, 1988. Combined point determination using digital terrain models as control information, IAPRS, 27(B11/3): 578–587.
Grodecki, J., Dial, G., 2003. Block Adjustment of High-Resolution Satellite Images Described by Rational Polynomials. PE&RS, Vol. 69, No. 1, pp. 59-68.
Gruen, A., Poli, D., Zhang, L., 2004. SPOT-5/HRS stereo images orientation and automated DSM generation. IAPRS, Vol. 35, Part 1, pp. 421-432.
Gruen, A., Akca, D., 2005. Least squares 3D surface and curve matching. ISPRS Journal of Photogrammetry and Remote Sensing, 59 (3), 151-174.
Mitchell, H.L., and R.G. Chadwick, 1999. Digital photogrammetric concepts applied to surface deformation studies, Geomatica, 53(4):405–414.
Poli, D., 2005. Modelling of Spaceborne Linear Array Sensors. Ph.D. thesis, Institute of Geodesy and Photogrammetry, ETH Zurich, Switzerland. Mitteilungen Nr.85, 217 pages.
Poli, D., 2007. A Rigorous Model for Spaceborne Linear Array Sensors. PE & RS, 73(2) 187-196.
Rosenholm, D., and K. Torlegard, 1988. Three-dimensional absolute orientation of stereo models using digital elevation models, PE & RS, 54(10):1385–1389.
Tao, C. V., Hu, Y., 2001. A Comprehensive Study of the Rational Function Model for Photogrammetric Processing. PE&RS, Vol. 66, No. 12, pp. 1477-1485.
Wallis, R., 1976. An approach to the space variant restoration and enhancement of images. Proc. of Symposium on Current Mathematical Problems in Image Science, Monterey, CA, USA. Zhang., L., Gruen, A., 2004. Automatic DSM generation from linear array imagery data. IAPRS, Vol. 35, Part B3, pp. 128-133. Zhang, L., 2005. Automatic Digital Surface Model (DSM) Generation from Linear array Images. Ph.D. thesis, Institute of Geodesy and Photogrammetry, ETH Zurich, Switzerland. ISBN 3-906467-55-4, Mitteilungen Nr.88, 219 pages.
Zhang, L., Gruen, A. 2006. Multi-image matching for DSM generation from IKONOS imagery. ISPRS Journal of Photogrammetry & Remote Sensing, 60, 195-211.
Zhang, L., Kocaman, S., Akca, D., Kornus, W., and Baltsavias, E., 2006. Test and performance evaluation of DMC images and new methods for their processing. ISPRS Commission I Symposium, Paris, July 3-6, (only on CD-ROM).