DETECTION AND QUANTIFICATION OF MORPHOLOGICAL CHANGES USING
MULTI-RESOLUTION TERRESTRIAL LASER SCANS
Reuma Arav and Sagi Filin
Mapping and GeoInformation Engineering Technion - Israel Institute of Technology
Haifa, 32000 reumaa,[email protected]
ABSTRACT:
Detection of changes is a key component for monitoring the dynamics of natural environments. Such detection is involved because of the complexity of such environments and the level of detail that is required in some cases. Answering the need for a detailed documentation of such changes in the surface morphology, a growing number of studies are making use of laser scanners, airborne and terrestrial, to detect and quantify them. For the change detection itself, many point-cloud processing based approaches interpolate the data and apply a pixel-based subtraction. Such analyses are 2.5D by nature and assume a change along fixed trend (mostly vertical) which does not reflect actual surface modifications in complex topographical settings. We propose in this paper a novel methodology for detection of changes in such environments. Our model involves no data loss, is three-dimensional, and requires no imposition of external constraints (e.g., enforcement of a positional constraint). Unique features of the proposed methodology lie in its ability to process point clouds with an unfixed scan resolution, and multiple scans from the same epoch. The proposed model is demonstrated on a site along the Mediterranean coastal cliff, a complex environment which undergoes rapid changes. The proposed model enables the detection of centimeter-scale changes as well as meter-size changes. These results serve as a basis for linking measured deformations with cliff-scale collapse mechanisms in order to gain a more comprehensive understanding of the cliff erosional processes and possibly identify collapse precursors such as crack widening and mass creep.
1 INTRODUCTION
Detection of changes in geomorphic environments plays a sub-stantial role in monitoring and understanding spatial processes. Landscape reshaping processes have significant impact on hu-mans by endangering existing infrastructure, causing loss of land and serious hazards. Despite the fact that individual events may be relatively insignificant, their cumulative effect can be dramatic, resulting in landslides, rockfall, mudflows, etc. (Miller et al., 2008). Therefore, detecting and quantifying landscape reshaping events, even small-scaled, would help further understanding geo-morphic process, particularly in relation to the underlying mech-anisms which drive their evolution.
Over the years researches have monitored and studied geomor-phological processes using either classical surveying techniques for small scale phenomena, or aerial photogrammetry for larger ones, mostly in two-dimensional space (Zviely and Klein, 2004; Marques et al., 2010, 2009; Redweik et al., 2008; Young et al., 2011; Woolard and Colby, 2002). Since most geomorphologi-cal phenomena are three-dimensional in nature, related airborne and terrestrial laser scanning research has expanded substantially, delivering high-resolution elevation models and significantly im-proving the monitoring of geomorphological processes (Rosser et al., 2005; Lim et al., 2005; Miller et al., 2008; Collins and Sitar, 2008; Pietro et al., 2008; Abell´an et al., 2009; Kringer et al., 2009; Filin et al., 2010; Collins et al., 2011; Rose and Basher, 2011; O’Neal and Pizzuto, 2011; Sch¨urch et al., 2011). Even though airborne laser scanning produces highly detailed informa-tion over wide areas, it is incapable of detecting and character-izing small changes, falls short when charactercharacter-izing near-vertical phenomena, and is limited in the flexibility of repeated campaigns due to the data acquisition cost. In contrast, terrestrial laser scans provide the resolution and accuracy that enable detection, char-acterization, and analysis of subtle geomorphological changes, as well as large scale deformations, with practically unlimited re-turn opportunities. This facilitates focused investigations of sea-sonal time-scale processes even down to the effect of single storm
events (e.g., Collins and Sitar, 2008; Collins et al., 2011). In such campaigns, repeated scans of the studied site are performed and compared in order to map evolving processes.
Although research into detection of changes via terrestrial laser scans has been indeed reported, it is mostly applied in a mere sub-traction manner of one resampled dataset against another, aiming to detect major changes by comparing digital elevation models, contours, and the like (Rosser et al., 2005; Du and Teng, 2007; Milan et al., 2007; Abell´an et al., 2009; Olsen et al., 2010; O’Neal and Pizzuto, 2011; Sch¨urch et al., 2011). Such analyses are 2.5D by nature and assume a change along fixed trend (mostly verti-cal ones) which does not reflect actual surface modifications in complex topographical settings. Furthermore, accuracy degra-dation is expected due to the data resampling process, which may introduce biases and artifacts when applied over the uneven point spacing which characterizes terrestrial laser scans. Under-standing that geomorphic phenomena are three-dimensional in nature emphasizes the importance of detecting changes in that space. Otherwise, trends within that space, e.g., the horizontally-dominated displacements of coastal-cliff retreat or changes of 3D surfaces in the evolution of notches, would not be described prop-erly, and actual processes will not be traced. In order to detect and monitor such phenomena properly, a fully three-dimensional model which is aware of resolution and scale becomes necessary.
topographic setting as coastal environments exhibit. We show how utilizing the proposed model allows us to overcome typi-cal resolution degradation associated with conventional change detection algorithms. The characterization and quantification of changes allow us to study and monitor collapse dynamics that oc-cur at the resolution limits of laser systems. These results serve as a basis for linking measured deformations with cliff-scale col-lapse mechanisms in order to gain a more comprehensive under-standing of the cliff erosional processes and possibly identify col-lapse precursors such as crack widening and mass creep.
2 DETECTION OF CHANGES
The proposed detection scheme is applied on raw data and per-formed point-wise. With a point-level based comparison scheme, data organization becomes a key factor for efficient access and association of the pointsets. More importantly, a point-based scheme should adapt to varying point spacing, occlusion effects, and scanner related artifacts. Ignoring their effect may lead to false alarm detections and misses. When considering a point-to-surrounding comparison, variations in point spacing within and between scans mean that detection methods which are suited both to close and distant points, cannot be easily established. This also means that use of a fixed window size towards which a point should be compared will either miss changes when set to accom-modate distant points, or result in a high rate of false alarms when set too tight (Zeibak and Filin, 2007). Since the definition of a point’s surrounding (namely neighborhood), which is adaptable to variation in scale and resolution, is fundamental for establish-ing a point-driven detection scheme, it is addressed first.
2.1 Data representation and neighborhood
We arrange the 3D point cloud as a range panorama, whose axes are the latitudinal and longitudinal scanning angles, and its in-tensity values are the scanning ranges. The fixed angular spacing
∆φ, and∆θ(given by system specifications), defines, in this con-text the pixel size, where the relation between the 3D point cloud and the polar data representation is given by Eq. (1)
x y zT=ρcosφcosθ cosφsinθ sinφT (1)
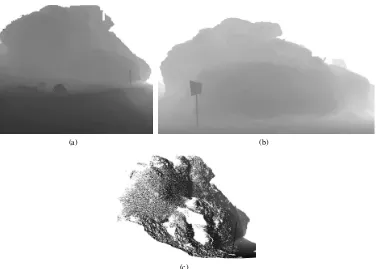
withx, yandz the Euclidian coordinates of a point,φ andθ, the latitudinal and longitudinal coordinates of the firing direction respectively, andρthe measured range. The panorama represen-tation directly establishes the topological neighborhood among points. In the proposed form, close, as well as distant objects (dark and light grey scales respectively, Fig. 1(a) and 1(b)), are continuously described despite difference in scanning resolution.
In order to determine if a measured point appear in the reference scan, the analyzed scan should be transformed to the reference scan local frame. This transformation enables examining the an-alyzed scan from the reference scanner position, and is computed using the relative orientation parameters (Eq. (2)):
the reference and the transformed analyzed scans.
2.2 Detection of changes using visibility query
Using the transformed scan, the two scans can be compared di-rectly, by considering the change detection as a visibility query, implemented via range image subtraction. When co-aligned, a pixel at a given location in both panoramas has a common rang-ing direction. Thus, change detection implementation is equiva-lent to asking whether a point measured in the analyzed scan can be seen from the reference scanner position (Zeibak and Filin, 2007). The relation between the ranges allude to three different states: change, no-change, and occlusion. Change is when a point in the reference scan appears in front of its counterpart in the an-alyzed scan (up to a threshold). Thus, the transformed point falls on an object that did not exist in the reference scan. No change is when a measured point in the analyzed scan, has a counterpart measure near it (up to a threshold value). Occlusion is when a point in the analyzed scan appear behind its counterpart in the reference scan, and is therefore deemed occluded. Due to lack of any other information, no decision can be made regarding the point in the reference frame and is therefore categorized as no-change, though an ‘occluded’ category can also be assigned to these points. Decision about each point is made using Eq. (3)
di,j=
withdi,j pixel in the difference image,Ri,j pixel in the
refer-ence image,Ai,j pixel in the analyzed one, andεan accuracy
threshold.
The range-image subtraction model offers an efficient compari-son scheme which is three-dimensional, independent of the scan-ning position and can handle points within occluded areas that otherwise would have been categorized as change. The proposed model also provides a direct solution to varying resolution within scans by transforming the analyzed scan into the reference scan frame. Notably, the panorama representation and the relative transformation allow detecting changes despite differences in point density and without any heavy computational load.
Despite its simplicity and efficiency, some adaptations that re-late to potential errors in the ranging process need to be made. These relate to some sensitivity in cases where the incidence an-gle in the reference scan gets approximately to90◦
(a) (b)
(c)
Figure 1: Scans in the panoramic representation, a) the reference scan, b) The analyzed scan in its original local reference frame (not transformed), c) The Analyzed scan in the panoramic representation and when transformed into the reference frame
∆hprovides a more subtle evaluation for point proximity in the detection of changes.
∆h= (Ri,j−Ai,j)·cos (α) (4)
withαthe incidence angle. Therefore, some modifications are made for points resulting in big difference of incidence angles in both scans, by testing the distance between the observed counter-parts in the direction of the surface normal, and deciding whether the point is far from the pre scanned surface or not.
di,j=
Change ∆h > εN
No change |∆h| ≤εN
Occlusion ∆h <−εN
(5)
This modification requires an efficient normal vector computation that needs to be performed only on the reference scan, as points in the analyzed scan are compared to what have been scanned in the reference and not vice versa. While not being detailed here, we note that the image form facilitates deriving normals effectively using the vector product computation.
2.3 Multi-resolution application
The panorama representation dictates a fixed resolution through-out the scans, while at times a site may be scanned in varying res-olutions as a means to maintain a fixed (more or less) point spac-ing in space. Nonetheless, a straight-forward multi-resolution analysis is made possible because of the point-based manner by which the change detection is applied. As for the reference data, each scan is represented in an individual panorama that is formed in its native resolution. This can be extended into multiple scans based analysis, yet again due to the fact that analyzed scans are transformed into the reference range panoramas. Hence, changes can be detected in scenes where each epoch is combined from multiple scans in multiple resolutions, and no further processing is needed.
2.4 Quantification of changes
The detection of changes in the proposed scheme enables catego-rizing whether a point has been indeed part of an actual change. However, the difference, be itεor ∆h, do not necessarily re-flect the physical modification the point has underwent. Fig. (2) demonstrates this and shows that even though a point has been identified as a change by being evaluated against a point on the cliff, the actual change relates to the ground. Therefore, a cor-respondence to the reference land-feature to which the point be-longs has to be applied, in order to quantify the actual change. For the land-features classification we use a data segmentation-based approach on the surface normals. The motivation for using such approach is twofold: i)the fact that land features tend to share a common orientation;ii)segmentation enables also sepa-rating the land features into consistent (up to a threshold) parts. In this context we can associate a point with a land feature, and then with the surface part to which it belongs.
Figure 2: Referencing a point that was classified as a change – a point in the analyzed scan has been identified as a change when evaluated against a point lying on the cliff, while in fact reflecting a change against the ground.
smooth-lows approaching the point-cloud segmentation as an image seg-mentation problem. As a segseg-mentation scheme, the Mean-Shift segmentation (Comaniciu and Meer, 2002) has been chosen as a platform due to its successful results with complex and cluttered images. As a non-parametric model, it requires neither model pa-rameters nor domain knowledge as inputs. The algorithm is con-trolled by only two dominant parameters: the sizes of spatial and the range dimensions of the kernel. The first affects the spatial neighborhood while the latter affects the permissible variability within the neighborhood. These two parameters are physical in a sense.
The segmentation makes use of derived surface normals. Its out-come should form a collection of 3D points that must adhere to two conditions: one that segments maintain geometrical connec-tivity among all points constituting it, and the other is that fea-tures of the connected set of points share some degree of similar-ity. Generally, the mean-shift clustering, on which the segmenta-tion process is based, is an iterative procedure, where each data point is “shifted” towards the centroids of its neighboring data points. The new value of the point is set as the mean,cj+1, by:
cj+1=
P
s∈S(cj)
w(cj−s)s
P
s∈S(cj)
w(cj−s)
(7)
withw()the weight attached to the vectors of the point, and jthe iteration index number. Convergence is reached when the centroids are no longer updated. The segmentation algorithm it-self is based on a derived filtering scheme beginning with feature vectors considered a cluster center. Using the update equation, an iterative convergence process into cluster centers is initialized. The pixel labels are set to the value of convergence. Then, neigh-boring regions sharing common values, up to the parameter de-fined for the range, are grouped together into a segment.
The coarsely segmented land-feature parts allow us to localize on the area to which the analyzed point belongs. This association facilitates then the evaluation of the actual change. For the local-ization a planar face is fitted to each of the segment. The fitted plane should minimize the following target function
n
X
i=1
~nxi+d= min s.t.||~n||= 1 (8)
with~n, the fitted plane normal,xipointi, of the segment pointset, anddis the offset of the plane from the origin along the normal direction. The projection of the evaluated point with respect to the evaluated land-feature part would be:
~
nTj ·x+dj=δj (9)
for segmentj. The point-to-segment association is decided by two criteria, the first is a minimal distance to the segment sur-face, namelyδj= minand the second is inclusion of the point in
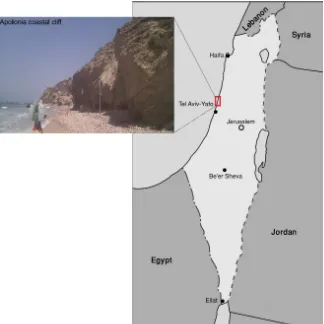
Figure 3: Study site: the Apollonia cliff along Israel’s coastline.
3 RESULTS AND DISCUSSION
The application of the proposed detection and characterization methodology is demonstrated on Israel’s eolianite coast cliff. This western coast cliff, situated at highly populated areas, is retreat-ing eastward in the last few decades at about0.2m/year, endan-gering infrastructure, private homes and cultural heritage sites (Perath and Almagor, 1996; Zviely and Klein, 2004; Ben-David, 2001; Katz et al., 2007; Katz, 2008). Effective assessment of the geomorphic processes of the cliff is vital for successful coastal management, contributes to wider analysis of coastal change and essential for furthering understanding of coastal geohazards, par-ticularly in relation to the underlying mechanisms which drive their development. We focus on a150m long cliff-stretch north of Herzliya (Apollonia coastal cliff, at32◦
11”N and34◦
48”E, Fig. (3)), where an extreme winter storm in December, 2010, triggered a failure of the cliff and analyzed the erosion and depo-sition processes that were initiated by the storm. Two terrestrial laser scans have been acquired using Leica ScanStation C10, be-fore and after the storm. In order to maintain fixed point-spacing, the cliff was scanned in various angular resolutions, ranging from
0.1◦
to0.05◦
.
The dynamic nature of the coastal environment, due to tidal con-ditions, imposed difficulties in setting a fixed geographic control network. Avoiding the need to georeference the scans, a regis-tration into a local reference frame which was based on planar faces of fixed manmade objects and natural distinctive points on the cliff itself was performed. A RMSE of8mm was obtained. Changes of down to the3cm level were detected (ε=3 cm).
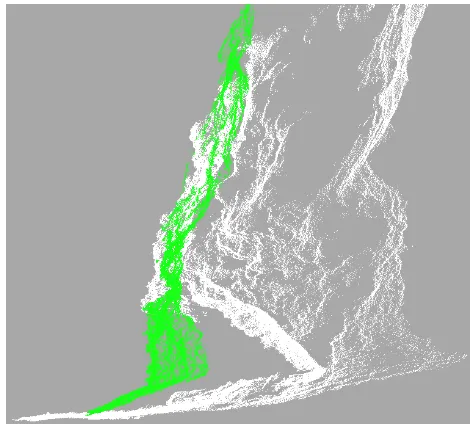
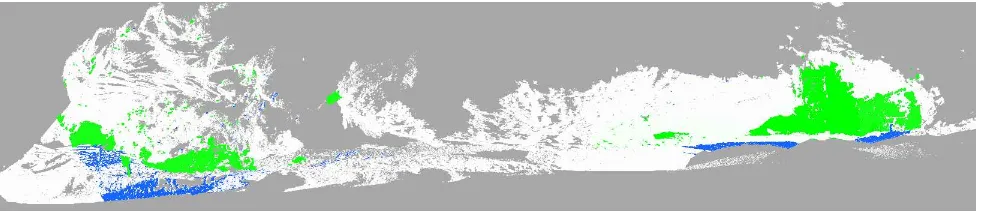
(a) Detected changes in panorama.
(b) Detected changes in point cloud.
Figure 4: Changes along the Apollonia coastal cliff.
Demonstration of the three-dimensional characterization and anal-ysis along different surface trends are shown in Figs. (5) and (6), presenting deposition and erosion between epochs, respectively, while Fig. (7) shows an overview of the entire study-site, in par-ticular the storm induced failure. Fig. (5) focus on part of the cliff where horizontal and vertical erosion can be observed, as well as changing magnitudes of change: at the top of the cliff there are small changes that are difficult to trace without designated range data, while at the bottom a new notch has been created.
Figure 5: Erosion on south-end of the study site, focus is on a new notch.
Figure 6: Deposition on north-end of the study site, focus is on a new terrace that was built.
4 SUMMARY AND CONCLUSIONS
This paper has demonstrated the feasibility of change detection with no imposition of external constraints for the detection of three-dimensional changes within complex topographic settings. It has shown that efficient solution to such complex features as varying scale across the scene, occlusion, and operation in multi-resolutions can be derived and successfully applied. As was shown, the transformation of the data to the viewing setup of the refer-ence scan, and the polar representation that was used, solve scale and occlusion problems in a natural way. The range subtraction of the points in the organized angular space provided a multi-scale analysis, not affected by the scanner position and the vary-ing scannvary-ing resolution. It has also shown that multi-scale objects appearing in different depths are successfully detected.
ACKNOWLEDGEMENTS
The authors would like to thank Dr. Amit Mushkin and Dr. Oded Katz from the Geological Survey of Israel for providing some of the data for the experiments.
REFERENCES
Abell´an, A., Jaboyedoff, M., Oppikofer, T. and Vilaplana, J., 2009. Detection of millimetric deformation using a terrestrial laser scanner: experiment and application to a rockfall event. Nat. Hazards Earth Syst. Sci 9, pp. 365–372.
Ben-David, R., 2001. Apolonia park, geological and geotechni-cal survey for the coastal cliff stability study. Technigeotechni-cal report, Israel Nature and National Parks Protection Authority. in He-brew.
Collins, B. and Sitar, N., 2008. Processes of coastal bluff erosion in weakly lithified sands, pacifica, california, usa. Geomor-phology 97(3), pp. 483–501.
Collins, B., Sitar, N. et al., 2011. Stability of steep slopes in ce-mented sands. Journal of Geotechnical and Geoenvironmental Engineering 137, pp. 43.
Du, J. and Teng, H., 2007. 3d laser scanning and gps technol-ogy for landslide earthwork volume estimation. Automation in construction 16(5), pp. 657–663.
Filin, S., Baruch, A., Morik, S., Avni, Y. and Marco, S., 2010. Characterization of land degradation processes using airborne laser scanning. In: International Archives of Photogrammetry, Remote Sensing and Spatial Information Sciences (IAPRS), Vol. XXXVIII, Part 8, Kyoto, Japan, pp. 883–888.
Katz, O., 2008. Controls on the retreat rate of the israeli coastal cliff and its estimated location at year 2100. In: 2008 Joint Meeting of The Geological Society of America, Soil Science Society of America, American Society of Agronomy, Crop Science Society of America, Gulf Coast Association of Ge-ological Societies with the Gulf Coast Section of SEPM.
Katz, O., Hecht, H., Petranker, G. and Almog, E., 2007. Retreat rate of the israeli coastal cliff and its estimated location at year 2100. Technical Report GSI/21/2007, Geological Survey of Israel, Jerusalem. (In Hebrew).
Kringer, K., Tusch, M., Geitner, C., Rutzinger, M., Wiegand, C. and Meil, G., 2009. Geomorphometric analyses of lidar digital terrain models as input for digital soil mapping. In: Proceed-ings of Geomorphometry 2009, pp. 74–81.
Lim, M., Petley, D. N., Rosser, N. J., Allison, R. J., Long, A. J. and Pybus, D., 2005. Combined digital photogrammetry and time-of-flight laser scanning for monitoring cliff evolution. The Photogrammetric Record 20(110), pp. 109–129.
Marques, F., Redweik, P., Matildes, R. and Santos, L., 2009. Low retreat rate sea cliff monitoring by photogrammetric methods. In: EGU General Assembly 2009, held 19-24 April, 2009 in Vienna, Austria http://meetings. copernicus. org/egu2009, p. 12222, Vol. 11, p. 12222.
Marques, F., Taborda, R. and Carreira, D., 2010. Sea cliff insta-bility hazard assessment at regional scale: a case study in the western coast of portugal. EGU General Assembly 2010, held 2-7 May, 2010 in Vienna, Austria, p. 14431 12, pp. 14431.
Milan, D. J., Heritage, G. L. and Hetherington, D., 2007. Appli-cation of a 3d laser scanner in the assessment of erosion and deposition volumes and channel change in a proglacial river. Earth Surface Processes and Landforms 32(11), pp. 1657– 1674.
Miller, P., Mills, J., Edwards, S., Bryan, P., Marsh, S., Mitchell, H. and Hobbs, P., 2008. A robust surface match-ing technique for coastal geohazard assessment and manage-ment. ISPRS Journal of Photogrammetry and Remote Sens-ing 63(5), pp. 529 – 542. Airborne laser scannSens-ing;Coastal management;Data-sets;Lidar;Surface matching;.
Olsen, M., Kuester, F., Chang, B., Hutchinson, T. et al., 2010. Terrestrial laser scanning-based structural damage assessment. Journal of Computing in Civil Engineering 24, pp. 264.
O’Neal, M. A. and Pizzuto, J. E., 2011. The rates and spatial patterns of annual riverbank erosion revealed through terres-trial laser-scanner surveys of the south river, virginia. Earth Surface Processes and Landforms 36(5), pp. 695–701.
Perath, I. and Almagor, G., 1996. Environmental risk along the sharon escarpment. Technical Report GSI/5/96, Geological Survey of Israel, Jerusalem.
Pietro, L. S., O’Neal, M. A. and Puleo, J. A., 2008. Developing terrestrial-lidar-based digital elevation models for monitoring beach nourishment performance. Journal of Coastal Research pp. 1555–1564.
Redweik, P., Marques, F. and Matildes, R., 2008. A strategy for detection and measurement of the cliff retreat in the coast of algarve (portugal) by photogrammetry. EARSeL eProceedings 7(2), pp. 92–104.
Rose, R. C. D. and Basher, L. R., 2011. Measurement of river bank and cliff erosion from sequential lidar and historical aerial photography. Geomorphology 126(1-2), pp. 132 – 147.
Rosser, N., Petley, D., Lim, M., Dunning, S. and Allison, R., 2005. Terrestrial laser scanning for monitoring the process of hard rock coastal cliff erosion. Quarterly Journal of Engineer-ing Geology and Hydrogeology 38(4), pp. 363–375.
Sch¨urch, P., Densmore, A. L., Rosser, N. J., Lim, M. and McArdell, B. W., 2011. Detection of surface change in com-plex topography using terrestrial laser scanning: application to the illgraben debris-flow channel. Earth Surface Processes and Landforms 36(14), pp. 1847–1859.
Woolard, J. W. and Colby, J. D., 2002. Spatial characterization, resolution, and volumetric change of coastal dunes using air-borne lidar: Cape hatteras, north carolina. Geomorphology 48(1-3), pp. 269 – 287.
Young, A., Guza, R., OReilly, W., Flick, R. and Gutierrez, R., 2011. Short-term retreat statistics of a slowly eroding coastal cliff. Nat. Hazards Earth Syst. Sci 11, pp. 205–217.
Zeibak, R. and Filin, S., 2007. Change detection via terrestrial laser scanning. International Archives of Photogrammetry and Remote Sensing 36(3/W52), pp. 430–435.