Quarterly GFS Fiscal Bulletin
July-September 2013
Quarterly Fiscal Bulletin
July-September 2013
Government Finance Statistics (GFS)
Executive Summary
At the end of September 2013, the General Government of Timor Leste (GGoTL),
including Petroleum
1and Donor Funds is running a net operating balance of
$2,338.4 million. Consequently it has a net lending capacity of $2,185.0 million
and is able to sustain its current level of operations.
1Without the Petroleum and Donor Funds, the GGoTL is running a net operating
deficit of $111.9 million. This highlights the fact that the government still relies on
the Petroleum Fund and on the use of the cash balance to finance its expenditures
and maintain its current level of operations.
Ministry of Finance National Directorate for Economic Policy
Quarterly Fiscal Bulletin June-Sep 2013 Page 2
1.
Revenues
By the end of the third quarter in 2013, total revenues for the GGoTL, Petroleum and Donor funds amount to $2,854.4 million. Non-oil revenues amount to $96.7 million1, oil revenues comprise the largest revenue category reaching $2,624.6 million and revenues from donors equal $133.1 million2.
1.1 Non-oil Revenues
Non-oil revenues are divided into taxes, grants and other revenues:
Non-oil taxes comprised 76% of non-oil revenues, reaching $73.1 million during the third quarter of 2013. Non-oil tax is divided into:
Taxes on income, profits and capital gains has slightly decreased by the end of the third quarter in 2013 ($26.9 million) compared to the same period in 2012 ($28.6 million). This has been due to a reduction in collection of withholding tax, which was only partly offset by an increase in corporate tax and individual income tax collection.
Taxes on goods and services are the major source of tax revenue, totalling $37.3 million, 8% higher than those collected by the end of the third quarter of 2012 ($34.4 million). This increase has been mostly due to the increase in the collection excise tax collection, which contrasted with the fall of sales throughout 2012 and 2013.
Taxes on international trade and transactions have reduced 6.3% compared to the same period in 2012, reaching $8.7 million in 2013. This is due to a decrease in the collection of import duties.
Other taxes reached $0.19 by the end of September 2013.
Other revenue stands at $23.6 million by the end of the third quarter in 2013, 5% lower than the $24.8 million incurred in the same period in 2012. The reduction in collections from electricity fees and charges is the main reasons behind this decrease.
1.2 Oil Revenues
Oil revenues are divided into:
Taxes collected by the end of the third quarter 2013 amount to $932.6 million, mostly due to taxes on income profits and capital gains.
Other revenue is the major revenue source for the Petroleum Fund, amounting to $1,692.1 million by the end of the third quarter in 2013.
1.3
Donor Fund Revenues
The Donor Fund incurs revenues through grants received from all development partners. At the 30th September 2013, this amount totals $133.1 million.
2.
Expenses
For the GGoTL, including the Petroleum and Donor Funds, expenses amount to $516.0 million at the end of the third quarter 2013. The GGoTL alone incurred most of these expenses throughout 2013, totalling $388.6 million. The Petroleum Fund incurred a significantly smaller amount of expenditures ($186.2 million). Finally the Donor Fund spent $121.2 million.
2.1 General Government Expenditures
Expenditure categories for GGoTL comprise:
1
$96.7 million is obtained by subtracting total oil grants ($180.0 million) from total domestic revenues ($276.7 million).
2
Quarterly Fiscal Bulletin June-Sep 2013 Page 3
Compensation of Employees has reached $98.1 million at the end of the third quarter in 2013, 12% higher than $87.7 million incurred for the same period in 2012.
Use of Goods & Services comprises the largest expenditure category (44% of total expenses) in September 2013. Its value has decreased 16% totalling $171.2 million, compared to the $203.9 million spent during the same period of 2012. This fall has been brought about mostly by reductions in fuel for generators and staff training overseas.
Grants total $1 million for the third quarter in 2013. These Grants correspond to contributions to quotas in international organizations which increased in 2013 compared to previous years.
Social benefits add up to $78.2 million throughout the first three quaters in 2013. This is 26% lower compared to the same period in 2012. In particular the Ministry of Social Solidarity reduced social transfers in 2013 compared to 2012, partly due to the unexpected natural disasters which occurred in 2012 and which required more emergency funds last year.
Other expenses reach $40.1 million compared to $39.9 million in 2012. This is mostly due to higher public grant expenditures.
2.2 Petroleum Fund Expenditures
Petroleum Fund expenses are determined by management costs and transfers to the GGoTL. Total expenses at the 30th September 2013 in this fund reach $186.2 million. Grants transferred to the GGoTL amount to 99% of total expenses, whilst the remaining 1% is management fees: by the 30th September 2013 $6.2 million correspond to management fees, whereas transfers to the GGoTL total $180 million.
2.3
Donor Fund Expenditures
expenses.3 The net operating balance is calculated as revenues minus expenses.At the end of September 2013, the General Government of Timor Leste (GGoTL), including Petroleum and Donor Funds is running a net operating balance of $2,338.4 million. However the government still relies on the Petroleum Fund and use of the cash balance to finance its expenditures and maintain its current level of operations4.
4.
Net Acquisition of Non-Financial Assets
Net Acquisition of Non-Fi a ial Assets e o ds t a sa tio s that ha ge GGoTL’s holdi gs of non-financial assets. It is broadly equivalent to capital expenditure as recorded in the Charter of Accounts in Timor Leste.
At the end of September 2013 total acquisition of financial assets stands at $153.4 million. The GGoTL has undergone net acquisition of non-financial assets worth $141.5 million (59% lower than the $344.7 million spent by the same date in 2012). The Petroleum Fund did not record any expense under this category and the Donor Fund spent $11.9 million.
3
In Timor Leste, Gross and Net Operating Balance are the same, as there is no inventory for depreciation of fixed capital to date.
4
Quarterly Fiscal Bulletin June-Sep 2013 Page 4
5.
Net Lending/Borrowing
Net Lending/Borrowing is total expenditure minus revenue. Net Lending in particular means the GGoTL (with the Petroleum and Donor Funds) is maintaining a strong financial position and has the capacity to invest those resources which are not being used in the economy.
The combination of total revenue (particularly oil revenue), expenditures and acquisition of non-financial assets make net lending for the GGoTL with the Petroleum and Donor Funds $2,185 million at the end of the third quarter in 2013.
6.
Net Acquisition of Financial Assets
Net a uisitio of fi a ial assets e o ds a i ease i gove e t’s holdi gs of fi a ial assets. Net lending in Timor Leste is being invested in financial assets ranging across shares, securities, deposits, cash and other equities, particularly within the Petroleum Fund.
During the first three quarters of 2013 net acquisition of financial assets for the GGoTL, Petroleum and Donor Funds is $2,530.6 million: -$253.4 million in the GGoTL and $2,784.1 million in the Petroleum Fund, as no financial assets were acquired within the Donor Fund. Total acquisition of financial assets is larger than net lending because it includes the unrealized market value of financial assets; which is recorded under Other Economic Flows and reaches $599.1 million at the end of September 2013. Moreover the reason for the negative value in net acquisition of financial assets for the GGoTL (without the Petroleum and Donor Funds), is that it requires a net borrowing of $253.4 and obtains it by withdrawing it from the CFTL cash balance (recorded under currency and deposits in the tables in the annex).
7.
Financial Conclusion
At the 30th September, the GGoTL including Petroleum and Donor Funds has a strong fiscal position with a net operating balance of $2,338.4 million and a net lending capacity of $2,185.0 million. Total net lending capacity is then being invested in financial assets. However, efforts must continue to ensure GGoTL5 maintains a stronger fiscal position without the Petroleum Fund. Increasing domestic non-oil revenues and constraining the growth in expense are two possibilities which the GGoTL can work towards to contribute to fiscal sustainability in coming years.
5
Quarterly Fiscal Bulletin June-Sep 2013 Page 5
Annex: Statement of Total Government Operations
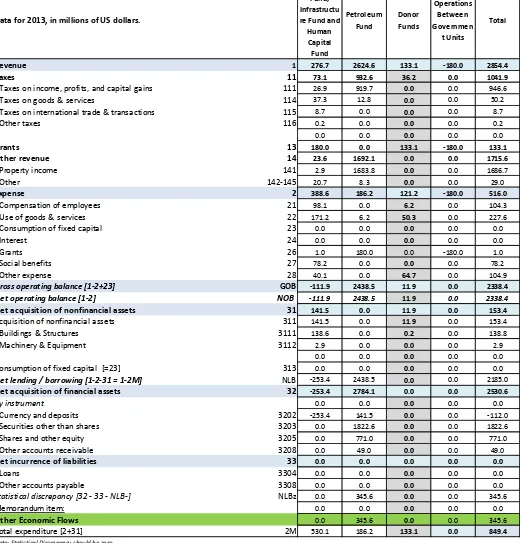
Figure 1. Accumulated Statement of Government Operations for the First Three Quarters in 2013
Data for 2013, in millions of US dollars.
Consildated
Revenue 1 276.7 2624.6 133.1 -180.0 2854.4
Taxes 11 73.1 932.6 36.2 0.0 1041.9
Taxes on income, profits, and capital gains 111 26.9 919.7 0.0 0.0 946.6
Taxes on goods & services 114 37.3 12.8 0.0 0.0 50.2
Taxes on international trade & transactions 115 8.7 0.0 0.0 0.0 8.7
Other taxes 116 0.2 0.0 0.0 0.0 0.2
0.0 0.0 0.0 0.0 0.0
Grants 13 180.0 0.0 133.1 -180.0 133.1
Other revenue 14 23.6 1692.1 0.0 0.0 1715.6
Property income 141 2.9 1683.8 0.0 0.0 1686.7
Other 142-145 20.7 8.3 0.0 0.0 29.0
Expense 2 388.6 186.2 121.2 -180.0 516.0
Compensation of employees 21 98.1 0.0 6.2 0.0 104.3
Use of goods & services 22 171.2 6.2 50.3 0.0 227.6
Consumption of fixed capital 23 0.0 0.0 0.0 0.0 0.0
Interest 24 0.0 0.0 0.0 0.0 0.0
Grants 26 1.0 180.0 0.0 -180.0 1.0
Social benefits 27 78.2 0.0 0.0 0.0 78.2
Other expense 28 40.1 0.0 64.7 0.0 104.9
Gross operating balance [1-2+23] GOB -111.9 2438.5 11.9 0.0 2338.4
Net operating balance [1-2] NOB -111.9 2438.5 11.9 0.0 2338.4
Net acquisition of nonfinancial assets 31 141.5 0.0 11.9 0.0 153.4
Acquisition of nonfinancial assets 311 141.5 0.0 11.9 0.0 153.4
Buildings & Structures 3111 138.6 0.0 0.2 0.0 138.8
Machinery & Equipment 3112 2.9 0.0 0.0 0.0 2.9
0.0 0.0 0.0 0.0 0.0
Consumption of fixed capital [=23] 313 0.0 0.0 0.0 0.0 0.0
Net lending / borrowing [1-2-31 = 1-2M] NLB -253.4 2438.5 0.0 0.0 2185.0
Net acquisition of financial assets 32 -253.4 2784.1 0.0 0.0 2530.6
by instrument 0.0 0.0 0.0 0.0 0.0
Currency and deposits 3202 -253.4 141.5 0.0 0.0 -112.0
Securities other than shares 3203 0.0 1822.6 0.0 0.0 1822.6
Shares and other equity 3205 0.0 771.0 0.0 0.0 771.0
Other accounts receivable 3208 0.0 49.0 0.0 0.0 49.0
Net incurrence of liabilities 33 0.0 0.0 0.0 0.0 0.0
Loans 3304 0.0 0.0 0.0 0.0 0.0
Other accounts payable 3308 0.0 0.0 0.0 0.0 0.0
Statistical discrepancy [32 - 33 - NLB-] NLBz 0.0 345.6 0.0 0.0 345.6
Memorandum item: 0.0 0.0 0.0 0.0 0.0
Other Economic Flows 0.0 345.6 0.0 0.0 345.6
Total expenditure [2+31] 2M 530.1 186.2 133.1 0.0 849.4
Note: Statistical Discrepancy should be zero.
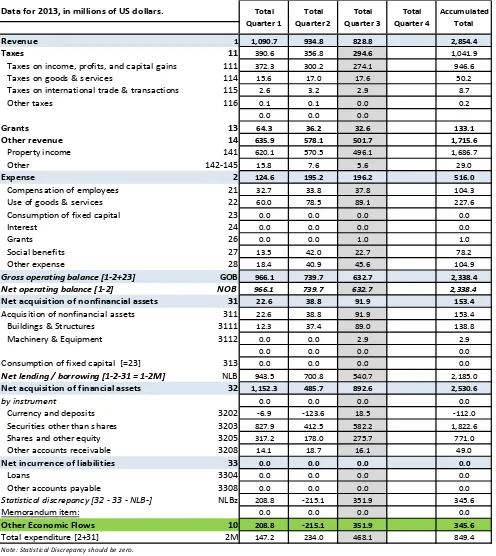
Quarterly Fiscal Bulletin June-Sep 2013 Page 6 Figure 2. Statement of government operations until the 3rd quarter 2013- Timor Leste (GGoTL, Petroleum and Donor Funds)
Data for 2013, in millions of US dollars.
Revenue 1 1,090.7 934.8 828.8 2,854.4
Taxes 11 390.6 356.8 294.6 1,041.9
Taxes on income, profits, and capital gains 111 372.3 300.2 274.1 946.6
Taxes on goods & services 114 15.6 17.0 17.6 50.2
Taxes on international trade & transactions 115 2.6 3.2 2.9 8.7
Other taxes 116 0.1 0.1 0.0 0.2
0.0 0.0 0.0
Grants 13 64.3 36.2 32.6 133.1
Other revenue 14 635.9 578.1 501.7 1,715.6
Property income 141 620.1 570.5 496.1 1,686.7
Other 142-145 15.8 7.6 5.6 29.0
Expense 2 124.6 195.2 196.2 516.0
Compensation of employees 21 32.7 33.8 37.8 104.3
Use of goods & services 22 60.0 78.5 89.1 227.6
Consumption of fixed capital 23 0.0 0.0 0.0 0.0
Interest 24 0.0 0.0 0.0 0.0
Grants 26 0.0 0.0 1.0 1.0
Social benefits 27 13.5 42.0 22.7 78.2
Other expense 28 18.4 40.9 45.6 104.9
Gross operating balance [1-2+23] GOB 966.1 739.7 632.7 2,338.4
Net operating balance [1-2] NOB 966.1 739.7 632.7 2,338.4
Net acquisition of nonfinancial assets 31 22.6 38.8 91.9 153.4
Acquisition of nonfinancial assets 311 22.6 38.8 91.9 153.4
Buildings & Structures 3111 12.3 37.4 89.0 138.8
Machinery & Equipment 3112 0.0 0.0 2.9 2.9
0.0 0.0 0.0 0.0
Consumption of fixed capital [=23] 313 0.0 0.0 0.0 0.0
Net lending / borrowing [1-2-31 = 1-2M] NLB 943.5 700.8 540.7 2,185.0
Net acquisition of financial assets 32 1,152.3 485.7 892.6 2,530.6
by instrument 0.0 0.0 0.0 0.0
Currency and deposits 3202 -6.9 -123.6 18.5 -112.0
Securities other than shares 3203 827.9 412.5 582.2 1,822.6
Shares and other equity 3205 317.2 178.0 275.7 771.0
Other accounts receivable 3208 14.1 18.7 16.1 49.0
Net incurrence of liabilities 33 0.0 0.0 0.0 0.0
Loans 3304 0.0 0.0 0.0 0.0
Other accounts payable 3308 0.0 0.0 0.0 0.0
Statistical discrepancy [32 - 33 - NLB-] NLBz 208.8 -215.1 351.9 345.6
Memorandum item: 0.0 0.0 0.0 0.0
Other Economic Flows 10 208.8 -215.1 351.9 345.6
Total expenditure [2+31] 2M 147.2 234.0 468.1 849.4
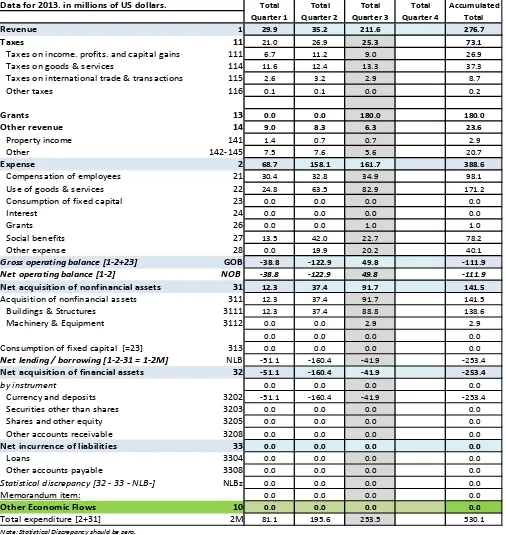
Quarterly Fiscal Bulletin June-Sep 2013 Page 7 Data for 2013. in millions of US dollars.
Revenue 1 29.9 35.2 211.6 276.7
Taxes 11 21.0 26.9 25.3 73.1
Taxes on income. profits. and capital gains 111 6.7 11.2 9.0 26.9
Taxes on goods & services 114 11.6 12.4 13.3 37.3
Taxes on international trade & transactions 115 2.6 3.2 2.9 8.7
Other taxes 116 0.1 0.1 0.0 0.2
Grants 13 0.0 0.0 180.0 180.0
Other revenue 14 9.0 8.3 6.3 23.6
Property income 141 1.4 0.7 0.7 2.9
Other 142-145 7.5 7.6 5.6 20.7
Expense 2 68.7 158.1 161.7 388.6
Compensation of employees 21 30.4 32.8 34.9 98.1
Use of goods & services 22 24.8 63.5 82.9 171.2
Consumption of fixed capital 23 0.0 0.0 0.0 0.0
Interest 24 0.0 0.0 0.0 0.0
Grants 26 0.0 0.0 1.0 1.0
Social benefits 27 13.5 42.0 22.7 78.2
Other expense 28 0.0 19.9 20.2 40.1
Gross operating balance [1-2+23] GOB -38.8 -122.9 49.8 -111.9
Net operating balance [1-2] NOB -38.8 -122.9 49.8 -111.9
Net acquisition of nonfinancial assets 31 12.3 37.4 91.7 141.5
Acquisition of nonfinancial assets 311 12.3 37.4 91.7 141.5
Buildings & Structures 3111 12.3 37.4 88.8 138.6
Machinery & Equipment 3112 0.0 0.0 2.9 2.9
0.0 0.0 0.0 0.0
Consumption of fixed capital [=23] 313 0.0 0.0 0.0 0.0
Net lending / borrowing [1-2-31 = 1-2M] NLB -51.1 -160.4 -41.9 -253.4
Net acquisition of financial assets 32 -51.1 -160.4 -41.9 -253.4
by instrument 0.0 0.0 0.0 0.0
Currency and deposits 3202 -51.1 -160.4 -41.9 -253.4
Securities other than shares 3203 0.0 0.0 0.0 0.0
Shares and other equity 3205 0.0 0.0 0.0 0.0
Other accounts receivable 3208 0.0 0.0 0.0 0.0
Net incurrence of liabilities 33 0.0 0.0 0.0 0.0
Loans 3304 0.0 0.0 0.0 0.0
Other accounts payable 3308 0.0 0.0 0.0 0.0
Statistical discrepancy [32 - 33 - NLB-] NLBz 0.0 0.0 0.0 0.0
Memorandum item: 0.0 0.0 0.0 0.0
Other Economic Flows 10 0.0 0.0 0.0 0.0
Total expenditure [2+31] 2M 81.1 195.6 253.5 530.1
Note: Statistical Discrepancy should be zero.
Accumulated Statement of Goverment Operations for the GGoTL
Consumption of fixed capital will have to be calculated from inventory
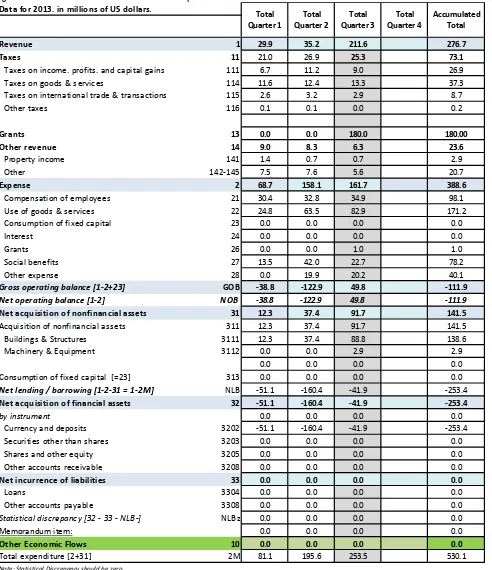
Quarterly Fiscal Bulletin June-Sep 2013 Page 8 Figure 4. Accumulated Statement of Government Operation for the GGoTL
Data for 2013. in millions of US dollars.
Revenue 1 29.9 35.2 211.6 276.7
Taxes 11 21.0 26.9 25.3 73.1
Taxes on income. profits. and capital gains 111 6.7 11.2 9.0 26.9
Taxes on goods & services 114 11.6 12.4 13.3 37.3
Taxes on international trade & transactions 115 2.6 3.2 2.9 8.7
Other taxes 116 0.1 0.1 0.0 0.2
Grants 13 0.0 0.0 180.0 180.00
Other revenue 14 9.0 8.3 6.3 23.6
Property income 141 1.4 0.7 0.7 2.9
Other 142-145 7.5 7.6 5.6 20.7
Expense 2 68.7 158.1 161.7 388.6
Compensation of employees 21 30.4 32.8 34.9 98.1
Use of goods & services 22 24.8 63.5 82.9 171.2
Consumption of fixed capital 23 0.0 0.0 0.0 0.0
Interest 24 0.0 0.0 0.0 0.0
Grants 26 0.0 0.0 1.0 1.0
Social benefits 27 13.5 42.0 22.7 78.2
Other expense 28 0.0 19.9 20.2 40.1
Gross operating balance [1-2+23] GOB -38.8 -122.9 49.8 -111.9
Net operating balance [1-2] NOB -38.8 -122.9 49.8 -111.9
Net acquisition of nonfinancial assets 31 12.3 37.4 91.7 141.5
Acquisition of nonfinancial assets 311 12.3 37.4 91.7 141.5
Buildings & Structures 3111 12.3 37.4 88.8 138.6
Machinery & Equipment 3112 0.0 0.0 2.9 2.9
0.0 0.0 0.0 0.0
Consumption of fixed capital [=23] 313 0.0 0.0 0.0 0.0
Net lending / borrowing [1-2-31 = 1-2M] NLB -51.1 -160.4 -41.9 -253.4
Net acquisition of financial assets 32 -51.1 -160.4 -41.9 -253.4
by instrument 0.0 0.0 0.0 0.0
Currency and deposits 3202 -51.1 -160.4 -41.9 -253.4
Securities other than shares 3203 0.0 0.0 0.0 0.0
Shares and other equity 3205 0.0 0.0 0.0 0.0
Other accounts receivable 3208 0.0 0.0 0.0 0.0
Net incurrence of liabilities 33 0.0 0.0 0.0 0.0
Loans 3304 0.0 0.0 0.0 0.0
Other accounts payable 3308 0.0 0.0 0.0 0.0
Statistical discrepancy [32 - 33 - NLB-] NLBz 0.0 0.0 0.0 0.0
Memorandum item: 0.0 0.0 0.0 0.0
Other Economic Flows 10 0.0 0.0 0.0 0.0
Total expenditure [2+31] 2M 81.1 195.6 253.5 530.1
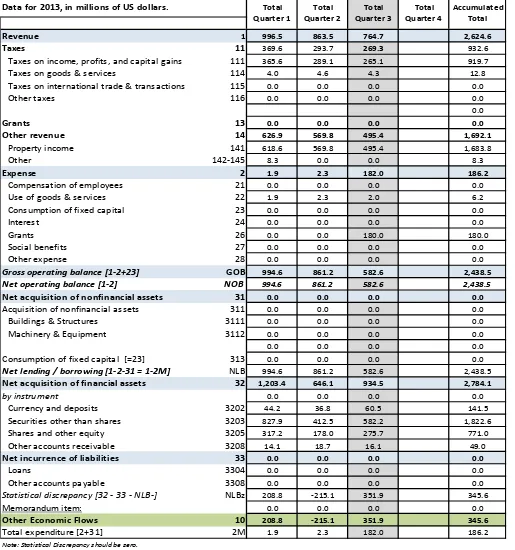
Quarterly Fiscal Bulletin June-Sep 2013 Page 9 Figure 5. Accumulated statement of government operation for the Petroleum Fund
Data for 2013, in millions of US dollars.
Revenue 1 996.5 863.5 764.7 2,624.6
Taxes 11 369.6 293.7 269.3 932.6
Taxes on income, profits, and capital gains 111 365.6 289.1 265.1 919.7
Taxes on goods & services 114 4.0 4.6 4.3 12.8
Taxes on international trade & transactions 115 0.0 0.0 0.0 0.0
Other taxes 116 0.0 0.0 0.0 0.0
0.0
Grants 13 0.0 0.0 0.0 0.0
Other revenue 14 626.9 569.8 495.4 1,692.1
Property income 141 618.6 569.8 495.4 1,683.8
Other 142-145 8.3 0.0 0.0 8.3
Expense 2 1.9 2.3 182.0 186.2
Compensation of employees 21 0.0 0.0 0.0 0.0
Use of goods & services 22 1.9 2.3 2.0 6.2
Consumption of fixed capital 23 0.0 0.0 0.0 0.0
Interest 24 0.0 0.0 0.0 0.0
Grants 26 0.0 0.0 180.0 180.0
Social benefits 27 0.0 0.0 0.0 0.0
Other expense 28 0.0 0.0 0.0 0.0
Gross operating balance [1-2+23] GOB 994.6 861.2 582.6 2,438.5
Net operating balance [1-2] NOB 994.6 861.2 582.6 2,438.5
Net acquisition of nonfinancial assets 31 0.0 0.0 0.0 0.0
Acquisition of nonfinancial assets 311 0.0 0.0 0.0 0.0
Buildings & Structures 3111 0.0 0.0 0.0 0.0
Machinery & Equipment 3112 0.0 0.0 0.0 0.0
0.0 0.0 0.0 0.0
Consumption of fixed capital [=23] 313 0.0 0.0 0.0 0.0
Net lending / borrowing [1-2-31 = 1-2M] NLB 994.6 861.2 582.6 2,438.5
Net acquisition of financial assets 32 1,203.4 646.1 934.5 2,784.1
by instrument 0.0 0.0 0.0 0.0
Currency and deposits 3202 44.2 36.8 60.5 141.5
Securities other than shares 3203 827.9 412.5 582.2 1,822.6
Shares and other equity 3205 317.2 178.0 275.7 771.0
Other accounts receivable 3208 14.1 18.7 16.1 49.0
Net incurrence of liabilities 33 0.0 0.0 0.0 0.0
Loans 3304 0.0 0.0 0.0 0.0
Other accounts payable 3308 0.0 0.0 0.0 0.0
Statistical discrepancy [32 - 33 - NLB-] NLBz 208.8 -215.1 351.9 345.6
Memorandum item: 0.0 0.0 0.0 0.0
Other Economic Flows 10 208.8 -215.1 351.9 345.6
Total expenditure [2+31] 2M 1.9 2.3 182.0 186.2
Quarterly Fiscal Bulletin June-Sep 2013 Page 10 Figure6. Accumulated statement of government operation for the Donors Fund
Data for 2013, in millions of US dollars.
Revenue 1 64.3 36.2 32.6 133.1
Taxes 11 0.0 36.2 0.0 36.2
Taxes on income, profits, and capital gains 111 0.0 0.0 0.0 0.0
Taxes on goods & services 114 0.0 0.0 0.0 0.0
Taxes on international trade & transactions 115 0.0 0.0 0.0 0.0
Other taxes 116 0.0 0.0 0.0 0.0
0.0
Grants 13 64.3 36.2 32.6 133.1
Other revenue 14 0.0 0.0 0.0 0.0
Property income 141 0.0 0.0 0.0 0.0
Other 142-145 0.0 0.0 0.0 0.0
Expense 2 54.0 34.8 32.4 121.2
Compensation of employees 21 2.2 1.0 2.9 6.2
Use of goods & services 22 33.4 12.8 4.1 50.3
Consumption of fixed capital 23 0.0 0.0 0.0 0.0
Interest 24 0.0 0.0 0.0 0.0
Grants 26 0.0 0.0 0.0 0.0
Social benefits 27 0.0 0.0 0.0 0.0
Other expense 28 18.4 21.0 25.3 64.7
Gross operating balance [1-2+23] GOB 10.3 1.4 0.2 11.9
Net operating balance [1-2] NOB 10.3 1.4 0.2 11.9
Net acquisition of nonfinancial assets 31 10.3 1.4 0.2 11.9
Acquisition of nonfinancial assets 311 10.3 1.4 0.2 11.9
Buildings & Structures 3111 0.0 0.0 0.2 0.2
Machinery & Equipment 3112 0.0 0.0 0.0 0.0
0.0 0.0 0.0 0.0
Consumption of fixed capital [=23] 313 0.0 0.0 0.0 0.0
Net lending / borrowing [1-2-31 = 1-2M] NLB 0.0 0.0 0.0 0.0
Net acquisition of financial assets 32 0.0 0.0 0.0 0.0
by instrument 0.0 0.0 0.0 0.0
Currency and deposits 3202 0.0 0.0 0.0 0.0
Securities other than shares 3203 0.0 0.0 0.0 0.0
Shares and other equity 3205 0.0 0.0 0.0 0.0
Other accounts receivable 3208 0.0 0.0 0.0 0.0
Net incurrence of liabilities 33 0.0 0.0 0.0 0.0
Loans 3304 0.0 0.0 0.0 0.0
Other accounts payable 3308 0.0 0.0 0.0 0.0
Statistical discrepancy [32 - 33 - NLB] NLBz 0.0 0.0 0.0 0.0
Memorandum item: 0.0 0.0 0.0 0.0
Other Economic Flows 10 0.0 0.0 0.0 0.0
Total expenditure [2+31] 2M 64.3 36.2 32.6 133.1
Quarterly Fiscal Bulletin June-Sep 2013 Page 11
Key Terminology
Compensation of employees are remuneration in cash or kind, payable to an employee in return for work done and social insurance contributions made by a general government unit on behalf of its employees. Compensation of employees is incurred on a monthly basis in Timor Leste.
Expenses include all transactions that decrease the net worth of the general government sector. Expenditures are financed from the ESI, excess withdrawals from the Petroleum Fund, loans or the use of cash balance.
General Government of Timor Leste is the combination of the Consolidated Fund (CFTL), Human Capital and Development Fund (HCDF) and the Infrastructure Fund in Timor Leste.
Grants: are non-compulsory current or capital transfers from one government unit to another government unit or an international organization. These are divided into estimated sustainable income (ESI) and excess withdrawals.
Gross Operating Balance is the revenue minus expenses other than consumption of fixed capital. It indicates whether the government is able to sustain its current level of operations and ideally should portray a surplus. However consumption of fixed capital is not measured in Timor Leste, therefore Gross Operating Balance is equal to Net Operating Balance.
Net lending/borrowing is a balancing item defined as the net acquisition of all financial assets less the net incurrence of all liabilities from transactions. It is thus a summary measure indicating the extent to which GGoTL is either putting financial resources at the disposal of other sectors in the economy or utilizing the financial resources generated by other sectors.
Net Operating Balance is equal to revenue minus expenses and indicates whether the government is able to sustain its current level of operations.
Other Revenue includes a variety of forms of revenue earned by GGoTL including property income, sales of goods, fines & penalties and other miscellaneous revenue.
Revenues are all transactions that increase the net worth of general government sector and exclude domestic and external borrowing. Revenues tend to increase during the last period of the year, due to the collection of accumulated taxes.
Social benefits are current transfers to households to provide for needs arising from events such as sickness, unemployment, retirement, housing or family circumstances.
Taxes on goods & services are taxes levied on the production, extraction, sale, transfer, leasing or delivery of goods and rendering of services.
Taxes on income, profits, and capital gains are composed of corporate taxes in Timor Leste.
Taxes on international trade & transactions include sales tax and other import duties in Timor Leste.
Transactions in financial assets and liabilities record financial transactions. I.e. they record transactions that change a
gove e t’s holdi gs of fi a ial assets a d lia ilities. I Ti o Leste fi a ial assets a e all o posed of u e y a d
Quarterly Fiscal Bulletin June-Sep 2013 Page 12
Transactions in nonfinancial assets and liabilities e o d t a sa tio s that ha ge a gove e t’s holdi gs of nonfinancial assets. In Timor Leste these assets are classified as Buildings & Structures and Machinery & Equipment.