Contact:
Equity & Index Valuation Division Phone: (6221) 7884 0200
“Disclaimer statement in the last page is an integral part of this report”
Source: Bloomberg, PEFINDO Research & Consulting - Equity & Index Valuation Division
Stock Information IDR
Ticker code SMSM
Market price as of December 21, 2015 4,850 Market price – 52 week high 5,175
Source:PT Selamat Sempurna Tbk, PEFINDO Research & Consulting - Equity & Index Valuation Division
Stock Valuation Last Current reputable group with main business activities of production and distribution of automotive parts or components. Supported by a sizeable installed
the Company’s revenue. The Company, since few years ago, has developed
“Disclaimer statement in the last page is an integral part of this report” www.pefindo-consulting.co.id
`
Selamat Sempurna, Tbk
Global auto sales to grow moderately
We expect global economy to recover in 2016, growing by 3.6% vs. 3.1% in 2015, based on IMF projection. However, the global economy will face a challenge from the resurgence of central banks’ divergence policies, mainly in emerging markets. Emerging market, with its structural frailties remaining largely unrepaired, remains vulnerable to the U.S. tightening monetary policy, while China’s economy has still been decelerating. Following global economy recovery expectation, global auto sales in 2016 is estimated to grow moderately, better than in 2015. Based on Moody’s estimate, global auto sales will rebound modestly and grow by 5.1% and 4.7% for 2016 and 2017, respectively, up from only 2.1% in 2015. The growth will be mainly underpinned by a steady sales growth in U.S., West Europe, and India markets. However, we will still see some slowdown in China and Japan.
Sluggish domestic car sales, but will improve eventually
Domestic car sales performance has been sluggish, which will continue into the end of 2015. Up to November 2015, the car sales has dropped by 16.6% YoY, to 941,008 units, which, if annualized, will be below last year’s performance of 1.2 million units. We expect sales for 2016 to rise moderately in line with the improving expectation of domestic economy. As the current administration has been focused on increasing the quality of state budget, accelerating infrastructures projects as well as reforming policies and regulations to stimulate trade and investment, we are of view that the economy is going to grow faster in 2016. However, the risk of achieving the economic growth target of 5.3% is looming, on the back of uncertain recovery of global economy and slowdown in China, the world’s economic powerhouse.
Overseas acquisition, strengthening regional foothold
SMSM just acquired Bradke Synergies Sdn Bhd (Bradke), a holding company with subsidiaries engaging in filters manufacture, machineries supplier to SMSM, as well as
sole distributor of SMSM’s filters both in Malaysian and Australian market. Bradke is a Malaysian-based company, which was acquired at IDR220 billion. SMSM has a long unfavorable market conditions recently. We like SMSM for its ability to keep its gross margin stable, post the acquisition of Bradke, at 29.7% for 9M2015. Further, EBITDA and net income margins expanded to 26.6% and 16.0%, respectively. Its balance sheet has also become stronger with the equity footing and total assets growing faster than has its debt stock. As a result, the leverage has decreased with net gearing of 0.11x as at 9M2015, from 0.16x at end 2014. We expect SMSM’s balance sheet will continue to be stronger with its integrated business model.
Business prospects
We are confident about SMSM’s growth prospect in the future. It has demonstrated steady growth over the past years and has taken relentless measures to extend its product line to penetrate market. Its penetration in global market into hundreds of destinations has been successful and has now started establishing foothold in the regional market through acquisition. With such track record, we believe SMSM will be able to tap more opportunities both in global and domestic markets.
Table 1: Performance Summary
Source: PT Selamat Sempurna Tbk, PEFINDO Research & Consulting - Equity & Index Valuation Division
“Disclaimer statement in the last page is an integral part of this report” www.pefindo-consulting.co.id
`
Selamat Sempurna, Tbk
Global and domestic economies expected to rebound
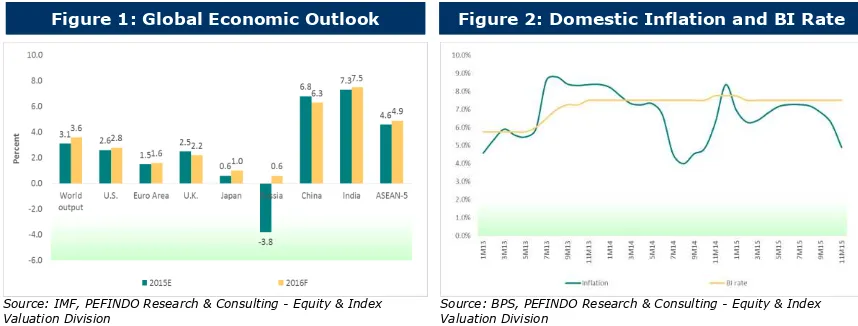
IMF has a forecast for global economy of 3.6% growth next year while it only predicted 3.1% for 2015. IMF also forecasts the emerging markets’ GDP growth on average basis to pick up to 4.5% in 2016 vs. 3.9% of 2015’s forecast. However, the
fund’s growth forecast was actually lower than its forecast released in July 2015 of 3.8% for the growth rate of global economy.
In 2016, we could expect to see some shifting in the dynamics of global economy. On one camp, the U.S. central bank will gradually tighten its monetary policy, followed by U.K. central bank. On the other camp, European, Japan, and China central banks will continue their monetary easing program. However, the growth prospect of global economy will still see some challenges coming from emerging markets, since structural frailties in this part of the world remain largely unrepaired. The China’s economy, the largest emerging market, is in the state of decelerating, while for average emerging markets they will still have to deal with soft export sales and tax receipt, surging debt level and rising non-performing loans. The emerging markets have also to minimize the impact of U.S. tightening monetary policy may have on their currency exchange volatility and interest rate level.
For the domestic economy, we expect a moderate rebound in 2016. As the current administration has been focused on improving the quality of state budget to attain to more equitable development, accelerating the development of infrastructure, as well as reforming and removing impeding regulations in the areas of trade and investment, the economy will start to enjoy benefit from such policy implementation and hence bring prospect to rebound next year. On the other hand, we see some room for Bank Indonesia to bring down the policy (BI) rate by 25 bps, in line with a manageable inflation rate (4.5%-5%). This year, the inflation is estimated to stay around 3%, a new record low since 2009.
Figure 1: Global Economic Outlook Figure 2: Domestic Inflation and BI Rate
Source: IMF, PEFINDO Research & Consulting - Equity & Index
Valuation Division Source: BPS, PEFINDO Research & Consulting - Equity & Index Valuation Division
Moderate growth for global and domestic automotive market
Global auto sales is estimated to grow moderately in 2016. Based on Moody’s estimate, global auto sales is to rebound modestly and grow by 5.1% and 4.7% in 2016 and 2017, respectively, up from only 2.1% in 2015. Global sales growth will be supported from steady sales in U.S., West Europe, and India, but there will be slowdown in China and Japan markets. However, we still expect the China market to continue to take a significant share in global auto sales. Sales in U.S. and West
Domestic car sales up to November 2015 recorded 941,008 units or a drop by 16.6% from last year. This condition carries over from last year when sales was practically stagnant as a result of the slowing economy, sharp weakening of Rupiah against the greenback, and reduced purchasing power. Accordingly, this year’s car sales will end up below last year’s 1.2 million units. Sales for 2016 is expected to rise moderately in line with an improving expectation of faster economic growth (in the enacted 2016 state budget law, the growth is set at 5.3%). However, the risk of achieving the set target remains looming as the economy is still susceptible to the volatility of global economy.
“Disclaimer statement in the last page is an integral part of this report” www.pefindo-consulting.co.id
`
Selamat Sempurna, Tbk
Meanwhile, on the export side, the auto sales is estimated to increase by 15% in 2016 from 2015’s estimate of 220k units. The completion of factory expansion by Japanese car makers such as Toyota, Suzuki, Mitsubishi, Honda, and Daihatsu that utilizes the additional capacity as export base. Export market share has now reached about 19% of national production volume. For 2015, up to September, export sales booked double digit growth of 10.8% YoY.
Figure 3: Global Auto Sales Figure 4: Domestic Car Sales
Source: Global Auto Report, PEFINDO Research & Consulting - Equity
& Index Valuation Division Source: Gaikindo, PEFINDO Research & Consulting - Equity & Index Valuation Division
Bradke acquisition, overseas expansion
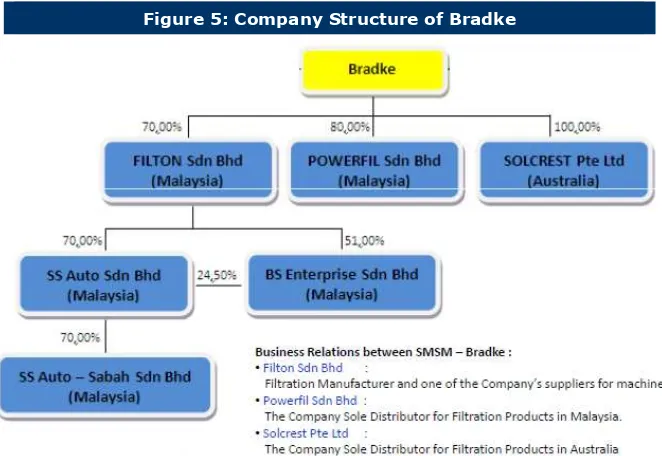
At the end of 1H2015 SMSM acquired Bradke Synergies Sdn Bhd (Bradke), a company based in Malaysia, at an acquisition value of IDR220 billion for 100% ownership. Bradke is a holding company with subsidiaries engaging in filter manufacture,
machineries supplier to SMSM, as well as sole distributor of SMSM’s filters both in Malaysia and Australia. Prior to this acquisition, SMSM has acquired its sister companies to be consolidated. However, we see that SMSM already has a close relationship with the acquired company, as Bradke, through its subsidiaries, is SMSM’s sole distributor for filter products in Malaysia and Australia. With the acquisition, SMSM has firmed up vertical business integration and expanded its production base to serve the region. This will be positive for SMSM as it will benefit from the implementation of ASEAN Economic Community (AEC). Bradke is believed to give positive contribution, business and financial wise, to SMSM in particular from the distribution business conducted by Bradke’s subsidiaries, Powerfil Sdn Bhd (Malaysia) and Solcrest Pte Ltd (Australia).
Figure 5: Company Structure of Bradke
“Disclaimer statement in the last page is an integral part of this report” www.pefindo-consulting.co.id
`
Selamat Sempurna, Tbk
Table 2. Bradke Financial Performance
MYR million 2012 2013 2014
Net sales 116.8 116.6 117.5
Growth -0.2% 0.8%
Operating profit 17.9 17.1 17.5
Margin 15.3% 14.6% 14.9%
Net profit 12.2 9.1 12.1
Margin 10.4% 7.8% 10.3%
Current asset 59.3 65.3 60.0
Total asset 115.7 120.3 113.5
Current liabilities 28.3 33.1 24.5
Total liabilities 48.4 53.4 41.5
Equity 67.3 66.9 72.0
Liabilities to equity (x) 0.72 0.80 0.58
Source: PT Selamat Sempurna Tbk, PEFINDO Research & Consulting - Equity & Index Valuation Division
Positive outcomes from U.S., Asia, and domestic markets
SMSM’s export sales grew moderately by 4.9% YoY for 9M2015, dragged by the declining sales in Europe that dropped by 14.5% YoY. The sales drop in Europe was primarily attributable to three countries, Russia (-55% YoY), Germany (-21% YoY) and Netherlands (-15% YoY). U.S. remains the largest single market for SMSM and saw a double digit growth, 10.5% YoY, amidst slow recovery of the economy. Meanwhile, sales to Asian region (ex Indonesia) was able to offset the declining sales to Europe. Asian region booked sales growth of 13.8% YoY with Japan, Thailand, Myanmar, and Philippines as the growth engine, where in those countries the growth rate ranged from 36% to 113% YoY. China, however, remains promising as export sales to China rose by 14.7% YoY for 9M2015 and recorded the fourth largest sales in Asian region. On the other hand, in domestic market, SMSM was able to post growth at 7.2% YoY, better than overall export sales growth. Product wise, filters are the main growth driver, while the sales of other products have been adversely impacted by the sluggish domestic automotive market.
Figure 6: Revenue in 9M2014 and 9M2015
Source: PT Selamat Sempurna Tbk, PEFINDO Research & Consulting - Equity & Index Valuation Division
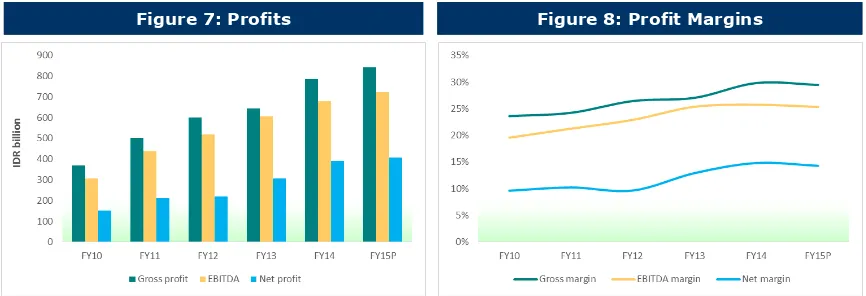
Profitability to improve
“Disclaimer statement in the last page is an integral part of this report” www.pefindo-consulting.co.id
`
Selamat Sempurna, Tbk
have steadily expanded. We are also optimistic that the recent acquisition made by SMSM will bring positive impact to the overall business and its profitability on the back of integration story and improving efficiency.
Figure 7: Profits Figure 8: Profit Margins
Source: PT Selamat Sempurna Tbk, PEFINDO Research & Consulting -
Equity & Index Valuation Division Source: PT Steel Pipe Industry of Indonesia Tbk, PEFINDO Research & Consulting - Equity & Index Valuation Division
Stronger balance sheet
Post the acquisition of Bradke, SMSM’s balance sheet has become stronger with its equity and total assets growing faster than has its debt stock. Based on 9M2015’s position vs. FY14’s position, the Company’s capitalization and total assets grew by 29% and 33%, respectively, vs. the increase by 14% in debt level. As a result, the
Company’s net gearing ratio improved to 0.11x for 9M2015 from 0.16x for FY14. Further, its interest coverage ratio has also improved as the EBITDA-to-interest ratio rose significantly to 27.8x vs. 23.8x in FY14. SMSM has paid off its outstanding bond issued in 2010 and now it uses only bank loan as source of borrowing.
We also like SMSM for its liquidity measures as at 9M2015. Post the acquisition of
Bradke, SMSM’s cash position increased by 80% in 9M2015 vs. FY14’s. We thus
expect SMSM’s balance sheet to continue going stronger, supported by its integrated business model.
Figure 9: Net Debt-to-Equity Ratio and Debt-to-EBITDA Ratio
Figure 10: EBITDA-to-Interest Ratio and EBITDA-to-Debt Ratio
Source: PT Selamat Sempurna Tbk, PEFINDO Research & Consulting -
“Disclaimer statement in the last page is an integral part of this report” www.pefindo-consulting.co.id
`
Selamat Sempurna, Tbk
Table 3: Performance of SMSM and Its Peers in 9M2015
SMSM AUTO INDS
Revenue [IDR bn] 2,042 8,670 1,205
Gross profit [IDR bn] 605 1,265 132
Before tax profit [IDR bn] 445 232 (6)
Net profit [IDR bn] 333 179 (5)
Total asset [IDR bn] 2,329 14,591 2,411
Total liabilities [IDR bn] 851 4,567 623
Total equity [IDR bn] 1,477 10,024 1,789
Growth [Y-o-Y]
Net sales [%] 5.6 (5.5) (12.5)
Gross profit [%] 9.3 (8.6) (43.6)
Before tax profit [%] 12.5 (72.8) (104.5)
Net profit [%] 12.8 (72.1) (104.6)
Profitability
Gross profit margin [%] 29.7 14.6 10.9
Operating profit margin [%] 21.8 2.7 (0.5)
ROA [%]* 19.1 1.6 (0.3)
ROE [%]* 30.1 2.4 (0.3)
Leverage
Liabilities to equity [x] 0.6 0.5 0.3
Source: Bloomberg, PT Selamat Sempurna Tbk, PEFINDO Research & Consulting - Equity & Index Valuation Division
“Disclaimer statement in the last page is an integral part of this report” www.pefindo-consulting.co.id
`
Selamat Sempurna, Tbk
VALUATION
Methodology
We employed the Discounted Cash Flow (DCF) method as the main valuation approach considering that income growth is the value driver for SMSM instead of asset growth.
Furthermore, we also used the Guideline Company Method (GCM) as a comparison method.
This valuation is based 100% on the shares price as of December 21, 2015, using
SMSM’s Financial Report (unaudited) for the period ending September 30, 2015 as the basis for the analysis.
Value Estimation
We applied a cost of capital and cost of equity of 11.2% and 10.7% in our valuation based on the following assumptions:
Table 4: Assumption
Risk free rate [%]* 8.7
Risk premium [%]* 5.4
Beta [x]** 0.5
Cost of Equity [%] 11.2
Marginal tax rate [%] 22.0
WACC [%] 10.7
Source: Bloomberg, PEFINDO Research & Consulting - Equity & Index Valuation Division
* as of December 21, 2015
** PEFINDO Beta as of December 17, 2015
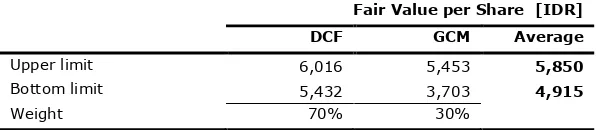
The target price for 12 months, based on the valuation as of December 21, 2015, is as follows:
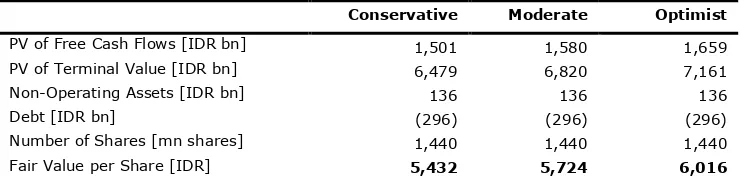
Using the DCF method with a discount rate assumption of 10.7%, it is IDR5,432–IDR6,016 per share.
Using the GCM method (P/E 17.0x and P/BV 3.2x), it is IDR3,703– IDR5,453 per share.
In order to obtain a value which represents both value estimates, we have weighted in the results of both DCF and GCM methods by 70%:30%.
Based on the above calculation, the target price of SMSM for 12 months is
IDR4,915-IDR5,850 per share.
Table 5: Summary of DCF Method Valuation
Conservative Moderate Optimist
PV of Free Cash Flows [IDR bn] 1,501 1,580 1,659
PV of Terminal Value [IDR bn] 6,479 6,820 7,161
Non-Operating Assets [IDR bn] 136 136 136
Debt [IDR bn] (296) (296) (296)
Number of Shares [mn shares] 1,440 1,440 1,440
Fair Value per Share [IDR] 5,432 5,724 6,016
“Disclaimer statement in the last page is an integral part of this report” www.pefindo-consulting.co.id
`
Selamat Sempurna, Tbk
Table 6: GCM Comparison
SMSM AUTO Average
P/E [x] 14.9 19.1 17.0
P/BV [x] 5.6 0.9 3.2
Source: Bloomberg, PEFINDO Research & Consulting - Equity & Index Valuation Division
Table 7: Summary of GCM Method Valuation
Multiple [x] Est. EPS [IDR] Est. BV/share [IDR] Value [IDR]
P/E 17.0 321 - 5,453
P/BV 3.2 - 1,153 3,703
Source: Bloomberg, PEFINDO Research & Consulting - Equity & Index Valuation Division
Table 8: Fair Value Reconciliation
Fair Value per Share [IDR]
DCF GCM Average
Upper limit 6,016 5,453 5,850
Bottom limit 5,432 3,703 4,915
Weight 70% 30%
“Disclaimer statement in the last page is an integral part of this report” www.pefindo-consulting.co.id
`
Selamat Sempurna, Tbk
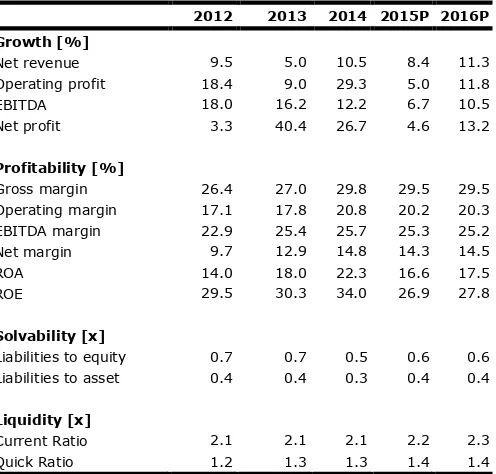
Table 9: Consolidated Statement of Comprehensive Income
Source: PT Selamat Sempurna Tbk, PEFINDO Research & Consulting - Equity & Index Valuation Division
Table 10: Consolidated Statement of Financial Position
IDR bn 2012 2013 2014 2015P 2016P
Source: PT Selamat Sempurna Tbk, PEFINDO Research & Consulting - Equity & Index Valuation Division
Figure 11: P/E and P/BV
Source: PT Selamat Sempurna Tbk, PEFINDO Research & Consulting - Equity & Index Valuation Division
Figure 12: ROA, ROE and Total Assets Turnover
Source: PT Selamat Sempurna Tbk, PEFINDO Research & Consulting - Equity & Index Valuation Division
“Disclaimer statement in the last page is an integral part of this report” www.pefindo-consulting.co.id
`
Selamat Sempurna, Tbk
DISCLAIMER
This report was prepared based on trusted and reliable sources. Nevertheless, w e do not guarantee its completeness, accuracy and adequacy. Therefore, we are not responsible for any investment decisions made based on this report. All assumptions, opinions and predictions were solely our internal judgments as of the reporting date, and those judgments are subject to changes without further notice.
We are not responsible for any mistakes or negligence that occurs by using this report. Recent performance cannot always be used as a reference for future outcome. This report does not offer a recommendation to purchase or hold particular shares. This report might not be suitable for some investors. All opinions in this report have been presented fairly as of the issuing date with good intentions; however, they could change at any time without further notice. The price, value or income of each share of the Company stated in this report might be lower than investor expectations, and investors may obtain returns lower than the invested amount. Investment is defined as the probable income that will be received in the future; nonetheless such returns may fluctuate. As for companies whose shares are denominated in a currency other than Rupiah, foreign exchange fluctuation may reduce their share value, price or the returns for investors. This report does not contain any information for tax considerations in investment decision-making.
The share price target in this report is a fundamental value, not a fair market value or a transaction price reference required by regulations.
The share price target report issued by the PT PEFINDO Riset Konsultasi (“PRK”) or “PEFINDO Research &
Consulting” is not a recommendation to buy, sell or hold particular shares. It should not be considered as
investment advice from the PRK and its scope of service to some pa rties, including listed companies, financial advisors, brokers, investment banks, financial institutions and intermediaries, does not correlate with receiving rewards or any other benefits from such parties.
This report is not intended for any particular investor and cannot be used as part of an objective investment analysis of particular shares, an investment recommendation, or an investment strategy. We strongly recommend investors to consider the suitability of the situation and conditions before making a decision in relation with the figures in this report. If necessary, consult with your financial advisor.
PEFINDO keeps the activities of the Equity Valuation separate from its r atings activities to preserve the independence and objectivity of its analytical processes and products. PEFINDO has established policies and procedures to maintain the confidentiality of non-public information received in connection with each analytical process. The entire process, methodology and the database used in the prep aration of the Reference Share Price Target Report as a whole are different from the processes, methodologies and databases used by PEFINDO in issuing ratings.
This report was prepared and composed by PRK with the objective of enhancing the transparency o f share prices of listed companies in the Indonesia Stock Exchange (IDX). This report is also free of influence from any other party, including pressure or force either from IDX or the listed company reviewed. PRK earns a reward from IDX and the reviewed company for issuing this report twice a year. For further information, please visit our website at http://www.pefindo-consulting.co.id