C
–
2
Pollutant And Sedimentation Dispersion Pattern
In The Confluence Of Two Rivers
1
Dewi Nurmalitasari, 2Basuki Widodo
1)
Jurusan Matematika, Institut Teknologi Sepuluh Nopember, Surabaya, Indonesia
2)
Jurusan Matematika, Institut Teknologi Sepuluh Nopember, Surabaya, Indonesia Email: 1)[email protected]
Abstract
In addition to river water pollution caused by human activity and industrial activity, also due to influence of natural activities such as volcanic activity that has volcanic ash and cold lava cause river pollution in river water at the same deposition. Besides of community activities Surabaya living along the Brantas River flow contributes to making soil erosion along the river, pollution and deposition also occurs due to discharge of industrial waste or household waste. This was strengthened with the data from the
Ministry of Environment, Sindo’s magazine on Nopember 7th
2013, "The total number of industries in East Java that has the potential to pollute the river there are about 1,004 industries, of that number as many as 483 industries located along the Watershed (DAS) Brantas river Surabaya and capacity pollution load 35 tons of organic waste a day, but the fact more than 70 tons of organic waste a day ". It becomes negative news for the citizens of Surabaya so that the public and the government of Surabaya more careful in taking precaution because almost 96% of the water supply Surabaya Kali is a tributary of the Brantas river used to PDAM Surabaya, so according to its function, the water must be maintained the quality of the water and do monitoring in order to remain decent for use. In this research focuses on the modeling of pollutant dispersion and sedimentation patterns in the confluence of two rivers by combining elements of hydrodynamics using Finite Volume Method QUICK scheme (upwind Quadratic Interpolation Convective Kinematics) so that the results of this research are expected to helping the parties involved in maintaining the quality of the Brantas River Surabaya to remain fit for consumption and reduce silting of the river.
Keywords: Elements of Hydrodynamics, The spread of pollutants and sedimentation, river Brantas, Finite Volume Method, QUICK (Quadratic Upwind Interpolation Convective Kinematics).
1. Introduction
2. Basic Laws of Hydrodynamics
2.1 The Conservation of Mass
According to Apsley, (2013) and Welty et al, (2007) described the continuum principle that the law of conservation of mass is the mass contained in the Control Volume (CV) coupled with mass flow out through the Control Surface (CS) is equal to the number of generated mass. (Apsley, 2013) and (Welty dkk, 2007).
(2.1)
2.2 The Convervation of Momentum
In the continuum principle of conservation of momentum is the average change of momentum in the control volume (CV) coupled with the momentum flow out through the Control Surface (CS) is equal to the rate of change of momentum with respect to time. (Apsley, 2013) and (Welty et al, 2007).
(2.2)
2.3Finite Volume Method
Finite Volume Method was first documented and well used by Evans and Harlow (1957) in Los Alamos and Gentry, Martin and Daley (1966).Volume up method is discretization technique for partial differential equations, especially for issues of conservation laws in physics.Volume method to pendiskritan also often used in fluid dynamics equations. Volume method to use the integral form of the conservation equation so much easier in pendiskritan (Veersteg, 2007). The solution will be divided into a finite number of control volumes, and which has been discretized equations will be applied to each control volume.
2.4Discretization of QUICK
Each domain has a control grid in the face and control nodes. Controls for the two-dimensional face consists of , while for the control node to consist of a two-dimensional . QUICK discretization is done based on the magnitude of the velocity (v) is
with:
Conservation laws of physics which meet river flow model are 1. The conservation of mass
2. The conservation of momentum 3. The conservation of energy
(Governing Equation) used only the continuity equation of the law and the law of conservation of mass due to temperature changes are ignored in this study.
Governing Equationof Conservation of Mass
(3.1)
3.1Governing Equation Marmoyo River
3.2Governing Equation Surabaya River
3.3Governing Equation of Confluence of Two River
(3.5)
(3.6) = First Streamflow
= Second Streamflow = First velocity = Second velocity
= amount of bed load sediment
= ratio of sediment density to water density
= average diameter of sediment
= 8.0 = 1.0 = 0.047 =
= density = shear stress
4. Numerical Solution
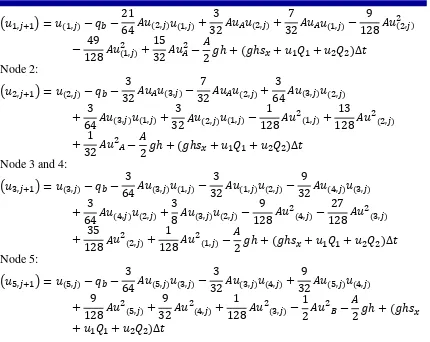
Marmoyo river at the x-axis Node 1:
Node 2:
Node 5:
Surabaya river at the x-axis Node 1:
Node 2:
Node 3 and 4:
Node 5:
help of MATLAB. The analysis is performed using the selected parameters. Speed data used in this simulation is the data rate for the year 2013.
Distribution of Pollutants Marmoyo River
Figure 5.1: Dispersion of Pollutants River Marmoyo Longitudinal Direction 0 145 290 435 580 725 870 1015 1160 1305
0.4
Dispersi Polutan Sungai Marmoyo Arah Longitudinal Sepanjang 2013
In Figure 5.1., seen that the distribution of pollutant concentrations Marmoyo River in the longitudinal direction decreases.Distribution of Pollutants lowest occurred in June and highest pollutant distribution in December. The decline in the distribution of pollutants contained in June due to a decline in the volume of river water due to the dry season, while the increase in the spread of pollutants occurs in November through February due to the rainy season. At x = 0 the distribution of pollutants is high because there are waste from factories and industrial waste on the river Marmoyo then a decline in the distribution of pollutants from x = 0 to x = 145 then constant and the distribution of pollutants decreases until x = 1305.
Surabaya River
Figure 5.2: Dispersion of Pollutants Surabaya River Longitudinal Direction
In Figure seen that the distribution of pollutant concentrations in the Surabaya River longitudinal direction decreases. Distribution of Pollutants lowest occurred in June and highest pollutant distribution in December.Decreased the distribution of pollutants contained in June due to a decline in the volume of river water due to the dry season, while the increase in the spread of pollutants occurs in November through February due to the rainy season.At x = 0 the distribution of pollutants is high because there are waste from factories and industrial waste in Surabaya River and then a decline in the distribution of pollutants from x = 0 to x = 145 then constant and the distribution of pollutants decreases until x = 1305.
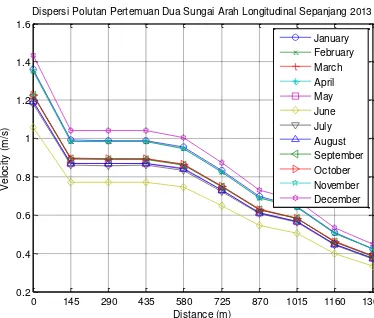
The Confluence of two rivers
Figure 5.3: Dispersion of Pollutants Meeting of Two Rivers Longitudinal Direction
0 145 290 435 580 725 870 1015 1160 1305
0.5
Dispersi Polutan Sungai Surabaya Arah Longitudinal Sepanjang 2013
Jarak (m)
0 145 290 435 580 725 870 1015 1160 1305
0.2
Dispersi Polutan Pertemuan Dua Sungai Arah Longitudinal Sepanjang 2013
In Figure seen that the distribution of pollutant concentrations Meeting of Two Rivers in the longitudinal direction decreases. Distribution of Pollutants lowest occurred in June and highest pollutant distribution in December.Decreased the distribution of pollutants contained in June due to a decline in the volume of river water due to the dry season, while the increase in the spread of pollutants occurs in November through February due to the rainy season.At x = 0 the distribution of pollutants because there are high concentrations of pollutant mixtures Surabaya River and River Marmoyo then a decline in the distribution of pollutants from x = 0 to x = 145 then constant and the distribution of pollutants decreases until x = 1305.
Distribution of Sediment Marmoyo river
Figure 5.4: Dispersion Marmoyo River Sedimentation meeting Longitudinal Direction
In Figure seen that the distribution of sediment in the longitudinal direction of Surabaya River is declining because the pollutants TSS follow along streams resulting sedimentation.Distribution of low sedimentation occurred in June and the highest distribution of sedimentation occurred in December. There is a Decreased sedimentation distribution in June, while increase in the distribution of sedimentation occurs from November to February.At x = 0 the distribution of high pollutant because it follows the TSS pollutants along the river there are waste from factories and industrial waste in Surabaya River and then a decline in the distribution of sedimentation from x = 0 to x = 145 then tends to a constant and the distribution of sedimentation decreases until x = 1305.
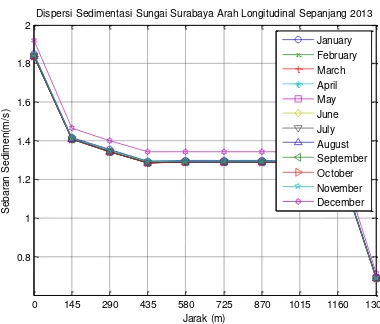
Surabaya River
Figure 5.5: Distribution of Sedimentation Patterns In Surabaya River Longitudinal Direction
0 145 290 435 580 725 870 1015 1160 1305
0.8
Dispersi Sedimentasi Sungai Surabaya Arah Longitudinal Sepanjang 2013
Jarak (m)
0 145 290 435 580 725 870 1015 1160 1305
0.7
Dispersi Sedimentasi Pertemuan Dua Sungai Arah Longitudinal Sepanjang 2013
In Figure seen that the distribution of sediment Meeting of Two Rivers in the longitudinal direction is declining because the pollutants TSS follow along streams resulting sedimentation.Distribution of low sedimentation occurred in June and the highest distribution of sedimentation occurred in December. There is a Decreased sedimentation distribution in June, while increase in the distribution of sedimentation occurs from November to February.At x = 0 the distribution of high pollutant because it follows the TSS pollutants along the river there are Mixed quantity Surabaya River Sedimentation and River Marmoyo then a decline in the distribution of sedimentation from x = 0 to x = 145 then tends to a constant and the distribution of sedimentation decreases until x = 1305.
The Confluence of Two River
Figure 5.6: Pola Sebaran Sedimentasi Pada Pertemuan Dua Sungai Arah Longitudinal
In Figure seen that the distribution of sediment Meeting of Two Rivers in the longitudinal direction is declining because the pollutants TSS follow along streams resulting sedimentation. Distribution of low sedimentation occurred in June and the highest distribution of sedimentation occurred in December.There is a Decreased sedimentation distribution in June, while increase in the distribution of sedimentation occurs from November to February.At x = 0 the distribution of high pollutant because it follows the TSS pollutants along the river there are Mixed quantity Surabaya River Sedimentation and River Marmoyo then a decline in the distribution of sedimentation from x = 0 to x = 145 then tends to a constant and the distribution of sedimentation decreases until x = 1305.
6. Conclusion
1. It was found mathematical model of the equation of conservation of mass, conservation of momentum, the equation of sediment, and the scalar transport equation. Conservation of mass, conservation of momentum, and the equation used to calculate the quantity of sediment distribution and sediment transport equations used to calculate the scalar quantity distribution of pollutants.
2. During the year 2013, the spread of pollutants and sedimentation velocity is highest due to occur in December rainy season, and the speed of the spread of pollutants and sedimentation lowest occurred in June.
0 145 290 435 580 725 870 1015 1160 1305 0.7
Dispersi Sedimentasi Pertemuan Dua Sungai Arah Longitudinal Sepanjang 2013
3. At x = 0 to x = 145 quantity of sediment distribution and quantity of pollutants to the direction of the longitudinal distribution decreases.
4. Pollutants and Sedimentation spread throughout the longitudinal and lateral direction and thoroughly spread on the direction of the longitudinal follow the river.
5. Quantity distribution of pollutants and sediment decreases with increasing distance.
7. Reference
Anonymous. 2013. 98 Industri Cemari Kali Surabaya. http://www.koran-sindo.com/node/340099. Diakses 26 Februari 2013.
Apsley, D. (2013), Computational Hydraulics, Lecture Notes, University of Manchester, Manchester.
Apsley, D. (2013), Fluid Flow Equation, Lecture Notes, University of Manchester, Manchester.
Asyhar, A. (2012), Pola Penyebaran Polutan di Daerah Aliran Sungai, Tesis, Jurusan Matematika, Fakultas Matematika dan Ilmu Pengetahuan Alam, Institut Teknologi Sepuluh Nopember, Surabaya.
Chaundry, M. H. (2008), Open-Channel Flow, 2nd edn, Springer, New York.
Ferziger, J. H dan Miolvan Peric. (2002), Computational Methods for Fluid Dynamics, 3rd edn, Springer, New York.
Kodoatie, R. J. (2002), Hidrolika Terapan: Aliran Pada Saluran Terbuka dan Pipa, Andi Yogyakarta, Yogyakarta.
Maulana, D. A. (2013), Pola Penyebaran Polutan Total Suspended Solid Pada Pertemuan Dua Sungai, Tesis, Jurusan Matematika, Fakultas Matematika dan Ilmu Pengetahuan Alam, Institut Teknologi Sepuluh Nopember, Surabaya.
Misnani. 2010. Praktikum Teknik Lingkungan Total Padatan Terlarut. http://misnanidulhadi.blogspot.com/. Diakses 26 Februari 2013.
Siing, M. dan B, Widodo. (2011), Penyelesaian Model Matematika Penelusuran Banjir Gelombang Difusi, dalam Prosiding Seminar Nasional Penelitian, Pendidikan dan Penerapan MIPA, Universitas Negeri Yogyakarta, Yogyakarta, M –77 – M
– 84.
Subiono. (2013), Sistem Linear dan Kontrol Optimal, 2.1.1 edn, Jurusan Matematika FMIPA ITS, Surabaya.
Streeter, V. L. (1992), Mekanika Fluida, 8th edn, Erlangga, Jakarta.
Tarigan, M. S, dan Edward. 2003. Kandungan Total Zat Padat Tersuspensi (Total Suspended Solid) di Perairan Raha, Sulawesi Tenggara. MAKARA. SAINS. VOL.7. NO. 3
Veersteg, H. K. dan Malalasekera, W. (2007), An Introducing to Computational Fluid Dynamics: The Finite Volume Methods, 2nd edn, Pearson Education Limited, Glasgow.
Warlina, L. (2004), Pencemaran air: Sumber, Dampak dan Penanggulangannya, dalam Makalah Pribadi, MIPA, Pascasarjana: Institut Pertanian Bogor, Bogor.
Wardhana, W. A. (1995), Dampak Pencemaran Lingkungan, Andi Yogyakarta, Yogyakarta.
Welty, Wicks, Wilson, Rorrer. (2007), Fundamentals of Momentum, Heat, and Mass Transfer, 5th edn, Lehigh Press inc, United State.
Westrich, B. (2007), Sediment Dynamics and Pollutant Mobillity in Rivers. Springer, Berlin.
Widodo, B. (2012), Pemodelan Matematika, Itspress, Surabaya.