June 2010
Consumer confidence index in June 2010 rebounded after slightly
down in the previous month. The government’s plan to pay the 13
th
salary for civil servants is expected to boost consumer spending
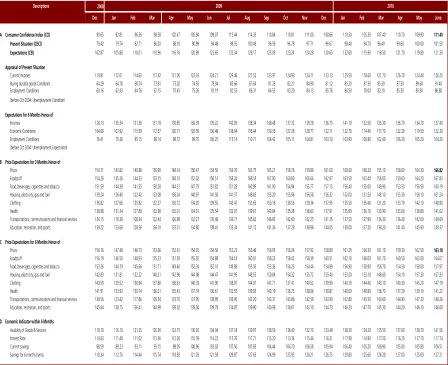
as reflected by the CCI which grew 1.5 points to 111.4.
Respondents expected an upward pressure on prices in the next 3
and 6 months as the price expectation indexes edged up by 2.5
and 0.7 points respectively.
Consumer Confidence Index
CCI advanced by 1.5 points over previous month.
Based on
Consumer Survey of Bank Indonesia in June 2010, CCI rebounded to the level
of 111.4. The upward trend can be attributed to the rise of respondent’s
income. In addition, such improving consumer’s sentiment was also related to
further improvement on some economic indicators for the next 6 months.
Graph 1. Consumer Confidence Index
60.0
70.0
80.0
90.0
100.0
110.0
120.0
130.0
140.0
1
2
3
4
5
6
7
8
9
10 11 12
1
2
3
4
5
6
7
8
9
10 11 12
1
2
3
4
5
6
2008
2009
2010
(Index)
Current Economic Condition Index
Consumer Expectation Index
Consumer Confidence Index
Optimistic
Pessimistic
Fuels Hike
Global Economic
Crisis
The higher CCI in turn is expected to push higher consumer’s
expenditure. This would be further buoyed by government’s plan to pay the
13
th
salary of civil servants and seasonal factor related to school holidays.
CONSUMER SURVEY
Consumer Confidence Index
more optimistic
Methodology
On average household considered that current economic
condition is better than the same period in the last year.
CCI climbed
2.3 points over June 2009. Such an improved perception is also assisted by
stronger respondent’s optimism on current employment as compared to
previous year.
Current Economic Condition Index
Respondent claimed that current economic condition was better
off than 6 months ago.
Current Economic Condition Index (CECI) in June
2010
continued to stay in the optimistic level of 101.5 after touching the
optimistic level in previous month for the first time. The index advanced by 1.5
points over previous month. Such a higher optimism was due to better
employment and income as the indexes rose 0.9 and 1.8 points respectively.
In parallel, respondents acknowledging that current time is the good time to
buy durable goods are also increased.
Consumers noted that compared to the same period of last year,
current economic conditions are improved with the index rose by 7.0 points.
Such a rise was driven by stronger respondent’s perception on job availability
and income as reflected by the increases in indexes; 5.6 and 2.0 points
respectively. In addition, respondents who admitted that current time is the
appropriate time to spend on durable goods rose significantly, as the index
surged 13.4 points, obviously pushing up the CECI in this reporting month.
Graph 2. Current Economic Condition Index (CECI)
0.0
20.0
40.0
60.0
80.0
100.0
120.0
140.0
1
2
3
4
5
6
7
8
9 10 11 12 1
2
3
4
5
6
7
8
9 10 11 12 1
2
3
4
5
6
2008
2009
2010
Index
Current Economic Conditions Index
Current Incomes
Buying Durable Goods Conditions
Job Availability
Consumer Expectation Index
The optimism of consumer’s expectation on economic seems to
persist.
The
strengthening consumer’s expectation was reflected on the
better Consumer Expectation Index (CEI), rising by 1.5 points over previous
month. The higher index largely owed to respondent’s optimism on economic
condition in the next 6 months, with the index edging up by 2.8 points. Those
also impacted income expectation, in which the index rose by 2.7 points over
previous month.
Although it is improving compared with previous month, respondent’s
expectation on economic condition in June 2010 is still lower than the same
period in the last year. The index was 2.4 points below the previous year.
Apparently consumers have yet to fully recover from last year’s decline.
Consumer expectation on economic condition and job availability are still
lower than those of last year, 8.2 and 1.0 points respectively.
Graph. 3 Consumer Expectation Index (CEI)
0.0
20.0
40.0
60.0
80.0
100.0
120.0
140.0
160.0
1
2
3
4
5
6
7
8
9 10 11 12 1
2
3
4
5
6
7
8
9 10 11 12 1
2
3
4
5
6
2008
2009
2010
Index
Consumer Expectation Index
Incomes Expectation
Economic Expectation
Job Availability Expectation
Income Expectation
Respondents were upbeat that their income in the next 6
months would increase,
as reflected in income expectation index which
climbed 2.7 points from previous month, to stand at 137.4. The higher index
was mostly supported by stronger optimism of respondents with monthly
spending of more than Rp 5 millions. Likewise, respondent’s expectation on
their income for the next 6 months also rose 2.2 points.
Consumers continued its
optimism on economic
condition
Price Expectation
Pressure on prices in the next 3 and 6 months are seen to
slightly move up.
Respondents envisaged that price pressures would move
upward in the next 3 and 6 months as the indexes climbed 2.5 and 0.7 points
respectively over previous month. Price surges for the next 3 months were
expected to take place primarily for transportation, communication and
financial service group and clothing group which climb 7.7 and 6.8 points
respectively over the previous month. Such an upward pressure was expected,
in light of Eid-ul Fitr celebration in next September 2010. Meanwhile, price
expectation index in the next 6 months was associated with Christmas
celebration in December 2010.
Graph 4.
Price Expectation Index for the next 3 and 6 months
‐
1.00
0.00
1.00
2.00
3.00
4.00
5.00
6.00
130.0
140.0
150.0
160.0
170.0
180.0
190.0
200.0
1 2 3 4 5 6 7 8 9 1011 12 1 2 3 4 5 6 7 8 9 1011 12 1 2 3 4 5 6 7 8 9 1011
2008
2009
2010
Price
Expectation
Index
3
months
ahead
Price
Expectation
Index
6
months
ahead
Cummulative
Inflations
in
3
months
Index
Notes
: A reading of 100 means that consumers expect prices will still be stable, index > 100
indicates consumers expect prices will increase, and index < 100 indicates consumers expect prices
will decrease
Expectations of Savings and Interest Rates
In line with higher pressure on prices, respondents also envisaged a
rising interest rates in the next 6 months as the index edged up 0.6 point.
Consequently, respondents also predicted saving amount in the next 6 months
would arise. The upward expectation was explained by the increasing income
expectation index in the next 6 months.
Price pressures are
slightly up
Graph. 5
Expectation Indexes on Interest Rates and Total Savings in the next 6 months
0
5
10
15
20
25
90
100
110
120
130
140
1 2 3 4 5 6 7 8 9 10 11 12 1 2 3 4 5 6 7 8 9 10 11 12 1 2 3 4 5 6 7 8 9 10 11 12
2008
2009
2010
Savings
Growth
in
6
months
Interest
Rates
Expectation
Index
in
6
months
ahead
Savings
Expectation
Index
in
6
months
ahead
Index
(%)
Notes
: A reading of 100 means that consumer expect saving deposit and interest rate will still be
stable, index > 100 indicates consumer expect saving deposit and interest rate will increase, and
index < 100 indicates consumer expect saving deposit and interest rate will decrease
Expectations on Economic Conditions
This period survey revealed that respondents grew more
optimistic over economic condition in the next 6 months,
regaining the
positive sentiment after sliding in the previous month. Such an optimism on
future economic condition apparently has pushed the index up 2.8 points into
the level of 122.3. Based on the respondents’ educational background, the
higher index was stated mostly by those who hold university degree.
Table 1. Consumer Confidence, Price Expectations, Consumption Plans, and Economic Indicators (Index)
2008
Dec
Jan
Feb
Mar
Apr
May
Jun
Jul
Aug
Sep
Oct
Nov
Dec
Jan
Feb
Mar
Apr
May
June
A Consumer Confidence Index (CCI)
90.65
92.81
96.36
98.58
102.47
105.94
109.07
115.44
114.33
110.84
110.01
111.00
108.66
110.50
105.30
107.40
110.70
109.90
111.40
Present Situation (CECI)
78.42
79.74
82.71
86.20
88.18
90.99
94.48
98.55
100.49
96.59
96.78
97.71
96.67
98.40
94.70
96.40
99.60
100.00
101.50
Expectations (CEI)
102.87
105.88
110.01
110.96
116.76
120.89
123.65
132.34
128.17
125.09
123.24
124.28
120.65
122.60
115.90
118.50
121.70
119.80
121.30
Appraisal of Present Situation
Current Incomes
110.81
112.01
114.63
117.62
121.05
123.16
124.21
129.46
127.52
123.97
124.93
124.11
123.13
125.50
118.60
121.70
126.10
124.40
126.20
Buying durable goods Conditions
64.29
64.78
68.74
73.81
73.02
74.55
78.04
83.66
87.64
81.28
82.21
84.90
81.12
85.20
87.30
85.30
87.50
89.60
91.40
Employment Conditions
60.16
62.43
64.76
67.15
70.45
75.26
81.19
82.53
86.31
84.53
83.20
84.13
85.76
84.50
78.00
82.10
85.30
85.90
86.80
(before Oct 2004: Unemployment Condition)
Expectations for 6 Months Hence of
Incomes 128.13
130.34
131.30
131.18
130.85
136.39
135.22
142.93
138.34
138.48
137.32
139.28
136.75
141.10
132.50
135.30
136.70
134.70
137.40
Economic Conditions
104.08
107.92
113.59
112.57
120.71
126.59
130.48
138.94
135.44
130.35
127.28
128.77
122.11
122.70
114.40
117.70
122.20
119.50
122.30
Employment Conditions
76.41
79.38
85.15
89.14
98.72
99.70
105.25
115.14
110.71
106.42
105.11
104.81
103.10
103.90
100.80
102.40
106.30
105.20
104.20
(before Oct 2004: Unemployment Expectation)
B Price Expectations for 3 Months Hence of
Prices
154.71
143.82
140.86
150.90
148.14
150.47
154.50
154.76
163.75
165.21
158.76
159.89
161.00
160.60
160.20
155.10
158.60
164.30
166.82
Foodstuff
154.26
145.26
144.33
153.15
148.10
152.02
156.51
158.24
168.18
167.00
160.80
160.64
162.97
163.50
163.40
156.00
159.60
164.20
167.83
Food, beverages, cigarettes and tobacco
151.59
144.38
141.55
150.28
144.31
147.79
151.82
151.28
160.99
161.00
154.94
155.77
157.15
156.40
155.00
149.90
153.50
156.50
160.19
Housing, electricity, gas and fuel
139.24
126.40
122.42
133.08
136.24
140.97
141.50
141.57
148.85
155.20
155.96
156.58
156.32
152.00
151.50
148.10
155.30
158.10
161.24
Clothing
136.82
127.66
125.82
132.27
130.72
134.20
139.55
142.47
152.65
150.16
138.56
139.34
137.95
135.50
136.40
131.20
133.70
142.10
148.90
Health
138.98
131.34
127.88
132.98
132.01
134.01
135.54
132.07
139.61
140.64
135.38
136.63
137.91
135.90
136.10
133.90
133.60
138.80
141.02
Transportations, communications and financial services
134.15
116.38
108.34
122.44
126.89
132.27
135.48
136.71
145.62
146.85
142.60
142.25
141.35
137.50
137.90
134.30
136.40
142.00
149.69
Education, recreation, and sports
139.22
133.68
128.56
136.10
133.31
134.80
138.41
135.34
141.12
141.34
137.28
138.96
140.05
138.00
137.20
138.20
141.40
145.90
149.37
C Price Expectations for 6 Months Hence of
Prices
156.76
147.48
146.73
153.66
152.61
154.03
154.50
152.23
156.46
156.95
156.24
157.92
158.80
161.20
164.30
161.10
159.30
162.50
163.18
Foodstuff
156.19
146.50
148.93
155.33
151.93
155.92
154.88
154.18
160.01
158.23
158.42
158.39
160.51
162.10
166.00
161.70
160.50
163.00
164.07
Food, beverages, cigarettes and tobacco
153.26
144.79
145.66
151.71
149.40
152.34
152.10
149.88
155.05
153.36
154.25
154.44
154.89
156.90
158.90
156.70
154.50
158.00
157.97
Housing, electricity, gas and fuel
142.83
131.81
132.22
140.21
142.96
144.08
144.47
141.95
148.55
150.84
154.32
155.72
155.40
153.20
153.10
148.60
154.10
157.30
157.33
Clothing
140.59
129.52
130.94
137.88
136.61
140.78
141.90
138.97
144.01
141.71
137.41
140.52
139.90
140.10
144.40
143.10
140.30
145.20
147.19
Health
141.91
133.93
130.74
136.21
135.43
137.74
136.61
132.55
139.03
140.19
136.73
138.06
138.87
140.00
140.80
136.70
137.20
139.10
141.22
Transportations, communications and financial services
138.56
123.42
117.86
130.54
133.70
137.95
138.95
136.95
143.20
143.37
143.86
142.59
143.90
142.80
145.50
143.60
144.90
147.30
148.26
Education, recreation, and sports
145.84
138.75
136.41
140.99
139.02
139.04
139.78
134.87
139.80
140.98
138.61
143.10
144.73
146.20
147.70
145.30
144.20
146.10
146.08
D Economic Indicator within 6 Months
Avaibility of Goods & Services
118.70
116.10
121.25
120.36
123.75
130.92
134.04
137.18
139.97
138.59
136.40
132.70
133.48
138.30
134.20
135.50
137.60
138.70
141.56
Interest Rate
114.83
111.48
111.02
113.36
112.26
110.59
114.22
115.76
117.71
115.20
113.34
115.44
116.31
117.90
114.90
117.00
116.20
117.10
117.74
Current savings
88.59
89.23
93.11
93.15
98.05
100.96
103.02
107.50
107.85
104.44
104.70
106.58
105.94
106.40
105.20
106.90
105.00
105.80
106.51
Savings for 6 months hence
110.34
112.70
114.44
115.74
118.83
121.03
121.59
129.87
127.63
124.99
125.93
128.21
126.75
129.80
125.60
126.20
127.00
125.00
127.21
2010
Descriptions
2009
Table 2. Respondent Figures (percentages)
2008
Dec
Jan
Feb
Mar
Apr
May
Jun
Jul
Aug
Sep
Oct
Nov
Des
Jan
Feb
Mar
Apr
May
June
Gender
Male
59.56
59.71
62.26
58.82
60.55
60.40
60.26
62.09
59.50
59.83
57.55
57.82
58.31
59.80
58.60
59.00
58.80
57.70
57.40
Female
40.44
40.29
37.74
41.18
39.45
39.60
39.74
37.91
40.50
40.17
42.45
42.18
41.69
40.20
41.40
41.00
41.20
42.30
42.60
Household Expenses
Rp. 1 million - Rp. 3 million
60.87
59.13
58.41
60.60
58.77
59.13
58.70
60.32
60.54
59.49
60.94
60.21
59.35
58.70
61.20
58.10
59.80
59.70
60.90
Rp. 3 million - Rp. 5 million
27.85
29.24
29.82
28.59
28.90
29.40
29.73
28.99
29.15
30.10
28.35
28.39
29.66
30.90
28.70
30.80
30.30
29.60
28.80
Rp. 5 million and over
11.28
11.62
11.77
10.81
12.32
11.47
11.57
10.69
10.31
10.42
10.71
11.41
10.99
10.40
10.00
11.20
9.90
10.70
10.30
Ages
20-40 years
56.96
59.24
58.69
62.42
59.91
58.96
60.35
58.37
62.00
58.48
61.12
63.93
62.16
57.60
59.50
59.10
60.30
61.10
60.50
41-60 years
40.09
37.57
38.38
34.93
36.65
37.97
36.33
38.79
34.64
38.34
35.89
33.00
34.23
38.40
36.60
36.50
35.60
34.90
35.90
60 years above
2.95
3.19
2.93
2.66
3.44
3.07
3.32
2.84
3.36
3.18
2.99
3.08
3.61
3.90
3.90
4.40
4.10
4.00
3.50
Educational Level
2010
Table 3. Consumer Confidence by Region (Index)
2008
Dec Jan Feb Mar Apr May Jun Jul Aug Sep Oct Nov Dec Jan Feb Mar Apr May June DKI Jakarta
Consumer Confidence Index 76.90 79.49 76.19 82.70 92.42 98.07 104.51 111.98 105.76 101.20 99.02 105.05 97.17 105.90 94.10 96.30 97.70 97.60 104.90 Present Situation 59.74 59.51 55.99 62.62 64.76 68.86 76.41 78.72 80.09 77.15 75.98 81.04 76.33 86.40 79.10 78.80 83.00 79.60 89.00 Expectations 94.05 99.47 96.38 102.79 120.09 127.29 132.61 145.25 131.43 125.24 122.05 129.07 118.01 125.40 109.10 113.90 112.50 115.50 120.80 Bandung
Consumer Confidence Index 75.00 82.56 80.44 83.39 77.00 93.94 91.89 95.22 100.06 87.67 104.67 105.00 102.39 99.30 85.70 92.20 97.60 101.10 99.80 Present Situation 59.67 69.33 62.56 67.33 61.00 76.67 73.67 76.78 83.00 71.67 88.78 87.44 85.33 80.30 70.10 74.70 83.10 88.90 88.60 Expectations 90.33 95.78 98.33 99.44 93.00 111.22 110.11 113.67 117.11 103.67 120.56 122.56 119.44 118.20 101.20 109.70 112.10 113.20 111.00 Semarang
Consumer Confidence Index 83.00 83.44 96.44 98.83 105.78 108.00 114.56 122.83 115.33 105.83 119.56 112.06 114.72 113.80 121.60 105.60 113.70 117.90 103.30 Present Situation 74.89 81.00 85.33 92.56 95.78 100.44 103.56 110.89 109.78 94.44 110.67 101.00 103.44 105.40 112.30 98.90 109.40 112.20 95.00 Expectations 91.11 85.89 107.56 105.11 115.78 115.56 125.56 134.78 120.89 117.22 128.44 123.11 126.00 122.10 130.80 112.20 118.00 123.60 111.60 Surabaya
Consumer Confidence Index 74.03 82.27 82.40 83.57 86.93 89.27 93.57 100.77 102.93 97.57 103.87 101.23 96.30 103.50 100.80 99.40 98.30 96.50 92.50 Present Situation 61.60 63.87 67.27 67.47 70.60 70.80 76.93 81.73 83.20 80.13 88.47 88.40 81.87 93.10 89.30 92.70 88.10 87.70 82.50 Expectations 86.47 100.67 97.53 99.67 103.27 107.73 110.20 119.80 122.67 115.00 119.27 114.07 110.73 113.90 112.30 106.10 108.60 105.30 102.50 Medan
Consumer Confidence Index 90.32 88.57 92.65 98.15 102.38 104.29 109.79 117.25 114.07 116.19 119.74 116.61 104.66 105.20 99.70 107.80 109.80 113.60 109.58 Present Situation 71.53 69.21 72.59 81.38 86.24 88.15 94.18 95.56 97.67 100.85 106.46 103.39 97.04 95.40 92.40 97.90 95.30 100.40 95.66 Expectations 109.10 107.94 112.70 114.92 118.52 120.42 125.40 138.94 130.48 131.53 133.02 129.84 112.28 115.00 107.10 117.80 124.30 126.80 123.49 Palembang
Consumer Confidence Index 97.28 91.11 102.72 103.72 100.17 102.83 108.61 123.50 123.89 127.78 113.11 121.94 117.78 110.70 107.80 107.40 116.40 109.40 114.70 Present Situation 89.89 75.56 87.89 88.67 85.22 91.33 98.00 108.33 110.44 117.56 98.22 112.78 110.22 105.20 101.40 100.90 105.80 102.40 109.70 Expectations 104.67 106.67 117.56 118.78 115.11 114.33 119.22 138.67 137.33 138.00 128.00 131.11 125.33 116.20 114.10 113.90 127.10 116.30 119.70 Banjarmasin
Consumer Confidence Index 98.06 116.32 115.69 120.21 125.00 127.08 122.50 120.07 120.90 113.06 117.64 121.94 116.18 117.60 110.60 111.30 112.70 110.70 106.00 Present Situation 88.47 113.06 113.19 117.92 124.17 124.17 116.94 117.78 114.72 107.36 113.75 118.89 109.44 110.80 106.80 108.30 104.90 100.80 101.90 Expectations 107.64 119.58 118.19 122.50 125.83 130.00 128.06 122.36 127.08 118.75 121.53 125.00 122.92 124.40 114.30 114.20 120.60 120.60 110.00 BandarLampung
Consumer Confidence Index 96.25 96.92 110.50 108.83 109.25 108.75 116.25 123.33 122.17 110.67 107.25 109.25 104.58 112.90 111.50 109.10 119.60 112.20 124.60 Present Situation 78.67 83.00 99.50 103.17 84.33 88.33 96.50 106.33 107.50 93.67 95.33 92.50 92.17 91.70 96.00 94.70 104.70 98.00 112.00 Expectations 113.83 110.83 121.50 114.50 134.17 129.17 136.00 140.33 136.83 127.67 119.17 126.00 117.00 134.20 127.00 123.50 134.50 126.30 137.20 Makassar
Consumer Confidence Index 110.17 107.00 116.67 106.75 115.08 117.00 129.00 125.58 117.67 116.58 118.42 117.75 118.25 129.60 117.10 113.60 122.80 128.20 119.40 Present Situation 97.50 99.67 108.33 94.33 105.50 104.33 120.83 109.67 109.67 107.33 113.50 105.17 110.17 121.70 109.70 102.70 111.20 115.70 107.00 Expectations 122.83 114.33 125.00 119.17 124.67 129.67 137.17 141.50 125.67 125.83 123.33 130.33 126.33 137.50 124.50 124.50 134.50 140.70 131.80 Samarinda
Consumer Confidence Index 95.25 101.58 100.25 106.17 118.25 113.75 116.25 125.25 121.08 123.25 123.92 110.92 120.50 121.30 113.70 111.70 116.70 113.10 124.90 Present Situation 82.83 87.50 87.00 96.17 110.17 100.50 98.17 105.33 108.33 109.00 111.00 97.50 109.67 107.50 102.30 101.30 104.70 106.80 117.50 Expectations 107.67 115.67 113.50 116.17 126.33 127.00 134.33 145.17 133.83 137.50 136.83 124.33 131.33 135.00 125.00 122.00 128.70 119.30 132.30 Denpasar
Consumer Confidence Index 101.00 72.25 90.17 89.75 97.17 102.58 104.83 102.67 103.58 114.67 103.83 108.25 102.92 103.10 85.70 93.30 95.60 95.80 107.00 Present Situation 94.17 65.00 79.33 84.83 89.50 92.50 97.83 88.33 90.33 104.50 94.33 98.67 93.50 94.20 75.00 86.00 87.70 88.20 98.50 Expectations 107.83 79.50 101.00 94.67 104.83 112.67 111.83 117.00 116.83 124.83 113.33 117.83 112.33 112.00 96.30 100.50 103.50 103.30 115.50 Padang
Consumer Confidence Index 91.75 94.50 94.58 94.42 116.58 99.75 95.92 105.25 100.33 89.67 79.17 79.83 99.17 103.00 99.00 97.80 104.40 107.80 112.30 Present Situation 82.33 88.67 85.17 83.50 101.83 89.83 82.33 95.17 87.67 77.67 66.17 66.67 84.83 88.50 88.30 85.70 91.20 100.00 103.50 Expectations 101.17 100.33 104.00 105.33 131.33 109.67 109.50 115.33 113.00 101.67 92.17 93.00 113.50 117.50 109.70 109.80 117.70 115.50 121.00 Pontianak
Consumer Confidence Index 108.92 113.42 113.92 114.08 117.92 118.00 119.92 127.50 121.08 116.75 123.75 121.00 120.92 123.90 114.30 124.80 118.40 119.60 124.00 Present Situation 101.83 103.33 102.83 102.67 108.50 108.83 111.50 117.00 111.50 104.83 115.67 110.67 115.33 114.20 108.20 114.80 110.20 111.70 113.80 Expectations 116.00 123.50 125.00 125.50 127.33 127.17 128.33 138.00 130.67 128.67 131.83 131.33 126.50 133.70 120.30 134.80 126.70 127.50 134.20 Manado
Consumer Confidence Index 122.42 119.33 104.42 105.92 108.75 128.50 124.92 126.42 139.00 140.17 125.75 121.42 137.08 134.50 126.40 146.50 148.40 141.80 129.10 Present Situation 113.00 113.67 101.00 102.83 106.50 115.50 123.50 124.33 132.17 125.50 109.00 112.33 119.00 120.20 112.30 134.00 140.70 133.00 121.80 Expectations 131.83 125.00 107.83 109.00 111.00 141.50 126.33 128.50 145.83 154.83 142.50 130.50 155.17 148.80 140.50 159.00 156.20 150.50 136.30 Mataram
Consumer Confidence Index 84.67 99.08 115.50 115.92 118.17 114.25 116.33 123.00 125.67 122.92 112.42 121.33 102.08 113.30 114.80 115.30 127.40 113.10 120.30 Present Situation 75.33 86.17 102.17 105.67 105.83 107.17 110.17 112.00 116.33 110.17 106.67 108.33 97.50 98.30 102.20 104.00 116.30 106.80 113.30 Expectations 94.00 112.00 128.83 126.17 130.50 121.33 122.50 134.00 135.00 135.67 118.17 134.33 106.67 128.20 127.50 126.70 138.50 119.30 127.20 Pangkal Pinang
Consumer Confidence Index 97.58 92.58 100.67 108.58 97.08 101.50 112.00 110.33 101.42 102.83 104.00 106.42 108.25 98.30 109.20 108.10 115.20 117.80 126.00 Present Situation 81.83 78.00 85.67 95.17 86.00 87.33 101.83 98.67 92.33 97.17 93.83 99.67 104.00 94.50 103.00 97.80 111.00 116.50 122.00 Expectations 113.33 107.17 115.67 122.00 108.17 115.67 122.17 122.00 110.50 108.50 114.17 113.17 112.50 102.00 115.30 118.30 119.30 119.00 130.00 Ambon
Consumer Confidence Index 107.38 112.30 114.92 118.89 114.05 116.17 111.50 131.90 136.90 135.16 113.17 122.62 120.71 120.00 115.80 129.30 114.30 115.90 129.50 Present Situation 103.65 103.81 109.84 110.79 110.32 109.83 102.67 121.43 134.60 126.03 103.65 116.67 114.60 114.30 110.70 119.30 110.00 111.40 125.90 Expectations 111.11 120.79 120.00 126.98 117.78 122.50 120.33 142.38 139.21 144.29 122.70 128.57 126.83 125.70 121.00 139.30 118.60 120.30 133.20 Banten
Consumer Confidence Index 74.43 81.44 80.54 81.12 88.51 103.38 104.19 112.15 115.92 109.19 106.18 110.21 104.31 95.70 94.70 101.10 104.00 103.80 104.80 Present Situation 55.39 54.68 52.22 58.78 57.64 74.72 70.11 78.65 93.23 86.18 82.44 85.49 81.30 77.00 76.70 79.60 81.40 87.20 84.10 Expectations 93.46 108.21 108.87 103.45 119.38 132.05 138.26 145.65 138.61 132.20 129.92 134.93 127.32 114.40 112.60 122.70 126.50 120.40 125.60
2010