THE INFLUENCE OF CONSUMER PERCEPTION ON
PURCHASING ORGANIC FOOD IN MANADO
PENGARUH PERSEPSI KONSUMEN TERHADAP PEMBELIAN PRODUK
MAKANAN ORGANIK DI KOTA MANADO
Prisilia Alfa Loing
International Business Administration Program, Jurusan Manajemen,
Economics and Business Faculty, Sam Ratulangi University, Manado 95115, Indonesia Email:[email protected]
ABSTRACT
In these past decades, the awareness of health and environment issues is rapidly growing. Hence, the term of these issues has become one of the consumer concerns in purchasing organic products and it has been reflected in the increasing consumer awareness, interest, and demand on organic products. The study aim to determine the consumer perception on organic food purchasing in Manado city using a regression analysis. 200 people of Manado city who knew and concerns to purchase healthy product were rondomly surveyed as samples. The result shows the knowledge and education is significantly influenced the consumer intention to purchase organic products. These findings shows that people need to have a good knowledge about a product before they’re going to purchase it.
Keywords: Consumer Behavior, Consumer Perception, Purchasing Intention, Organic Food.
ABSTRAK
Dalam decade terakhir, kesadaran akan masalah kesehatan dan lingkungan berkembang pesat. Oleh karena itu, istilah dari masalah tersebut telah menjadi salah satu perhatian konsumen dalam pembelian produk organik dan juga berpengaruh dalam peningkatan kesadaran konsumen, minat dan permintaan pada produk organik. Tujuan dari sudi ini adalah untuk menentukan persepsi konsumen terhadap pembelian makanan organik di Manado dengan menggunakan metode penelitian Regresi Logistik. Dimana populasi yang diamati adalah penduduk Manado yang tahu tentang produk organik dan yang memperhatikan pembelian produk yang sehat dengan sampel sebanyak 200 responden dengan menggunakan convenience sampling. Hasil dari studi ini menunjukan bahwa pengetahuan dan pendidikian terhadap makanan organik secara signifikan memperngaruhi niat konsumen untuk membeli produk organik. Hasil ini menunjukan bahwa setiap orang harus mempunyai pengetahuan yang baik tentang sebuah produk sebelum membelinya.
1. INTRODUCTION
Research Background
The consumer awareness of Health and environmental issues is increased in these recent years. According to WHO data in 2006 that was cited in Australian Institute of Health and Welfare Report in 2011 it is estimated that 24 percent of the global burden of disease and 23 percent of all deaths were due to modifiable environmental factors. Disease with the largest absolute burden from environmental exposure included diarrhea, lower respiratory infections and malaria. These issues make the food consumption of people also changing. People were influenced by the quotation that everything that comes from nature is good. Siro,et al(2008) cited by Lutfhan,et al.(2014) wrote that the people come to believe that the food that they consume is contributed to their health. Therefore the consumer start to look for the product that will benefit their health without causing much damage to the environment and the marketers start to think of developing products that is environmentally friendly and healthy.
In the education sector, the growing awareness about health and environmental addressed by various program from the school or college such asUsaha Kesehatak Sekolah (UKS)and Eco-Campus (Hanifah,et al.,2014). The consumers are not only increasingly aware of the potential risk from poor diets but also taking more responsibility in optimizing their own health. Consumer product producers and food retailer alike are according greater importance to organic and natural foods and beverages to meet growing demands. And there are many of the entrepreneur that applying the environmental issues as one of their marketing strategy (Asrianto, 2013). When talking about a product that pays attention to health and environment issues, the first thought is always organic food. According to Pracaya (2007), cited by Asnah, et al. (201) the general understanding about organic food is any kind of regular organic products that developed with a special organic farming techniques and the types of plants is very sensitive to pests and diseases therefore it needed a special treatment or techniques o cultivate organic products. A larger part of organic agriculture involves the health of the soil and of the ecosystem in which crops and livestock are raised.
As organic food has became increasingly more popular, there is so much debate about whether the organic products are any healthier than conventional products. Lydia Z., 2014 cited in her article in which the research, led by Newcastle University and published in the British Journal of Nutrition’s, found concentration of antioxidants such as polyphenolics that were 18 to 69 percent higher in organic food. Antioxidants are beneficial because they neutralize free radicals, the unstable molecules that are created in the body by normal chemical reactions, by adding an electron to stabilize them. The research suggest that switching to eating organic fruits, vegetables and cereals provide consumers 20 to 40 percent more antioxidants, which would be equivalent to eating between one to two extra servings of fruit and vegetables a day. Some studies about the consumer behavior to purchase organic food are seek to identify the factors that influence the behavior of the consumers to purchasing decision and many of them try to explore more of the variables that might have influence the purchasing decisions (Tony, 2013). Therefore, in this research study will be more discusses about the organic product types of fruit and vegetables.
Research Objectives
The objectives of this research are as follows:
1. To analyze the influence of health concerns on purchase intention.
Literature Reviews
Consumer Behavior
Consumer Behavior is the study of the processes involved when individuals or group select, purchase, use, or dispose a products, services, ideas, or experiences to satisfy needs and desires (Solomon, 2011). Consumer behavior reflects the totally of consumers decisions with respects to the acquisition, consumption and disposition of goods, services activities, experiences, people and ideas by (human) decision making units (over-time) (Hoyer and Maclnnis, 2008).
Consumer Perception
Perception is the process by which we organize and select information received through senses and give meaning to the objects in the world around us. This is done by our brain. Sensation refers to the immediate response of our sensory receptors (eyes, ears, nose, mouth, fingers) to basic stimuli such as light, color, sound, odor, and texture. Perception is the process by which people select, organize and interpret these sensations (Solomon, 2011).
Consumer Purchase Decision Making
A consumer purchase is a response to a problem. A person may literally spend days or weeks agonizing over an important purchase, such as a home, a car, or even Mac versus PC (Solomon, 2011). These intensive decision-making processes get even more complicated in today’s environment where there are so many choice of product. People has to choose what are they most need, also with certain consideration such as price, quality, and even product that concerns about the health and environmental issues.
Organic Food
Organic is defined as a fertilizer or manure: produced from natural substances, usually without the addition of chemicals in the Oxford English Dictionary (Oxford English Dictionary, 2007, cited by Suh, 2009).
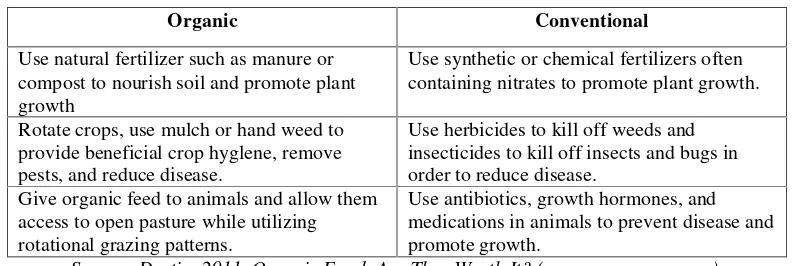
Table 1. Organic Food vs Conventional Food
Organic Conventional
Use natural fertilizer such as manure or compost to nourish soil and promote plant growth
Use synthetic or chemical fertilizers often containing nitrates to promote plant growth.
Rotate crops, use mulch or hand weed to provide beneficial crop hyglene, remove pests, and reduce disease.
Use herbicides to kill off weeds and insecticides to kill off insects and bugs in order to reduce disease.
Give organic feed to animals and allow them access to open pasture while utilizing rotational grazing patterns.
Use antibiotics, growth hormones, and medications in animals to prevent disease and promote growth.
Source: Dustin, 2011. Organic Food; Are They Worth It? ( www.vegsource.com).
emphasizes the use of management practices that prefer the use of local inputs, with the awareness that local regional state does require locally adapted systems. An organic food production system is designed to develop biodiversity in the system as a whole; Increase the biological activity of the soil; Maintaining the soil fertility in the long term; Recycle wastes that derived from plants and animals to return nutrients to the soil to minimize the use of non-renewable resources; Rely on renewable resources in agricultural systems that locally run; Promote the use of soil, water and healthy air, as well as to minimize all forms of pollution produced by the agricultural practices; Deal with agricultural products with emphasis on the careful treatment to maintain the organic integrity and quality of the products on the entire stage, and; Can be applied on all agricultural land available through a conversion period, where the time is determined by the site specific factors such as the history of the land and the type of plant and animal production.
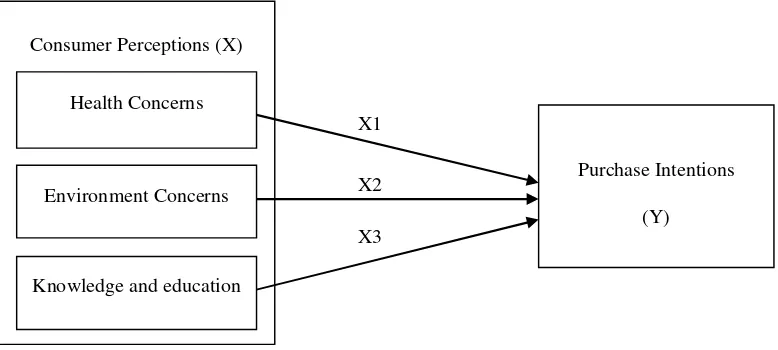
In organic Farming, the aim is to support and strengthen biological process without resource to technical cures such as synthetic fertilizers and pesticides and the genetic modification of organism (Suh, 2009). Based on the table 1, it is shown that instead of synthetic pesticides or fertilizers, organic farmers rely on biological diversity in the field no naturally reduce pest organism. Dustin (2011) on his article in vegsource.com said that people with allergies to foods, chemicals, or preservatives often find their symptoms lessen or go away when they eat only organic food. The figure below shows the variables of research that are used in this study. It is in the form of conceptual framework or model thinking (conceptual model) which become model of empirical research and serves as a guideline in conducting the further research and presented in the form of a flowchart. This flowchart shows a casual relationship between consumer perception and the purchase intention toward the organic food.
Figure 1. Conceptual Framework Source: Data Processed, 2015
2. RESEARCH METHODS
Type of Research
This research is a type of Causal Research where it will investigate the consumer perception towards the intention to purchase organic food. Causal research is an investigation into an issue or topic that looks at the effect of one thing or variable on another (Business Dictionary, 2013). The title of this research tells clearly about where the study was conducted, that is in Manado, while the time of this research is between February to July 2015.
Consumer Perceptions (X)
X2
X3 X1 Health Concerns
Environment Concerns
Purchase Intentions
(Y)
Population and Sample
Sekaran and Bougie (2010) explained about the population that refers to the entire group of people, events, or things of interest that the researcher wishes to investigate. While sample is a subset of the population. It comprises some members selected from it. This research will be using Roscoe (1975) rules of thumb that were cited by Sekaran and Bougie, (2010) that sample sizes larger than 30 and less than 500 are appropriate for most research. Sample covariate matrix S only positive-define when the sample size higher than number of indicator, this is the basic assumption on Structural Equation Model (SEM). And since this research has 15 survey items, the ideal sample size would be 150 samples for the actual testing phase. This suggested that researchers using SEM need to go beyond the minimum amount of the proposed sample size to ensure unbiased result (Phaik, et al., 2014). Therefore in this research, the population that is mainly observed is the citizen in Manado who knows and concerns to consume organic food with the sample of this research is 200 respondents. And the sampling design that will be used is non-probability sampling, convenience sampling or accidental sampling. Sekaran and Bougie (2010) explained about convenience sampling that refers to the collection of information from members of the population who are conveniently available to provide it. Suprapto and Wijaya (2012) cites Shao (2002) that this sampling method is often used by researchers in order to reduce the cost of sampling or even limited time.
Data Collection Method
The data collection method in this research is conducted with two sources of data:
1. Primary Data. The primary data in this research is the data that is found and originated by the researcher specifically to address the researcher problem through the questionnaires. 2. Secondary Data. The secondary data in this research is the data that the researcher collected
from the other resources such as journals, report, textbook, dissertation, and thesis from various sources and the other relevant literature from the internet for the purpose of supporting data in this research.
Data Analysis Method
The data that is collected from the respondents through the questionnaires using the dichotomous scale for the dependent variable which is coded to 0 and 1 and Likert scale for the independent variable as a widely used rating scale that requires the respondents to indicate a degree of agreement and disagreement varying from 1 to 5 (highly disagree to highly agree). To test the model and relationship that developed in this study research, the analysis technique is required. The hypothesis test in this study will be conducted with logistic regression analysis. Logistic regression was used in this study research because the combination of independent variables between metric and nominal (non-metric). In logistic regression does not need the assumption of normality of data on the independent variable.
Validity and Reliability Tests
Logistic Regression
Logistic regression is used when the dependent variable is nonmetric. Which is has a dummy variable for the dependent variable that coded 0 or 1. Logistic regression allows the researcher to predict a discrete outcome, such as “will purchase the product/will not purchase the product”, from a set of variables that may be continuous, discrete or dichotomous (Black, 2008). When using logistic distribution, we need to make an algebraic conversion to arrive at our usual linear regression equation (which we have written as Y =Y = B0+ B1X + e).
Ln = + + +
Where:
p = Consumer Intention to Purchase X1 = Health Concerns
X2 = Environment Concerns
X3 = Knowledge and Education
3. RESULTS AND DISSCUSSION
Characteristics of the Respondents
There are total of 200 respondents that took part in this research study although there are few errors that found in the data where the respondents denied to fills a personal information of his or her but the primary data shown that most of the respondents is female and single, and most of them is 21 years old and above and many of the respondents last education is high school and most of them has income scale from one million rupiah per month and above. With this characteristic of the respondents that most of them is aged 21 years and above, have enough income and educated, the concerns of what kind of food that they will eat also high. And it is expected to represent the appropriate data that is needed in this research.
Validity and Reliability of the Research
The test of validity in this research is to see whether the instruments used are valid. Pearson correlation tests were used to examine the individual relationship between the independent variables and the dependent variable. From the result of the correlation from every variable it is indicated that there are view of question that not valid because the significance level of the question is above 0.05 (5%), but after the not valid question is removed the result shown that the data is valid because the significance level is less that 0.05 (5%) so the data is considered to be valid. Also it is shown in the table of Item-Total Statistic in the Corrected Item-Total Correlation column that the value of some question is smaller than the value from r table with degrees of freedom (DF) is N-2 = 198 with the level of significant of 5% which is 0.116. The questions that considered not valid are question number 4, 6, 9, and 14. And so the researcher have to do a re-test after removing the questions that not valid, and the result is all the question is considered to be valid because the value that shown in the Corrected Item-Total Column is smaller than the cut off value or 0.1166 value from the r table.
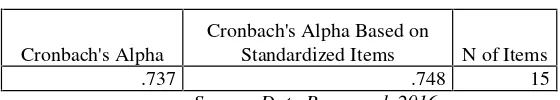
Table 2. Reliability Statistics
Cronbach's Alpha
Cronbach's Alpha Based on
Standardized Items N of Items
.737 .748 15
From the result for reliability analysis in this research study, that is shown in the table 2. The Cronbach Alpha value is .737 with the total N of items is 15 which is bigger than 0.60. This result means that the variable that is used in this study is acceptable or reliable. The results shows that the value of Cronbach’s Alpha for every variable has the average of 70% which is mean the value more than 60% of the standardof the Cronbach’s criteria value. The value of Cronbach’s Alpha which is have the average of 70% indicated that the respondents answer the question on the questionnaire consistently and also indicated that the instrument of the data is acceptable or reliable.
Logistic Regression Result
The logistic regression is also called a logit model which has dichotomous variable in the outcome or in the dependent variable. Two values of the dependent variable that are predicted is “1” and “0, in this research coded“1 = Yes or want to purchase” and “0 = No or do not want to purchase” since the dependent variable is the intention to purchase. The classification table shows the overall percentage from the all the respondent that intended to purchase the organic food is 77.9 percent which is good, and from the comparison between the two values indicated that there is no problem of homoscedasticity which means a situation in which the variance of the dependent variable is the same for all the data.
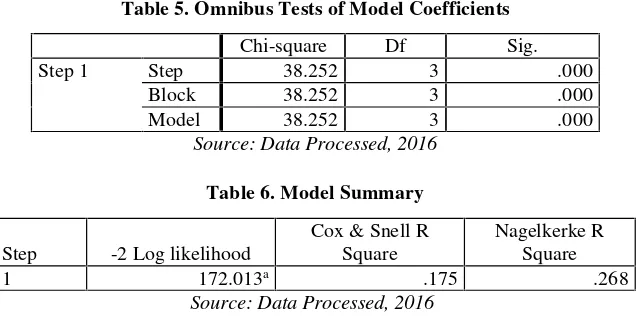
In the table 4 of Iteration History in Block 1 above shows when the independent variable is mixed into the model: N=200. Degree of freedom (DF) = N–the number of independent variable–1 = 200–3–1 = 196. From the chi-square distribution table the value of DF=196 with the probability of 0.05 is 229.663. The value from the -2 Log Likelihood (172.013) < the value from chi-square table (229.663) which means accepted the Ho, this is shows that the model is fit with the data. And it can also be seen in the table 5. on the sig. column that the significant level is less than 0.05 (5%) that means the addition of the independent variable gives an influence to the model or in other words the model is fit with the data. And from the model summary table, it can be seen that the value of Nagelkerke R is 0.268 and value of Cox & Snell R is 0.175 this indicates that the variability of the dependent variable (Purchase Intention) that can be explained by the variability of the independent variable is 26.8% while the remaining 73.2% is explained by the other variable beside the three predictor variable that used in this research.
Table 3. Classification Tablea,b
Observed Predicted
Purchase Intention Percentage Correct No Yes
Step 0 Purchase Intention No 0 44 .0
Yes 0 155 100.0
Overall Percentage 77.9
Source: Data Processed, 2016
Table 4. Block 1: Iteration Historya,b,c,d
Iteration
-2 Log likelihood
Coefficients
Constant HC_X1 EC_X2 KE_X3 Step 1 1 178.934 -4.965 .082 .089 .229
2 172.293 -7.274 .112 .142 .327 3 172.014 -7.854 .118 .158 .350 4 172.013 -7.887 .118 .159 .352 5 172.013 -7.887 .118 .159 .352
Table 5. Omnibus Tests of Model Coefficients
Chi-square Df Sig. Step 1 Step 38.252 3 .000
Block 38.252 3 .000 Model 38.252 3 .000
Source: Data Processed, 2016
Table 6. Model Summary
Step -2 Log likelihood
Cox & Snell R Square
Nagelkerke R Square
1 172.013a .175 .268
Source: Data Processed, 2016
The Hosmer and Lemeshow Test is a test of Goodness of Fit Test (GoF), which is a test to determine whether the model established is right or not. It is said to be appropriate if there is no significant difference between the models with the observation value. From the table 7. it is shown that the sig. 0.137 is bigger than alpha 5% (0.05) which the Ho is accepted and statistically there are no significant differences between the model and the observation value and so the model is fit with the data. Or it can also be proved by comparing the value of chi-square in the Hosmer and Lemeshow Tests and the value in the chi-square table of distribution. The value of DF = 8 with the 5% of the significance level is 15.507 which is bigger than 12.337 or the value of chi-square that is shown in the table 7. which means the data is valid or the model is fit with the data. Next, in the table of Variable in the equation shows the value of the estimated coefficient regression model as follows:
Ln = = -7.887 + 0.118 x1+ 0.159 x2+ 0. 352x3
Also, can be shown in the table that the probability value (p-value) which is shown in the Sig column, where if the p-value is smaller than the level that has already been set which is 0.05 can be interpreted that the X3 variable or knowledge and education variable is significantly affect the Purchase Intention (0.007 < 0.05) while the other two variable is not significantly affect the Purchase Intention. Therefore because the independent variable of X1 and X2 did not have significant influence to the purchase intention so only the variable of X3 or the education and knowledge variable that will be included in the model as follows:
Ln = = -7.887 + 0. 352x3.
Table 7. Hosmer and Lemeshow Test
Step Chi-square Df Sig.
1 12.337 8 .137
Source: Data Processed, 2016
Table 8. Variables in the Equation
B S.E. Wald Df Sig. Exp(B) Step 1a X1 .118 .126 .887 1 .346 1.126
X2 .159 .186 .731 1 .393 1.173 X3 .352 .130 7.351 1 .007 1.421 Constant -7.887 1.783 19.566 1 .000 .000
Discussion
From the result of the Regression Logistic above the Odds Ratio can be interpreted as follows: 1. H1- Health Consciousness (X1) to Purchase Intention (Y). From the test result the Health
Consciousness (X1) has positive influence to the purchase intention. The result shows that the significance level is 0.346 which means that the health consciousness have positive influence but did not have significant influence to the purchase intention of consumer in this case the intention to purchase organic food which means there are only a little concerns about health that can influence the purchasing intention of the consumer. From the ExP (B) value or the Odds Ratio (OR) that is 1.126 means that when it comes to health the probability or the chance of the consumer to buy organic food is 1.126 higher than to buy the conventional food.
2. H2–Environmental Concerns (X2) to Purchase Intention(Y). The result that shows in the
table 4.14 can be interpreted that the environmental concerns (X2) also have positive influence to the purchase intention. But the value is not enough to significantly influence the consumer intention to purchase. The data shows that the sig. value 0.393 is bigger than the 0.05 so the environmental concerns did not significantly influenced the consumer intention to purchase organic food. And from the Odds Ratio (OR) can be interpreted that to the consumers that cares about the environmental their intention to buy organic food 1.173 higher than to buy conventional food.
3. H3–Knowledge and Education (X3) to Purchase Intention (Y). The result from the table
above shows that the Knowledge and Education variable (X3) have positive influence to the purchase intention where the significance level is 0.007 which is smaller than 5% (0.05) which means that the Knowledge and Education have significance influence to the Purchase Intention (Y) and from the Odds Ratio it can be seen that the consumer that have knowledge and education will have the intention to purchase organic food 1.421 higher than to purchase conventional food.
4. CONCLUSIONS
From this research of The Influence of The Consumer Perception to Purchase Organic Food in Manado can be concluded as follows:
1. Even though the Health is very important but the Health Consciousness did not significantly influence the purchase intention of the consumer to buy organic food. There are many people that have the thinking that their health is important but did not take the real action and have started to change their lifestyle. The research shows that the Health consciousness even though has positive impact but the data shows that there are not enough numbers to significantly influence the purchase intention. It might be caused by the low education about the importance of the organic food or the income level of the consumers. Because the organic food tends to be more expensive from the conventional food and from the result of the respondents that took part in this result, there are so many respondents that have income level below one million rupiah.
2. The concerns level about the environment in Manado is still few especially from the knowledge of the fact that consuming organic food is good for the environment. It can be caused because of the low knowledge of the goodness of consuming organic food to the environment and also how it produced.
From the result of this research the people in Manado is very aware about their health and the environmental but still refuse to buy organic food and it also proved from this research that it is important for the consumers to have knowledge and education about the food that they consume and from the result that the knowledge and education of how the organic food is important for the health and the environment is very low it is recommended that:
1. The government to organize or carry out seminars to the public related the organic food and the importance to health and environment and how it is produce. So the people are more aware about the healthiness about the food that they consume.
2. And for the entrepreneur that sells organic food to pay more attention about how to market their product to be more interesting in the consumer eye. Since the global warming issue is the hot topic nowadays, the entrepreneur can have this chance to advertise their product using the terms of environment and the healthiness about the product that they sell.
REFERENCES
Papers on Journals
[1] Lutfhan, H. P., and Mukhamad, N., 2014. Analisis Kesedian Membaway (Willingness to Pay) Sayuran Organik dan Faktor-Faktor yang Mempengaruhinya. Jurnal Manajemen dan Organisasi 5(1), April 2014.
[2] Hanifah, K., and Ahmad, R., 2014. Penyusunan Strategi Pemasaran Berdasarkan Perilaku Konsumen Dalam Pembelian Sayuran Segar (Studi Kasus: Proyek Penelitian Eco Urban Farming ITS Surabaya).Jurnal Teknik, 2014.
[3] Asriannto, B., 2013. Green Marketing dan Corporate Social Responsibility Pengaruhnya Terhadap Keputusan Pembelian Konsumen Melalui Minat Memberli Produk Organik di Freshmart Kota Manado.Jurnal EMBA. 1(4) December 2013.
[4] Asnah, Heriyanto, Dina, M.,2015. Analisis Persepsi Masyarakat Terhadap Keputusan Pembelian Produk Sayur Organik Di Kota Palembang.
[5] Tony, W., 2013. Anteseden Perilaku Beli Produk Ramah Lingkungan: Studi Perilaku Konsumen Makanan Organik.PEB 7 (3), 2013.
[6] Suprapto, B., and Wijaya, T., 2012. Model of Consumers Buying Intention towards Organic Food: A Study Among Mothers in Indonesia. International Conference on Economics, Business and marketing Management IPEDR, 29 (2012).
Books
[7] Solomon, M. R., 2006.Consumer Behavior: Buying, Having and Being,9thedition. Pearson.
[8] Hoyer, D. W., and Maclnnis, J. D., 2008.Consumer Behavior, 5thedition.South-Western. [9] Sekaran, U., and Bougie, R., 2010.Research Method for Business,5thedition. Wiley.
Dissertation
[10] Suh, B. Won., 2009.Factors Influencing Consumers Perceptions, Intention to Purchase and realized Purchase behavior for Organic Food in South Korea. A Dissertation Submitted in Fulfillment of The Requirements for The Award of The Degree of Doctor of Philosophy, University of Surrey, England.
Internet Articles
[11] Business Dictionary, 2013. Available on: http://www.businessdictionary.com/definition /causal-research.html. Retrieved on August 20, 2013.
[1] Lydia Z., 2014. Study finds organic foods have more benefit. Available on: http://www.foodsafetynews.com/2014/07/study-finds-organic-foods-have-more benefits/ #.V-oiIfk2vIX. Retrieved on September 28, 2016.
[1]Badan Standar International (BSN)., 2002. Sistem Pangan Organik. SNI-01-6729-2002. (In Indonesia).