JATISI
Volume 3 Nomor 1
Halaman 1
–
84
Pengenalan Wajah Menggunakan Two DimensionalLinear DiscriminantAnalysis Berbasis Optimasi
Feature Fusion Strategy
Sahmanbanta Sinulingga, Chastine Fatichah, Anny Yuniarti
The Modeling of Information Security Classification With Risk Value Assesment Factor to Good
Information Governance on The Indonesia Higher Education Sector
IGN Mantra
Process Capability Model Based on COBIT 5 Assessments (Case Study)
Johanes Fernandes Andry
Kriptografi Menggunakan Hybrid Cryptosystem dan Digital Signature
Halim Agung, Ferry
Analisis Penerimaan Layanan
Web Tracking
dengan Penerapan
Technology Acceptance Model
(TAM)
Dien Novita, Della Oktaviany
Pengaruh Pemanfaatan Kelas Elektronik Terhadap Efektifitas dan Efisiensi Proses Belajar STMIK
XYZ
Dicky Pratama, Hendri Sopryadi
Analisis dan Perancangan Sistem Pendukung Keputusan Pemberian Bonus Tahunan Karyawan
dengan Metode SAW pada PT. XYZ
Triyana Widya Ningrum, Sherly Valentina, Dafid
Volume 3, Nomor 1, September 2016
Terbit dua kali setahun pada bulan Maret dan September, Jurnal Teknik Informatika dan
Sistem Informasi (JATISI) merupakan media penyampaian hasil penelitian untuk semua
bidang yang ada pada rumpun teknik informatika dan sistem informasi, diharapkan hasil
penelitian yang ada pada jurnal ini dapat menjadi penghubung antara peneliti dan pihak yang
berkepentingan. E-ISSN 2503-2933 dengan versi cetak ISSN 2407-4322, diterbitkan pertama
kali pada tahun 2014
KETUA PENYUNTING
Gasim
DEWAN PENYUNTING
Gasim
Teguh Bharata Adji
Samsuryadi Sahmin
Achmad Nizar Hidayanto
Ermatita
STAF AHLI (MITRA BESTARI)
Bernard Renaldy Suteja
Aji prasetya wibawa
Hermawan Syahputra
Andi Wahju Rahardjo Emanuel
Bambang Sugiantoro
TATA USAHA
Yulistia
Mulyati
Usniawati Keristin
Nur Rachmat
PENANGGUNG JAWAB
Ketua STMIK Global Informatika MDP, Johannes Petrus, S.Kom., M.T.I
PENERBIT
Lembaga Penelitian dan Pengabdian pada Masyarakat (LPPM) STMIK Global Informatika
MDP bekerjasama dengan IndoCEISS (Indonesian Computer, Electronics and
Instrumentation Support Society)
ALAMAT PENYUNTING & TATA USAHA
Gedung STMIK GI MDP, Jalan Rajawali No. 14 Palembang 30113
Telp. 0711-376400, Fax. 0711-376360,
Website : http://jatisi.mdp.ac.id, Email : [email protected]
BERLANGGANAN (Versi Cetak)
KATA PENGANTAR
Puji syukur kehadirat Tuhan YME atas berkat rahmat dan karunia-Nya sehingga majalah ilmiah Jurnal Teknik Informatika dan Sistem Informasi (JATISI) dapat terbit sebagaimana direncanakan.
Sebagai tenaga profesional, dosen memiliki kewajiban mengajar, meneliti, dan pengabdian pada masyarakat. Setiap hasil penelitian sebaiknya dipublikasikan untuk memberi tahu kepada masyarakat luas tentang hasil penelitiannya.JATISI diharapkan dapat menjadi wadah bagi para dosen untuk mempublikasikan hasil penelitiannya, dan menjadi sarana untuk penyebaran ilmu pengetahuan di bidang teknik informatika dan sistem informasi secara berkelanjutan. JATISI juga diharapkan menjadi pertemuan antara dunia penelitian dan dunia industri yang tertarik terhadap hasil penelitian.
JATISI bekerja sama dengan IndoCEISS dalam pengelolaannya. IndoCEISS merupakan wadah bagi para ilmuwan, praktisi, pendidik, dan penggemar dalam bidang komputer, elektronika, dan instrumentasi yang menaruh minat untuk memajukan bidang tersebut di Indonesia.
JATISI diterbitkan 2 kali dalam setahun (September dan Maret), makalah yang diterbitkan JATISI minimal terdiri dari 60% dari luar Sumatera Selatan, dan 40% dari Sumatera Selatan. Makalah yang diterbitkan melalui tahap review oleh reviewer yang berpengalaman dan sudah memiliki makalah yang diterbitkan di jurnal internasional yang terindeks SCOPUS.
Kami mengucapkan terima kasih kepada para peneliti yang telah mengirimkan hasil penelitiannya untuk diterbitkan di JATISI, kepada para mitra bestari yang sudah meluangkan waktu guna mereview makalah yang kami ajukan, kepada Yayasan Multi Data Palembang yang mendukung penuh atas pengelolaan jurnal ini, dan kami mengucapkan kepada semua pihak yang tidak dapat kami sebutkan satu persatu.
Ketua Redaksi JATISI,
DAFTAR ISI
Pengenalan Wajah Menggunakan Two DimensionalLinear DiscriminantAnalysis Berbasis Optimasi Feature Fusion Strategy
Sahmanbanta Sinulingga, Chastine Fatichah, Anny Yuniarti
1-11
The Modeling of Information Security Classification With Risk Value
Assesment Factor to Good Information Governance on The Indonesia
Higher Education Sector
IGN Mantra
12-22
Process Capability Model Based on COBIT 5 Assessments (Case Study)
Johanes Fernandes Andry
23-33
Kriptografi Menggunakan Hybrid Cryptosystem dan Digital Signature
Halim Agung, Ferry
34-45
Analisis Penerimaan Layanan
Web Tracking
dengan Penerapan
Technology
Acceptance Model
(TAM)
Dien Novita, Della Oktaviany
46-60
Pengaruh Pemanfaatan Kelas Elektronik Terhadap Efektifitas dan Efisiensi
Proses Belajar STMIK XYZ
Dicky Pratama, Hendri Sopryadi
61-72
Analisis dan Perancangan Sistem Pendukung Keputusan Pemberian Bonus
Tahunan Karyawan dengan Metode SAW pada PT. XYZ
Triyana Widya Ningrum, Sherly Valentina, Dafid
73-84
Pedoman Penulisan Makalah JATISI
85
Jatisi, Vol. 3 No. 1 September 2016 1
Pengenalan Wajah Menggunakan Two DimensionalLinear
DiscriminantAnalysis Berbasis Optimasi Feature Fusion
Strategy
Sahmanbanta Sinulingga*1, Chastine Fatichah2, Anny Yuniarti3
1,2,3Jurusan Sistem Informasi, Fakultas Teknologi Informasi, Institut Teknologi Sepuluh
Nopember Surabaya, Kampus Keputih, Sukolilo Surabaya 60111 Telp : (031)5999944, Fax : (031) 5964965
e-mail: *1[email protected], 2[email protected], 3[email protected]
Abstrak
Era teknologi dewasa ini, penelitian mengenai citra biometric bukanlah hal yang awam dilakukan. Salah satu citra biometrik yang sering diteliti adalah face recognition (pengenalan wajah). Permasalahan pada pengenalan wajah manusia adalah adanya keanekaragaman fitur atau bentuk antara satu wajah dengan wajah lainnya. Oleh karena itu, perlu adanya ekstraksi fitur dan klasifikasi wajah menggunakan metode tertentu sehingga klasifikasi tersebut dapat dikenali dengan benar.Pada penelitian ini diusulkan metode ekstraksi fitur yang dapat mengatasi permasalahan non-linear data secara automatic yang terdapat pada citra wajah yang dinamakan dengan Two Dimensional Linear Discriminant Analysis based on Feature Fusion Strategy (TDLDA-FFS). Tidak berhenti pada ekstraksi fitur, diusulkan juga metode klasifikasi wajah yang dapat mengatasi permasalahan adaptive matrix yang bertujuan untuk mempelajari kepentingan bobot pada masing – masing input dengan metode Generalized Relevanced Learning Vector Quantization (GRLVQ).Penelitian ini mengintegrasikan metode TDLDA-FFS dan GRLVQ untuk pengenalan wajah. Dengan kombinasi kedua metode tersebut terbukti dapat memberikan hasil yang optimal dengan tingkat akurasi pengenalan yang berkisar diantara 77,78 % sampai dengan 82,22% dengan uji coba menggunakan basis data citra wajah dari Institut Bisnis dan Informatika Stikom Surabaya. Sedangkan ujicoba menggunakan basis data yang berasal dari YaleB Database mencapai tingkat akurasi yang berkisar antara 88.89% sampai dengan 94.44%.
Kata kunci : Non-linier data, adaptive matrix, TDLDA, FFS, GRLVQ.
Abstract
JCCS Vol. x, No. x, July201x : first_page–end_page
of facial images from the Institute of Business and Information Stikom Surabaya. While the test uses a database derived from YaleB Database achieve accuracy levels ranging from 88.89% to 94.44%.
Keywords : Non-linier data, adaptive matrix, TDLDA, FFS, GRLVQ
1. PENDAHULUAN
erkembangan ilmu pengetahuan dan teknologi telah memberikan dampak yang sangat besar dalam kehidupan manusia. Dengan adanya teknologi berbagai permasalahan di dunia nyata dapat diselesaikan melalui teknologi tersebut. Teknologi yang dikembangkan saat ini adalah teknologi komputer yang dapat diaplikasikan di berbagai bidang diantaranya kesehatan, keamanan data, pendidikan, biometrik, dan lain-lain. Salah satu bidang biometrik yang banyak diteliti oleh banyak pakar adalah wajah [1].
Wajah merupakan salah satu biometricnon-intrusive dan tidak bergantung pada resiko kesehatan. Teknologi biometrik dalam pengenalan wajah merupakan bahasan yang menarika beberapa tahun terakhir ini. Pada setiap wajah manusia terdapat pola-pola yang berbeda. Perbedaan tersebut disebabkan karena adanya berbagai faktor yang dapat mempengaruhi dari masing-masing wajah tersebut. Oleh karena itu, perlu adanya pengenalan wajah manusia menggunakan algoritma tertentu sehingga wajah-wajah tersebut dapat dikenali dengan benar.
Berbagai penelitian terkait telah dilakukan dalam klasifikasi wajah manusia dengan algoritma yang berbeda [2-3]. Dalam sistem pengenalan wajah tahapan ekstraksi fitur merupakan tahap yang perlu diperhatikan. Salah satu metode dalam ekstraksi fitur adalah metode Two-Dimensional Linear Discriminant Analysis (TDLDA). Metode TDLDA merupakan pengembangan dari metode Linear Discriminant Analysis (LDA), dan metode LDA sendiri merupakan penyempurnaan dari metode Principal Component Analysis (PCA). Metode PCA diperkenalkan oleh Turk dan Pentland pada tahun 1991. Metode tersebut bertujuan untuk memproyeksikan data pada arah yang memiliki variasi terbesar, yang ditunjukkan oleh vektor eigen yang bersesuaian dengan nilai eigen terbesar dari matriks kovarian. Disamping itu juga bertujuan untuk mereduksi dimensi dengan melakukan transformasi linier dari suatu ruang berdimensi tinggi kedalam ruang berdimensi rendah. Kelemahan dari metode PCA adalah kurang optimal dalam pemisahan antar kelas [4].
Metode LDA pertama sekali diperkenalkan oleh Cheng (1991). Metode ini mencoba menemukan sub ruang linier yang memaksimalkan perpisahan dua kelas pola menurut Fisher Criterion. Hal ini dapat diperoleh dengan meminimalkan matrik sebaran dalam kelas yang sama dan memaksimalkan jarak matrik sebaran dalam kelas yang berbeda. Jika dimensi data jauh lebih tinggi daripada jumlah sample training, maka sebaran kelas yang sama menjadi singular. Hal ini merupakan kelemahan dari metode LDA [5]. Metode TDLDA menilai secara langsung matrik sebaran kelas yang sama dari matrik citra tanpa transformasi citra ke vektor, dan hal ini dapat mengatasi singular problem dalam metode LDA. Perbedaan yang paling menonjol antara metode LDA dengan metode TDLDA yaitu metode TDLDA bekerja dengan cara merepresentasikan image ke dalam matrik secara langsung Sedangkan metode LDA bekerja dengan cara merepresentasikan image ke dalam vektor. Metode TDLDA dapat meminimalkan kebutuhan memori dan kompleksitas waktu dibandingkan dengan metode LDA [6].
Jatisi, Vol. 3 No. 1 September 2016 3
yang bersifat non-linier. Salah satunya adalah metode Feature Fusion Strategy (FFS). Menurut Chen, secara umum ekstraksi fitur dalam pengenalan wajah terbagi menjadi 2 (dua) yaitu fitur global dan fitur lokal. Fitur global sangat baik dalam mengatasi perubahan fitur-fitur linier, sedangkan fitur lokal sangat baik dalam mengatasi perubahan fitur-fitur non-linier. Pada penelitiannya penggabungan fitur global dan fitur lokal pada wajah manusia membantu dalam mendapatkan fitur-fitur yang bersifat euclidean structure dan manifold structure secara simultan. Pada pembentukan criterion function FFS dapat dilakukan secara manual [8] dan automatic [9]. Penentuan secara manual parameter criterion function FFS membutuhkan time-consuming yang lebih lama karena dilakukan secara iterative (berulang). Sedangkan penentuan secara automatic parameter criterion function FFS dioptimasi melalui teknik cross-iterative sehingga tidak terjadi time-consuming yang banyak. Secara intuisi, penggunaan fungsi optimasi FFS ke dalam TDLDA dimungkinkan dapat meningkatkan keakurasian pengenalan wajah.
Berdasarkan penjelasan yang dipaparkan, maka pada penelitian ini mengusulkan metode TDLDA berbasis fungsi optimasi FFS sebagai ekstraksi fitur dalam meningkatkan keakurasian pengenalan wajah. Tingkat akurasi pengenalan wajah manusia akan diujikan dengan menggunakan database yang beasal dari Stikom Surabaya dan YaleB Database untuk memvalidasi sistem. Tingkat akurasi tersebut akan dibandingkan antara metode TDLDA yang menggunakan fungsi optimasi FFS dengan metode TDLDA biasa.
2. METODE PENELITIAN
Penelitian ini mengevaluasi performa pengenalan wajah menggunakan metode ekstrasi TD-LDA berbasis FFS serta beberapa metode ekstrasi TD-LDA-Fisher. Database wajah yang digunakan dalam penelitian ini berasal dari sistem parkir Institut Bisnis dan Informatika Stikom Surabaya dan YaleB Database yang ada pada Internet.
2.1. Sampel Database Wajah
Data uji coba yang digunakan pada penelitian ini berasal dari Institut Bisnis dan Stikom Surabaya. Data uji coba tersebut berupa citra wajah yang diambil dari parking information sistem yang dimiliki oleh Stikom Surabaya. Pemilihan data dilakukan secara acak tanpa memperhatikan resolusi, pose, illumination, dan ekspresi dari objek citra. Untuk memvalidasi tentang kebenaran logika sistem terhadap data yang diujicobakan, maka ditambahkan data uji coba sistem yang berasal dari internet. Data citra tersebut adalah data yang berbeda dengan data real-time yang didapatkan dari Stikom Surabaya.
Banyaknya data yang akan digunakan pada penelitian ini sebanyak 195 citra wajah dimana citra tersebut dibagi menjadi 2 (dua) bagian yaitu sebanyak 150 citra digunakan sebagai data uji coba training dan 45 digunakan sebagai data uji coba testing. Sedangkan data yang didapatkan dari internet berjumlah 180 citra wajah dimana citra tersebut juga akan dibagi menjadi 2 (dua) bagian yaitu 144 citra akan digunakan sebagai uji coba training dan 36 citra akan digunakan sebagai uji coba testing.
Setiap citra akan di-processing terlebih dahulu dengan menggunakan teknik cropping, teknik resize dan teknik grayscale. Tujuan dilakukannya teknik cropping adalah untuk mendapatkan citra bagian wajah saja, sedangkan teknik resize bertujuan untuk menyamakan dimensi setiap citra yaitu 125 piksel x 125 piksel. Hasil citra dari teknik preprocessing tersebut akan dilanjutkan pada tahap selanjutnya yaitu ekstraksi fitur dan klasifikasi.
Untuk memvalidasi sistem yang telah dibangun, beberapa dataset dari internet akan diambil dan dilakukan implementasi dengan menggunakan metode yang sama pada dataset Stikom Surabaya. Hasil citra preprocessing baik dari Institut Bisnis dan Informatika Stikom
JCCS Vol. x, No. x, July201x : first_page–end_page
www.vision.ucsd.edu/leekc/ExtYaleDatabase/ExtYaleB.html ditunjukkan pada Gambar 2 dan Gambar 3.
Gambar 2 Institut Bisnis dan Informatika Stikom Surabaya face database
Gambar 3 YaleB face databases
2.2. Preprocessing Citra
Sebelum melakukan tahap ekstraksi fitur, database wajah akan dilakukan perlakukan awal berupa preprocessing citra. Jenis citra yang akan digunakan dalam sistem pengenalan wajah penelitian ini adalah citra dengan tingkat keabuan dan ukuran yang sama. Untuk itu perlu dilakukan konversi citra pada database wajah menjadi citra wajah dengan tingkat keabuan dan mengubah ukuran citra menjadi ukuran 125 piksel x 125 piksel.
2.3. Ekstraksi Fitur
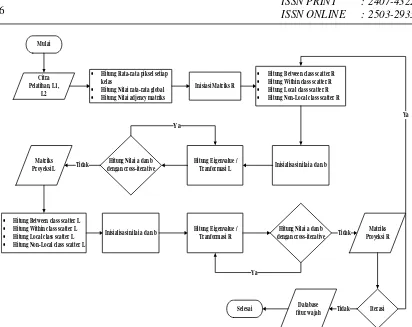
TDLDA adalah salah satu metode ekstraksi fitur yang mendeskripsikan citra sebagai sinyal dua dimensi yang bertujuan untuk mencari proyeksi optimal L dan R Penyelesaian komputasi TDLDA-FFS dilakukan secara iterative [8].Untuk R yang tetap, dilakukan komputasi penyelesaian untuk mendapatkan matrik transformasi L. Kemudian dilakukan update terhadap matrik transformasi R setelah diperoleh dari matrik transformasi L [6].
Terdapat dua macam jenis ekstraksi fitur, yaitu ekstraksi fitur yang bersifat linier (euclidian structure) dan ekstraksi fituryang bersifat non-linier (manifold structure). Jenis ekstraksi fiturdapat ditinjau dari jenis scatter matrix yang digunakan. Scatter matrix within-class (SW) dan scatter matrix between-class (SB) merupakan scatter matrix yang bersifat global dan jika dikomputasi berdasarkan matriks transformasinya akan menjadi seperti yang ditunjukkan pada persamaan (1) dan (2). PCA maupun LDAmerupakan jenis ekstraksi fitur ini.
Jatisi, Vol. 3 No. 1 September 2016 5
Dimana Hijmerupakan adjacency matrix pembobotan, yang didefenisikan pada persamaan (4) [9]
FFS merupakan penggabungan dari keempat scatter matrix yangmembentuk struktur gabungan. Fungsi diskriminan daripenggabungan tersebut pada persamaan (5) [9]
)
Kunci permasalahan kombinasi TDLDA dengan FFS adalah dengan menyelesaikan fungsi diskriminan pada persamaan (2). Seperti halnya penyelesaian space dimensi rendah TDLDA, scatter matrix local(SL) dan scatter matrix non-local (SNL) didefinisikan pada
Matrik transformasi L dan R diperoleh dari penyelesaian generalized eigen-system. Komputasi dekomposisi eigen diaplikasikan dengan menggunakan SVD. Dalam penelitian ini, nilai a dan b yang merupakan rasio perimbangan struktur euclidian dan manifold, ditentukan
JCCS Vol. x, No. x, July201x : first_page–end_page
Mulai
Citra Pelatihan, L1,
L2
· Hitung Rata-rata piksel setiap kelas
· Hitung Nilai rata-rata global
· Hitung Nilai adjency matriks
Inisiasi Matriks R
· Hitung Between class scatter R
· Hitung Within class scatter R
· Hitung Local class scatter R
· Hitung Non-Local class scatter R
Hitung Eigenvalue /
Tranformasi L Inisialisasi nilai a dan b Hitung Nilai a dan b
dengan cross-iterative
Ya
Tidak
· Hitung Between class scatter L
· Hitung Within class scatter L
· Hitung Local class scatter L
· Hitung Non-Local class scatter L
Inisialisasi nilai a dan b Hitung Eigenvalue / Tranformasi R
Gambar 4 Diagram Alir Ekstraksi Fitur TDLDA-FFS
2.4. Klasfikasi dan Evaluasi Sistem
Penelitian ini menggunakan salah satu metode supervised learning yaitu Generalized Relevanced Learning Vector Quantization (GRLVQ). Metode GRLVQ ini akan digunakan sebagai mesin classifier dalam pengenalan wajah manusia. Untuk menguji performa pengenalan wajah dilakukan pengukuran akurasi terhadap dataset testing pada setiap database wajah yang digunakan. Adapun pengukuran akurasi seperti ditunjukkan pada persamaan (9):
𝐴𝑘𝑢𝑟𝑎𝑠𝑖 = 𝐽𝑢𝑚𝑙𝑎ℎ𝑇𝑒𝑟𝑖𝑑𝑒𝑛𝑡𝑖𝑓𝑖𝑘𝑎𝑠𝑖𝐵𝑒𝑛𝑎𝑟𝐽𝑢𝑚𝑙𝑎ℎ𝐷𝑎𝑡𝑎𝑇𝑒𝑠𝑡𝑖𝑛𝑔 𝑥 100% (9)
3. HASIL DAN PEMBAHASAN
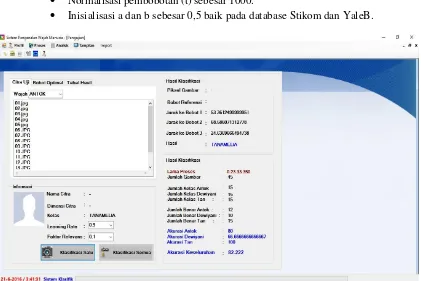
Performa pengenalan wajah diuji cobakan dengan variasi learning rate pada mesin klasifikasi. Jumlah data training yang digunakan adalah sebanyak 150 citra wajah yang berasal dari Institut Bisnis dan Informatika Stikom Surabaya. Sedangkan yang berasal dari YaleB Database sebanyak 144 citra wajah. Jumlah data testing yang diujicobakan adalah sebanyak 45 citra wajah yang berasal dari Stikom Surabaya dan 36 citra yang berasal dari YaleB database. Pada pengujiannya juga antara data training dan data testing dipastikan berbeda-beda antar setiap citranya. Setiap pengujian performa pengenalan wajah akan dibandingkan menggunakan dua metode ekstrasi fitur, TDLDA dan TDLDA-FFS. Adapun hasil screenshot aplikasi interface grafis yang dibangun dengan Visual Studio.Net 2012 seperti ditunjukkan pada Gambar 5.
Jatisi, Vol. 3 No. 1 September 2016 7
structure (nilai a dan b) [8]. Dari hasil penelitian, parameter yang digunakan tersebut adalah sebagai berikut:
· Normalisasi pembobotan (t) sebesar 1000.
· Inisialisasi a dan b sebesar 0,5 baik pada database Stikom dan YaleB.
Gambar 5 Hasil sistem pengenalan wajah yang dibangun
Tabel 1 adalah perbandingan akurasi pengenalan wajah dengan jumlah sampel yang digunakan untuk pelatihan sebanyak 50 sampel citra per kelas. Dimana citra yang digunakan pada perbandingan tersebut berasal dari citra real-time yang berasal dari Institut Bisnis dan Informatika Stikom Surabaya. Secara keseluruhan, terlihat bahwa hasil uji coba dengan menggunakan metode ekstraksi fitur TDLDA-FFS menunjukkan akurasi pengenalannya lebih baik daripada metode ekstraksi fitur TDLDA. Hal ini dikarenakan TDLDA-FFS mampu memproyeksikan baik dari struktur euclidian dan struktur manifold secara simultan [9]. Sedangkan pada metode TDLDA hanya memproyeksikan struktur euclidian saja. Sehingga baik ciri objek yang berkaitan dengan hubungan antar kelas citra maupun ciri objek yang berkaitan dengan hubungan antara piksel citra, terepresentasi dengan baik. Dan juga data-data yang terpengaruh secara non-linear terklasifikasi dengan baik. Hal inilah yang menyebabkan nilai akurasi pengenalan wajah pada metode TDLDA-FFS menghasilkan akurasi cukup tinggi dibandingkan metode TDLDA.
Pada pengujian cross-iterative, juga berpengaruh pada akurasi pengenalan wajah. Jika dibandingkan dengan metode TDLDA, akurasi TDLDA-FFS lebih baik dikarenakan adanya fungsi automatic optimation yang berfungsi untuk mendapatkan struktur manifold pada pengenalan wajah. Pada penelitian [8], tidak terdapat fungsi automatic optimation yang menyebabkan waktu yang diperlukan lebih lama karena update fitur yang didapatkan dari nilai cross iterative dilakukan secara manual.
JCCS Vol. x, No. x, July201x : first_page–end_page
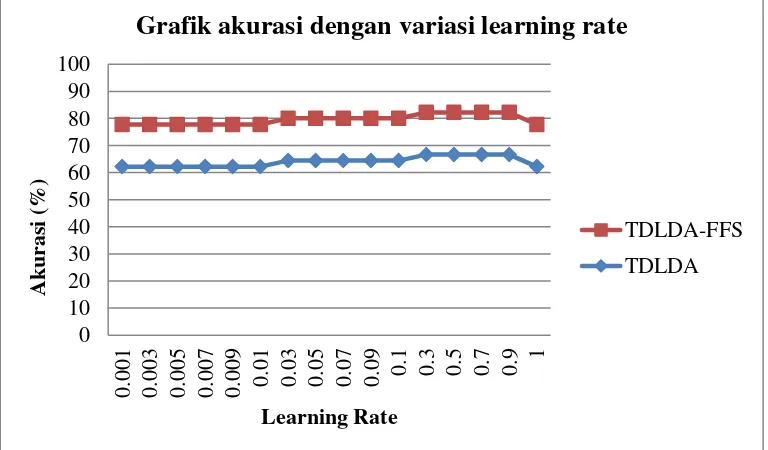
tersebut berada pada learning rate 0.3 sampai dengan 0.9. Hal ini disebabkan oleh fungsi pemisah (klasifier/learning machine) secara optimal dapat memisahkan kelas yang satu dengan kelas yang lainnya. Setiap kelas memiliki pola yang berbeda dan dipisahkan oleh fungsi pemisah, sehingga jika ada data baru yang akan diklasifikasikan akan diketahui kelas yang sesuai dengan data baru tersebut. Dengan demikian klasifikasi yang dihasilkan lebih sempurna baik.
Tabel 1 Perbandingan TDLDA dan TDLDA – FFS dataset Stikom Metode Ekstraksi Cross Iterative Learning Rate Akurasi (%)
TDLDA a = -, b = - 0.3 66.67
Gambar 6 menunjukkan bahwa dengan melakukan ujicoba TDLDA-FFS dengan variasi learning rate yang berbeda-beda, menghasilkan akurasi terbaik pada learning rate 0.3 sampai dengan 0.9. Hal ini disebabkan karena matriks fitur yang diperoleh dari dataset real-time dengan metode TDLDA-FFS adalah matriks fitur yang baik jika dibandingkan TDLDA. Matriks fitur tersebut akan dijadikan input bobot guna mendapatkan jarak bobot yang optimal pada mesin learning yaitu menggunakan metode klasifier GRLVQ.
Gambar 6 Grafik akurasi menggunakan database Stikom Surabaya dengan variasi learning rate
Tabel 2 adalah perbandingan akurasi pengenalan wajah dengan jumlah sampel yang digunakan untuk pelatihan sebanyak 48 sampel citra per kelas. Dimana citra yang digunakan pada perbandingan tersebut berasal dari YaleB face dataset yang telah ter-preprocessing dengan baik. Secara keseluruhan, terlihat bahwa hasil uji coba dengan menggunakan metode ekstraksi fitur TDLDA-FFS menunjukkan akurasi pengenalannya lebih baik daripada metode ekstraksi fitur TDLDA. JikaTabel 1 dibandingkan denganTabel 2 maka akan terlihat bahwa dataset yang
Jatisi, Vol. 3 No. 1 September 2016 9
berasal dari internet dengan memiliki akurasi yang lebih tinggi dibandingkan dataset yang berasal dari Institut Bisnis dan Informatika Stikom Surabaya. Hal ini dikarenakan data real time yang berasal dari Stikom Surabaya belum ter-preprocessing dengan baik seperti halnya dataset yang telah tersedia. Tahapan preprocessing merupakan langkah yang perlu diperhatikan juga karena akan bertujuan mendapatkan fitur-fitur optimal yang akan dimasukan pada proses ekstraksi fitur dan menjadi bobot inputan ketika akan diproses dengan metode klasifikasi yang telah diusulkan.
Tabel 2 Perbandingan TDLDA dan TDLDA – FFS YaleB Database Metode Ekstraksi Cross Iterative Learning Rate Akurasi (%)
TDLDA a = -, b = - 0.3 83.33
Gambar 7 menunjukkan bahwa dengan melakukan ujicoba TDLDA-FFS dengan variasi learning rate yang berbeda-beda, menghasilkan akurasi terbaik pada learning rate 0.3 sampai dengan 0.9. Hal ini disebabkan karena matriks fitur yang diperoleh dari dataset internet dengan metode TDLDA-FFS adalah matriks fitur yang baik jika dibandingkan TDLDA. Matriks fitur tersebut akan dijadikan input bobot guna mendapatkan jarak bobot yang optimal pada mesin learning yaitu menggunakan metode klasifier GRLVQ.
Gambar 7 Grafik akurasimenggunakan YaleB Database dengan variasi learning rate
JCCS Vol. x, No. x, July201x : first_page–end_page
4. KESIMPULAN
Performa pengenalan wajah menggunakan metode TDLDA dapat ditingkatkan dengan penggunaan fungsi optimasi FFS. Hasil penelitian menunjukkan bahwa performa TDLDA berbasis fungsi optimasi FFS lebih baik dibanding TDLDA khususnya variasi learning rate. Hasil uji coba dengan menggunakan database Stikom Surabaya menghasilkan perhitungan akurasi pengenalan wajah berkisar antara 77,78% - 82,22% pada variasi learning rate, dan pada database YaleB berkisar antara 88,89% - 94,44% pada variasi learning rate.
Hal tersebut dikarenakan TDLDA-FFS mampu memproyeksikan baik dari euclidean structuredan manifold structuresecara simultan. Sehingga data yang bersifat linier dan non-linier dapat dimaksimalkan fiturnya dengan baik.
5. SARAN
Adapun saran pada penelitian selanjutnya yang perlu diperhatikan yaitu :
· Pada data real-time seperti dataset Stikom Surabaya, perlumemperhatikan normalisasi dataset sebelum memulai metode ekstraksi fitur yang dapat memungkinkan terjadinya peningkatan akurasi pengenalan wajah.
· Dapat membandingkan keakurasian dengan fungsi optimasi lainnya yang dapat memperbaiki data-data bersifat non-linier.
UCAPAN TERIMA KASIH
Penulis mengucapkan terima kasih kepada instansi-instansi terkait yang telah membantu penulis dalam menyelesaikan penelitian ini khususnya kepada Stikom Surabaya sebagai penyedia data kepada penulis.
DAFTAR PUSTAKA
[1] Jafri, R., Arabnia, H.R., 2009, A Survey of Face RecognitionTechniques, Journal of Information Processing Systems, vol 5. no. 2, hal 41-68.
[2] Guiyu Feng, Dewen Hu, Zongtan Zhou, 2008, A Direct Locality Preserving Projections (DLPP) Algorithm for Image Recognition, Springer Science, hal 247-255.
[3] Bashyal. S, Venayagamoorthy. G. K., 2008, Recognition of facial expressions using Gabor Wavelets and Learning Vector Quantization, Elsevier, hal 1056-1064.
[4] Turk, M, A. Pentland, 1991, Face recognition using eigenfaces, Proceedings of IEEE Conference on Computer Vision and Pattern Recognition, Maui, Hawaii, June.
[5] Belhumeur, P. N, Heespanha, J. P, Kriegman, D. J, 1997, Eigenfaces vs Ficergaces : Recognition Using Class Specific Linear Projection, IEEE Transcations on Pattern Analysis and Machine Intelligence, vol 19. no.7, hal 711-720.
Jatisi, Vol. 3 No. 1 September 2016 11
[7] Damayanti, 2010, Pengenalan Citra Wajah Menggunakan Two Dimensional Liner Discriminant Analysis dan Support Vector Machine, Tesis, Program Pasca Sarjana Teknik Informatika, Institut Teknologi Sepuluh Nopember, Surabaya.
[8] Sinulingga, S, B. Afandi, dan P.A.R. Devi, 2015, Pengenalan Wajah Menggunakan Two Dimensional Linier Discrimininant Analysis berbasis Feature Fusion Strateg,Jurnal Cybermatika, vol. 3. no.1. hal 23-28.
[9] Chen, W.S, X. Dai, B. Pan, and T. Huang, A novel discriminant criterion based on feature fusion strategy for face recognition,Neurocomputing, vol. 159, hal 67–77.
JCCS Vol. x, No. x, July201x : first_page–end_page
The Modeling of Information Security Classification
With Risk Value Assesment Factor to Good
Information Governance on The Indonesia
Higher Education Sector
IGN Mantra
Perbanas Institute; Jl. Perbanas, Karet Kuningan, Setiabudi, 021-5252533 Teknik Informatika, Fakultas Teknologi Informasi, Perbanas Institute Jakarta
e-mail: [email protected], [email protected]
Abstract
Digital information is currently dominating the turnover or circulation of information in any institution, whether in government, private sector, universities, Social, Defense and Security, Economy, Politics etc. Almost certainly the information is spearheading the movement of the economy, "who holds the information then he will win the war". Today's Internet era, which is highly sought after by the hackers or crackers and intruders is information, the heart of the information in the database, computer and laptop is not worth more in the eyes of hackers or crackers, hackers either individual or team will try to break through the defense and security information in server , they are vying to be able to obtain important information, and even the most sensitive secrets though. The purpose of the security classification of information is made rating models on levels of sensitivity of the information, with the security classification of information would make the control of the security protection of data and information, the classification will do with risk value assessment factor so that information can be saved away from the hands of scavengers information especially in Indonesia higher education sector.
Keyword : information security classification; information governance; information security policy; IT security risk management, risk value assessment factor
Abstrak
Informasi digital saat ini mendominasi pertukaran atau peredaran informasi di institusi manapun, baik di sector Pemerintahan, Swasta, Pendidikan/Perguruan Tinggi, Sosial, Pertahanan dan Keamanan, Ekonomi, Politik dll. Hampir pasti informasi merupakan ujung tombak pergerakan ekonomi, "yang memegang informasi maka ia akan memenangkan perang ". Di era internet saat ini, yang sangat dicari oleh hacker atau cracker dan penyusup adalah informasi, jantung informasi dalam database, komputer dan laptop tidak bernilai lebih di mata hacker atau cracker, hacker baik individu atau tim akan mencoba untuk menerobos informasi pertahanan dan keamanan pada server, mereka berlomba-lomba untuk dapat memperoleh informasi penting, dan bahkan rahasia paling sensitif sekalipun. Penelitian ini bertujuan untuk klasifikasi keamanan informasi dengan dibuat model rating pada tingkat sensitivitas informasi, dengan klasifikasi keamanan informasi akan dapat mengontrol perlindungan keamanan data dan informasi, klasifikasi dihitung dengan dengan faktro penilaian risiko sehingga informasi dapat disimpan jauh dari tangan pemulung informasi terutama di sektor pendidikan tinggi Indonesia.
Jatisi, Vol. 3 No. 1 September 2016 13
1. INTRODUCTION
n the context of information security, information security classification based on the level of sensitivity of the information and the impact if the information is revealed/opened by people who do not have legal authorization so that information can be categorized been a leak of information[6].
There are several approaches to classify the security of informations depends on the country and the institutions do, classification of information on military and security industry is very different from the Banking and Finance Industry including other institutions such as education and health.
Information is necessary to be classified, there are several important reasons behind the classification is as follows:
1. To protect the Personal Information, whoever and wherever citizen to get protection in the law of Information Technology and Electronics, personal information such as Medical Record, Data Banks, detailed data clerks, students are well guarded by the owner of the information system. Moreover, the personal database state officials may not be republished without permission.
2. To protect the information from unauthorized access is allowed, classification restricts information to everyone and not to access parts information indiscriminately, accesses to the database are arranged so that should only be accessible to any interested operator, for example, telephone customer service, banking , hospitals can only access such information with the consent of the customer in front of their screens, and even then only to the extent necessary information, such as saving savings entry, customer database load being complain, customer data load Hospital etc.
3. To protect the intellectual property rights, at the time the information has been generated by the institution, the information relating to the work of individual and institutional copyright must be maintained properly, because copyrighted works is an asset of the company, before it gained recognition as a right of a copyright work, the work of the government should be saved and properly supervised in order not to fall to the competitors and the edges are each claim to the copyright work[2].
4. To protect the leakage of information and dissemination of such information, the information can leak or transfer from one place to another without realizing it and want, at any institution should be able to do well because the classification information is not confidential information carelessly placed and can be stolen by others as well as employees, information has a very high value and can be leaked accidentally or intentionally, recklessly not copy important information into Flash Disk personal and brought to and fro, the probability of lost and forgotten plugged into the computer in general very harmful information in in the flash disk.
5. To provide the facilitation for internal information exchange and integrated services at the time the information is sent / received, information that has been produced by each department should to be interchangeable between departments, with the rules of classification of information is not just information can be sent / received , must go through strict procedures, classification of information is helpful in order not to move information to unauthorized and ends is leaking information to the other party.
JCCS Vol. x, No. x, July201x : first_page–end_page
plans, plans transfer of combat equipment, broken equipment and maintenance, the amount of organic weapons and non-organic, document new discoveries, investment, human resources involved etc. must be very concealed its existence.
2. METHODOLOGY
Methodology to be used for this research is a model of constructive research, analysis of important information and sensitive owned by the education sector, making the rating sensitivity of the information security and information security ultimately make a classification of all asset information held by the higher education sector.
The method used in this study is constructive research, conduct studies and calculations that IT risk management has been owned by Higher Education institutions, and then create a security classification of the information in the information security governance.
Analysis of the IT risk management will acquire high risk, moderate and low for information security classification can be made applicable in many institutions university. Security classification information obtained will clarify which information will be placed on information security classification model conditions suitable for the university.
3. RESULTS AND DISCUSSIONS
The risk assessment is the first phase of the risk management process. The risk assessment aims to determine the threats from the outside that could potentially disrupt the organization's information security and potential weaknesses that may have information on the organization.
Methods of risk assessment consists of six stages: 1. Identification of informations
2. Identification of threats 3. Identify the weaknesses 4. Determine the possible threats 5. The impact assessment 6. The determine of risk value
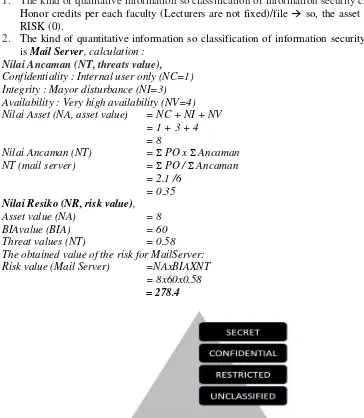
Information Security classification at Universities in Indonesia did not like with the classification in the Military, so in the University was simplified into four levels namely : SECRET, CONFIDENTIAL, RESTRICTED dan UNCLASSIFIED, the framework shows in the fig.1.
Meanwhile, to make information security classification and placement the information in the proper category in the universities should be calculated the informations using Information Technology Risk Management, it has already done in many organizations[1]. Approach to IT Risk Management calculate using methods Qualitative and Quantitative methods, for Qualitative, Risk value is usually determined by the range :
LOW RISK = Risk received minor (0)
MEDIUM RISK = Risk received medium (1)
HIGH RISK = High-risk accepted (2)
SUPER HIGH RISK = Super High-risk accepted (3)
The quantitative methods of risk assessment methods with a mathematical approach. With this method the value of the risk can be calculated using the following formula.
Jatisi, Vol. 3 No. 1 September 2016 15
Risk value = NA x BIA x NT (1) where:
Asset value = NA (Nilai Asset)
= NC + NI + NV
Business Impact Analysis = BIA Threat Value = NT
Calculation :
1. The kind of qualitative information so classification of information security classification is
Honor credits per each faculty (Lecturers are not fixed)/file so, the asset value is LOW RISK (0).
2. The kind of quantitative information so classification of information security classification is Mail Server, calculation :
Nilai Ancaman (NT, threats value),
Confidentiality : Internal user only (NC=1) Integrity : Mayor disturbance (NI=3) Availability : Very high availability (NV=4) Nilai Asset (NA, asset value) = NC + NI + NV
= 1 + 3 + 4 = 8
Nilai Ancaman (NT) = Σ PO x Σ Ancaman NT (mail server) = Σ PO / Σ Ancaman
= 2.1 /6
= 0.35
Nilai Resiko(NR, risk value), Asset value (NA) = 8 BIAvalue (BIA) = 60 Threat values (NT) = 0.58 The obtained value of the risk for MailServer: Risk value (Mail Server) =NAxBIAXNT = 8x60x0.58
= 278.4
Fig. 1. Information Security Classification Framework for Indonesia Higher Education Sector.
In higher education[7] needs to be compiled first asset owned information such as in list : a. Diploma Certificate/file
b. Transcript values (values that have been processed)/file
c. Value of raw (unprocessed value) / original value of the lecturer/file d. Professors Data archive (especially tenured faculty)/file
JCCS Vol. x, No. x, July201x : first_page–end_page
f. Basic salaries of tenured faculty (energy e.functional) and support personnel/file g. Honor credits per each faculty (Lecturers are not fixed)/file
h. Computer Laboratory/file
i. Laptop or PC computer structural employees (Rector, Vice Rector, Director, Chairman of the department, BAAK, and finance)/file
j. Computer Server as Web Server, Database Server, Email Server etc. k. Academic guidelines, final project, and so forth.
l. LCD Projector/file
m. Student and grades database n. Library books database o. Books Catalogs
p. Subjects per semester (the curriculum) database q. Alumni database
r. Student financial database s. Office inventory database
t. Data extracurricular activities of students database u. Certificate lecturer in performing community service/file v. Research Data lecturers/file publications
w. Certificate of accreditation from the BAN PT/file x. Marketing Information
y. Academic Calender Information z. ISO 9001:2008 Documentations aa. Lecturer and Student presence bb. Employee presence
cc. Project Research dd. Institution Budgeting
The implementation of the security classification of the information depends on the individual institution, following the author decrypt reset in accordance with the references used in several countries[4], so it can be used as reference material in the Indonesia classification information.
Implementation is divided into several sections such as doing: 1. Labeling
2. Storage 3. Transmission
4. Destruction that has not been used 5. Protecting the integrity
6. Licensing limited access and disclosure 7. Establish accountability
To be able to place the exact position of the critical information necessary to rating based Risk owned by each such information, the risks can be computed qualitative (can not be calculated the value of an information / assets) and quantitative (can be calculated price of an information / assets)[5].
Jatisi, Vol. 3 No. 1 September 2016 17
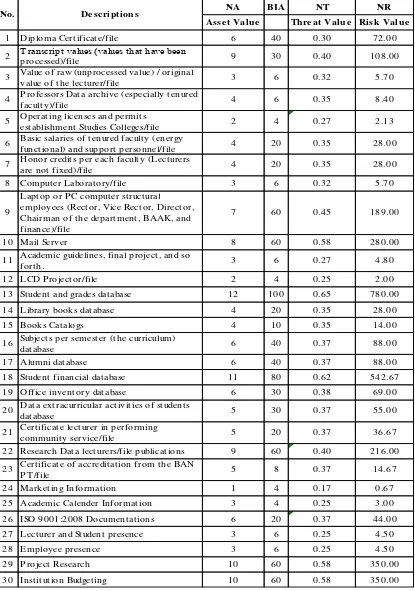
Table 1 Information Security Classification
Classifications Asset Description of Information
Information Detail
UNCLASSIFIED The informations are open to the public, to all university
RESTRICTED The informations are limited just to name personnel / team designated course to be open
Transcript values (values that have been processed)/file
Value of raw (unprocessed value) / original value of the lecturer/file CONFIDENTIAL The informations are very
limited to personnel and teams involved only in the access and functionality such information.
Basic salaries of tenured faculty (energy functional) and support personnel/file SECRET The informations are very
limited only to a few
The Information security classification for the type qualitative classification as follows :
JCCS Vol. x, No. x, July201x : first_page–end_page
NA BIA NT NR
Asse t Val u e Th re at Val u e Ri sk Val u e
1 Diploma Cert ificat e/file 6 40 0.30 72.00
2 T ranscript values (values that have been
processed)/file 9 30 0.40 108.00
3 Value of raw (unprocessed value) / original
value of t he lect urer/file 3 6 0.32 5.70
4 P rofessors Dat a archive (especially t enured
facult y)/file 4 6 0.35 8.40
5 Operat ing licenses and permit s
est ablishment St udies Colleges/file 2 4 0.27 2.13
6 Basic salaries of t enured facult y (energy
funct ional) and support personnel/file 4 20 0.35 28.00
7 Honor credit s per each facult y (Lect urers
are not fixed)/file 4 20 0.35 28.00
8 Comput er Laborat ory/file 3 6 0.32 5.70
9
Lapt op or P C comput er st ruct ural
employees (Rect or, Vice Rect or, Direct or, Chairman of t he depart ment , BAAK, and finance)/file
7 60 0.45 189.00
10 Mail Server 8 60 0.58 280.00
11 Academic guidelines, final project , and so
fort h. 3 6 0.27 4.80
12 LCD P roject or/file 2 4 0.25 2.00
13 St udent and grades dat abase 12 100 0.65 780.00
14 Library books dat abase 4 20 0.35 28.00
15 Books Cat alogs 4 10 0.35 14.00
16 Subject s per semest er (t he curriculum)
dat abase 6 40 0.37 88.00
17 Alumni dat abase 6 40 0.37 88.00
18 St udent financial dat abase 11 80 0.62 542.67
19 Office invent ory dat abase 6 30 0.38 69.00
20 Dat a ext racurricular act ivit ies of st udent s
dat abase 5 30 0.37 55.00
21 Cert ificat e lect urer in performing
communit y service/file 5 20 0.37 36.67
22 Research Dat a lect urers/file publicat ions 9 60 0.40 216.00
23 Cert ificat e of accredit at ion from t he BAN
P T /file 5 8 0.37 14.67
24 Market ing Informat ion 1 4 0.17 0.67
25 Academic Calender Informat ion 3 4 0.25 3.00
26 ISO 9001:2008 Document at ions 6 20 0.37 44.00
27 Lect urer and St udent presence 3 6 0.25 4.50
28 Employee presence 3 6 0.25 4.50
29 P roject Research 10 60 0.58 350.00
30 Inst it ut ion Budget ing 10 60 0.58 350.00 No. De scri pti on s
After the making of the information security classification we can make a classification matrix based on categories and the planning application to be made to follow the standard Information Security clasification agreed and defined by each institution[7].
Jatisi, Vol. 3 No. 1 September 2016 19
Protecting the integrity of information
The integrity of information is protected so that information remains current, complete and unchanged (as original), information is accessed and stored in the system information with the principle of "right", so the extent to which user rights to perform "modify” (edit, insert,
delete) or "read only”. Significant threats to the integrity of that file are stored in a "read only",
to modify the file can only be done by the creator of the course, control access rights to the file is set based on user accounts and workgroups as well as physical access to special equipment, while file/ document transfer its integrity must be maintained because it could be a document intercepted by others who are not entitled. To maintain the integrity of many enterprise do encryted to files/ documents are "restricted" when it is transmitted to the other party or stored somewhere.[5]
The most important thing is the integrity of access control to files/documents to be opened/read, track logs anybody who has opened and transmits the file to the other party, of course file "encrypted" is much safer than clear text transmission. Here is the implementation of Integrity protects information as (Table 3) :
Table 3 Information Security Classification and Audit Works
Classifications Access Restrictions Audit Works
UNCLASSIFIED Access to informations are open to the public, to all university employees and non-employees, to university contractors and subcontractors, agents, etc.
No audit file
RESTRICTED Access to informations are limited just to name personnel / team designated course to be monthly or per 4 months. Read log files/documents that have been accessed by personnel/teams.
CONFIDENTIAL Access to informations are very limited to personnel and teams involved only in the access and functionality such information.
Files/documents audit periodically per day / per week to make sure the files maintained confidential. Read access log file, who and what authorize to opening.
SECRET Access to informations are very limited only to a few personnel are allowed access to such information.
Files/documents periodically per day / per week to file make sure awake "secret". Read access log file anyone who has access.
Replace the passwords and
JCCS Vol. x, No. x, July201x : first_page–end_page
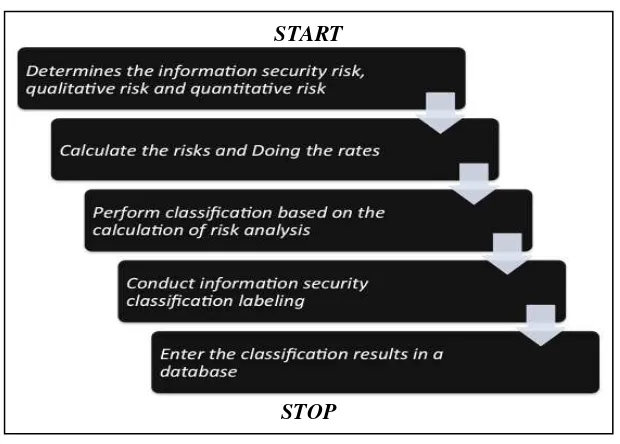
Classification of Information Security Logic Flow Chart (Fig. 2)
START
STOP
Fig. 2. Classification of Information Security Logic Flow Chart
This flow chart (Fig. 2) to determine the risk of information security, calculate the risks and doing the rating results of the risk analysis. After that perform the security classification of information security risk analysis, and then conduct a security classification labeling and enter this information in a database[8].
Handling and Processing the Information
Important to have a good set of procedures to determine the marking and handling of information in accordance with the classification scheme used by the organization. This procedure should include both physical assets and information in electronic format. For each classification, handling procedures should be established, including the following types of information processing operations like, labeling, storage, delivery, archieve and destruction.
Output from systems containing information classified as confidential or important classification should be marked. Flagging generally shaped mark physical. However, some information assets such as documents in electronic format, can not be marked as physical and electronic tagging should be used.
4. CONCLUSIONS
Jatisi, Vol. 3 No. 1 September 2016 21
5. SUGGESTION
This research is still preliminary research, to continue this research required list / register asset information that much more can be collected by the university, and then save the first asset information to be calculated the value of its risks, low, medium, high risk and super high risk more detail again, and the next is made application that can automatically classify the security classification of information by the system, member labels and can be stored on server. Without a good application it will be impossible to do this manually classification.
THANK YOU
The author would like to thank the institution where I work and shelter for nearly 20 years, Perbanas Institute. Thanks to the Rector and Dean that provide strong support to the author in terms of funding. Thanks also to colleagues who have helped and provide references to the improvement of this publication. There is no ivory that is not cracked, for their mistakes will make us learn again to correct the error. Hopefully, this publication can help to improve national information security in the Homeland and can be upgraded according to the science of information security, in order to increase knowledge to further the advancement of knowledge among fellow educators both in Jakarta and in the entire country of Indonesia. Thus this publication may be beneficial to all.
REFERENCES
[1] AlBone, A. 2010, PEMBUATAN RENCANA KEAMANAN INFORMASI BERDASARKAN ANALISIS DAN MITIGASI RISIKO TEKNOLOGI INFORMASI. Jurnal Informatika, 10(1), 44-52.
[2] Calder, A. 2011, Implementing Information Security based on ISO 27001/ISO 27002. Van Haren.
[3] Clark, D. D., & Wilson, D. R. 1987, April, A comparison of commercial and military computer security policies. In Security and Privacy, 1987 IEEE Symposium on (pp. 184-184). IEEE.
[4] Dewi, I. K., Fitroh, F., & Ratnawati, S. 2015, USULAN MANAJEMEN RISIKO BERDASARKAN STANDAR SNI ISO/IEC 27001: 2009 MENGGUNAKAN INDEKS KAMI (KEAMANAN INFORMASI) STUDI KASUS: BADAN NASIONAL
PENEMPATAN DAN PERLINDUNGAN TENAGA KERJA INDONESIA
(BNP2TKI). SISTEM INFORMASI, 8(1).
[5] Eloff, J. H., & Eloff, M. 2003, September, Information security management: a new paradigm. In Proceedings of the 2003 annual research conference of the South African institute of computer scientists and information technologists on Enablement through technology (pp. 130-136). South African Institute for Computer Scientists and Information Technologists.
JCCS Vol. x, No. x, July201x : first_page–end_page
[7] Rozas, Indri Sudanawati, Rozas, Sarno, Riyanarto Sarno. 7 Agustus 2010, “Bayesian Probabilistik Sebagai Pendekatan Heuristic Untuk Manajemen Resiko Teknologi
Informasi”, Prosiding Seminar Nasional Manajemen Teknologi XII, Program Studi
MMT-ITS, Surabaya, pp. c-9-2—c-9-8.
Jatisi, Vol. 3 No. 1 September 2016 23
Process Capability Model Based on COBIT 5
Assessments (Case Study)
Johanes Fernandes Andry
Universitas Bunda Mulia, Jl. Lodan Raya No. 2 Ancol, Jakarta Utara 14430 Telp: (021) 692-9090 - Fax: (021) 690-9712
Jurusan Sistem Informasi, Fakultas Teknologi dan Desain e-mail: [email protected]
Abstrak
Perusahaan XYZ adalah penyedia solusi teknologi informasi dan komunikasi di Jakarta. Berdiri sejak tahun 2003 sebagai reseller produk IT dan pengembangan perangkat lunak customized, jaringan dan Outsourcing project lainnya. Perusahaan menyadari untuk memperkuat proses tata kelola IT dan audit, untuk memastikan integritas sistem informasi. COBIT membantu bisnis dan IT dari perusahaan mencapai hal tersebut, dan membangun, kerangka kerja yang terintegrasi kuat untuk IT governance, kontrol dan audit yang proses. COBIT 5 tidak hanya melakukan pendekatan hemat biaya, tetapi juga kerangka konseptual yang mudah bagi auditor untuk memahami dan berkomunikasi dengan manajemen. COBIT 5 berevolusi dari "maturity models" di COBIT 4.1, menuju Proses Cability model, COBIT secara terus-menerus melakukan improvement yang berkelanjutan mulai dari proses bisnis. Memberikan penilaian informasi dan mengidentifikasi aset yang mendukung proses bisnis. Penilaian difokuskan untuk domain Build Acquire dan Implement (BAI). Dari perspektif kegiatan penilaian, kontrol klasifikasi oleh tindakan adalah konseptualisasi yang paling berguna dan dalam konteks: pencegahan, detektif, dan pengawasan korektif yang paling berguna untuk dianalisis. Pengukuran Process Capability Model berdasarkan COBIT 5 pada domain BAI rata-rata pada 2.4 (managed) hingga 3.0 (established).
Kata kunci— Process Capability Model, COBIT 5, BAI.
Abstract
XYZ Company is Information and Communication Technology solutions provider in Jakarta. Started in 2003 as reseller product IT and development software customized, networking and other outsourcing project base. It has become imperative to strengthen IT governance and audit processes, to ensure the integrity of information systems. COBIT helps business and their IT achieves these, and builds a powerful, integrated framework for IT governance, control and audit processes. COBIT 5 is not only a cost-efficient approach, but also a conceptually easy framework for auditors to understand and communicate to the management. COBIT 5 moves away from the "maturity models" in COBIT 4.1, to Process Capability Model, they seek continuous improvement of business process. Assessing the value of the information and identifying the assets which support the business process. Assessment focused to domain Build Acquire and Implement (BAI). From the perspective of assessment activity, control classification by action is the most usefull conceptualization and within that context: preventive, detective, and corrective controls the most useful for analysis. Assessments of Process Capability Model based on COBIT 5 in domain BAI, average was at 2.4 (managed) until 3.0 (established).
JCCS Vol. x, No. x, July201x : first_page–end_page
1. INTRODUCTION
he increased complexity of IT management and the growing strategic role of IT in business have bring IT governance into an essential part of the corporate governance mechanism. Effective IT governance helps ensure that IT supports business goals, optimizes business investment in IT, and appropriately manages IT-related risks and opportunities [1] [2]. Information technology (IT) has become widely integrated into most organizations. Therefore, implementing effective information technology governance (ITG) has become a necessity as many organizations have developed critical dependencies on IT for their successes [3], [4]. Effective ITG helps ensure that IT supports business goals, optimizes business investment in IT, and appropriately manages IT-related risks and opportunities [5]. IT Governance focuses specifically on information technology systems, their performance and risk management. The primary goals of IT Governance are to assure that the investments in IT generate business value, and to mitigate the risks that are associated with IT. This can be done by implementing an organizational structure with well-defined roles for the responsibility of information, business processes, applications and infrastructure [6]. In this paper the method to be used is COBIT 5, focused on the domain of Build Acquire and Implement (BAI). XYZ Company is Information and Communication Technology solutions provider in Jakarta. Started in 2003 as reseller product IT and development software customized, networking and other outsourcing project base. Urgency of XYZ Company need for assessment is to identify the strengths, weaknesses and risk of selected processes with respect to a particular specified requirement through the processes used and their alignment with the business need. The purpose of process improvement is to continually improve the enterprise’s effectiveness and efficiency.
2. THEORY BACKGROUND
Previous research by Imam Al Kautsar [7], concluded are the researcher found that maturity level from the assessment of information systems in Hotel Santika Bangka is on average level of maturity 2.664. From Ivana Dvorski Lacković [8], concluded it is expected that by assessing IT governance by this model and prioritizing key areas for action banks can achieve sustainable long term growth and profit and minimization of risks which means that bank is behaving both financially and socially responsible towards its clients, employees and stakeholders. And from Minwer M. Wraikat [9], concluded are firms should take into considerations the importance of IT governance and its pillars accountability, transparency, participation and predictability in enhancing their performance.
The definitions of IT governance are broad and ambiguous which in turn implicate difficult and inaccurate assessments. Most authors agree on IT governance as a top management concern of controlling IT’s strategic impact, and the value delivered to the business c.f [10], [11], [12], [13], [14]. COBIT is a framework based on best practice, focusing on the processes of the IT organization and how their performance can be assessed and monitored. The domain denotes what the decisions should consider. It comprises four dimensional units: Goals, processes, people and technology. Goals include strategy-related decisions, development and refinement of IT policies and guidelines, and control objectives used for performance assessments [14]. In theory, an enterprise can organize its processes as it sees fit, as long as the basic governance and management objectives are covered. Smaller enterprises may have fewer processes; larger and more complex enterprises may have many processes, all to cover the same objectives. The COBIT 5 process reference model is the successor of the COBIT 4.1 process model, with the Risk IT and Val IT process models integrated as well. Figure 1. COBIT 5 Process Reference Model shows the complete set of 37 governance and management processes within COBIT 5 [15] [21].
Jatisi, Vol. 3 No. 1 September 2016 25
Figure 1. COBIT 5 Process Reference Model
(Source: COBIT 5 Enabling Processes an ISACA Framework, 2012)
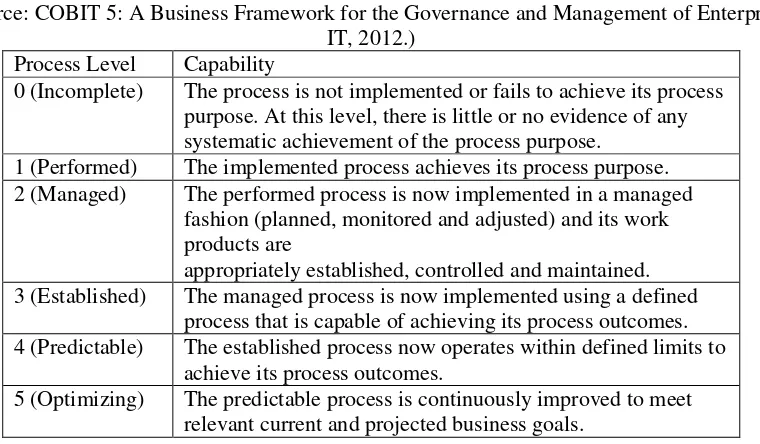
The capability of each assessed process is expressed as a capability level from 0 to 5, as shown in Table 1. Process Capability Model. Each process capability level is aligned with a process situation [22], [23].
Table 1. Process Capability Model
(Source: COBIT 5: A Business Framework for the Governance and Management of Enterprise IT, 2012.)
Process Level Capability
0 (Incomplete) The process is not implemented or fails to achieve its process purpose. At this level, there is little or no evidence of any systematic achievement of the process purpose.
1 (Performed) The implemented process achieves its process purpose. 2 (Managed) The performed process is now implemented in a managed
fashion (planned, monitored and adjusted) and its work products are
appropriately established, controlled and maintained. 3 (Established) The managed process is now implemented using a defined
process that is capable of achieving its process outcomes. 4 (Predictable) The established process now operates within defined limits to
achieve its process outcomes.
5 (Optimizing) The predictable process is continuously improved to meet relevant current and projected business goals.
JCCS Vol. x, No. x, July201x : first_page–end_page
3. RESEARCH METHOD
Planning to study literature related to the XYZ Company with the vision and mission, goals and objectives as well as the company's strategic plan to analyze the vision, mission and objectives of the training center as well as the strategies, policies related to the management of IT investments. Field observations, this research are a survey approach. The analytical tool used in this study is the standard procedure COBIT issued by ISACA (Information systems Audit and Control Association), the data can be obtained by various methods, namely: The questionnaire, which is by distributing questionnaires to every part belonging to management, the number of scattered management is 5. In addition, a questionnaire distributed to the user a number of 35 respondents, so the overall total respondents obtained is 40.
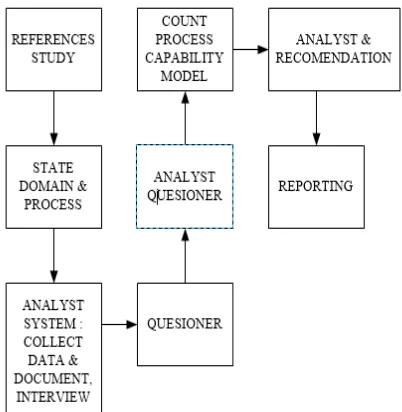
Reporting, after questionnaires were distributed, it will get the data to be processed to be calculated based on the maturity level calculation. For further made several steps in reporting that the results of the audit contains the findings of the present (current level) and hope in the future (expected level), performed gap analysis to analyze the interpretation of the current level and expected and recommendation lists corrective actions to overcome gap undertaken to achieve the improvements made to the institution. Figure 2 to show Step by Step Index Level Proses Capability Model [18].
Process capability model of IT governance based on COBIT 5 is a scoring method, from 0 to 5 as in Figure 2, which allows organizations to provide assessment for them- selves by explaining to the manager or head about the IT process, by showing the weakness of the existing management and setting the appropriate targets. This measurement tool offers the easiness to understand how to determine the current position (as-is) and the position of the future (to-be) and allow the organization to make comparisons to itself based on the best practices and standard guidelines [6], [19].
Figure 2. Step by Step Index Level Proses Capability Model
3. RESULT AND ANALYSIS
Jatisi, Vol. 3 No. 1 September 2016 27
a) BAI01 Manage programmes and projects. b) BAI02 Manage requirements definition.
c) BAI03 Manage solutions identification and build. d) BAI04 Manage availability and capacity.
e) BAI05 Manage organisational change enablement. f) BAI06 Manage changes.
g) BAI07 Manage change acceptance and transitioning. h) BAI08 Manage knowledge.
i) BAI09 Manage assets.
j) BAI10 Manage configuration.
a) BAI01 Manage Programmes and Projects
In this stage the author will analyze Realise business benefits and reduce the risk of unexpected delays, costs and value erosion by improving communications to and involvement of business and end users, ensuring the value and quality of project deliverables and maximising their contribution to the investment and services portfolio, with process description is Manage all programmes and projects from the investment portfolio in alignment with enterprise strategy and in a co-ordinated way. Initiate, plan, control, and execute programmes and projects, and close with a post-implementation review. Expected process capability level of Domain BAI01 Manage Programmes and Projects is level 4, predictable process. In more detail are sub domains, see Table 2. Process Capability Domain BAI01 Manage Programmes and Projects. Concluded the average BAI01 being at the level 2.8, Managed Process.
Table 2. Process Capability Domain BAI01 Manage Programmes and Projects
No. Sub Domain As-is To-be
BAI01.01 Maintain a standard approach for programme and
project management. 3 4
BAI01.02 Initiate a programme. 2 4
BAI01.03 Manage stakeholder engagement. 2 4
BAI01.04 Develop and maintain the programme plan. 3 4
BAI01.05 Launch and execute the programme. 3 4
BAI01.06 Monitor, control and report on the programme
outcomes. 2 4
BAI01.07 Start up and initiate projects within a programme. 2 4
BAI01.08 Plan projects 4 4
BAI01.09 Manage programme and project quality. 3 4 BAI01.10 Manage programme and project risk. 3 4
BAI01.11 Monitor and control projects. 4 4
BAI01.12 Manage project resources and work packages. 2 4
BAI01.13 Close a project or iteration. 3 4
BAI01.14 Close a programme. 3 4
b) BAI02 Manage Requirements Definition
JCCS Vol. x, No. x, July201x : first_page–end_page
solutions. Expected process capability level of Domain BAI02 Manage Requirements Definition is level 4, predictable process. In more detail are sub domains, see Table 3. Process Capability Domain BAI02 Manage Requirements Definition.
Concluded the average BAI02 being at the level 2.5, Managed Process.
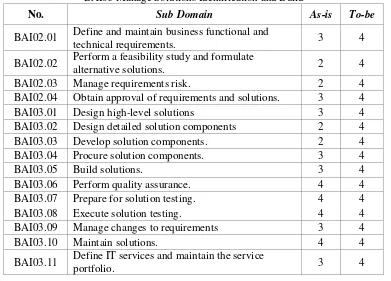
Table 3. Process Capability Domain BAI02 Manage Requirements Definition and Domain BAI03 Manage Solutions Identification and Build
No. Sub Domain As-is To-be
BAI02.01 Define and maintain business functional and
technical requirements. 3 4
BAI02.02 Perform a feasibility study and formulate
alternative solutions. 2 4
BAI02.03 Manage requirements risk. 2 4
BAI02.04 Obtain approval of requirements and solutions. 3 4
BAI03.01 Design high-level solutions 3 4
BAI03.02 Design detailed solution components 2 4
BAI03.03 Develop solution components. 2 4
BAI03.04 Procure solution components. 3 4
BAI03.05 Build solutions. 3 4
BAI03.06 Perform quality assurance. 4 4
BAI03.07 Prepare for solution testing. 4 4
BAI03.08 Execute solution testing. 4 4
BAI03.09 Manage changes to requirements 3 4
BAI03.10 Maintain solutions. 4 4
BAI03.11 Define IT services and maintain the service
portfolio. 3 4
c) BAI03 Manage Solutions Identification and Build
In this stage the author will analyze Establish timely and cost-effective solutions capable of supporting enterprise strategic and operational objectives, with process description is establish and maintain identified solutions in line with enterprise requirements covering design, development, procurement/sourcing and partnering with suppliers/vendors. Manage configuration, test preparation, testing, requirements management and maintenance of business processes, applications, information/data, infrastructure and services. Expected process capability level of Domain BAI03 Manage Solutions Identification and Build is level 4, predictable process. In more detail are sub domains, see Table 3. Process Capability Domain BAI03 Manage Solutions Identification and Build. Concluded the average BAI03 being at the level 3.2, Established Process.
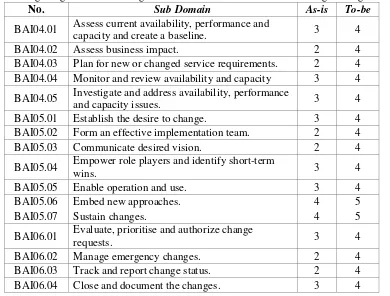
d) BAI04 Manage Availability and Capacity