Shirkah
Journal of Economics and Business
Vol. 2, No. 3, September-December 2017 ISSN: 2503-4235 (p); 2503-4243 (e)
Editor in Chief Sri Walyoto
Editorial Boards
Abu Umar Faruq Ahmad,
UBD School of Business and Economics, Brunei Darussalam
Amelia Fauzia,
Asia Research Institute, National University of Singapore, Singapore
Cedomir Nestorovic,
ESSEC Business School Asia Pacific, Singapore
Dwi Condro Triono,
Faculty of Islamic Economics and Business, IAIN Surakarta, Indonesia
Fahmy Radhi,
Faculty of Economics and Business Universitas Gadjah Mada, Yogyakarta, Indonesia
Hasan Basri,
Syiah Kuala University, Aceh, Indonesia
Johan Fischer,
Department of Social Sciences and Business Roskilde University, Denmark
Masudul Alam Choudhury,
Postgraduate Program in Islamic Economics and Finance, Trisakti University, Jakarta, Indonesia and the College of Economics and Political Science (CEPS) in Sultan Qaboos University (SQU), Oman
M. Falik Isbah,
School of Humanities and Social Science, University of New South Wales, Australia
M. Ishaq Bhatti,
La Trobe Business School Department of Economics and Finance La Trobe University, Australia
Najib Kailani,
Nunung Nurul Hidayah,
Aston Business School, Aston University, Birmingham, United Kingdom
Shaikh M Ghazanfar,
Departement of Economics, University of Idaho, Russian Federation
Managing Editors Fitri Wulandari Jasanta Perangin-angin
Assistant to Editor M. Endy Saputro M. Zainal Anwar Supriyanto
Shirkah Journal of Economics and Business is a peer-reviewed journal published three times a year (January-April, May-August and September-December) by Faculty of Islamic Economics and Business, Institut Agama Islam Negeri (IAIN/ State Institute for Islamic Studies) Surakarta Central Java, Indonesia. The main objective of Shirkah is to offer an academic space of exchange ideas and initiate the increase number of qualified article produced by postgraduate students, practitioners and academicians.
Editorial Office
Ruang Jurnal Shirkah
Ground Floor, West Gate,
Faculty of Islamic Economics and Business IAIN Surakarta
Jln. Pandawa No. 1, Kartasura, Sukoharjo, Jawa Tengah Kode Pos. 57168 Phone (+62271) 781516 Fax: (+62271)782336
Shirkah
Journal of Economics and Business
Vol. 2, No. 3, September-December 2017 ISSN: 2503-4235 (p); 2503-4243 (e)
Table of Contents
Articles
B.A Badejo B.A. Okuneye
M.R Taiwo 255
Fraud Detection in the Banking System in Nigeria Challenges and Prospects
Abdul Qoyum
Milzamulhaq Mardiya
Muhammad Rizky Prima Sakti 283
Indonesian Capital Market Efficiency: Islamic vis-a-vis Conventional
Dita Andraeny
Dessy Diana Putri 317
Islamicity Financial Performance Index in Indonesian Islamic Banks
Muh. Rudi Nugroho 353
Flypaper Effect of Regional Expenditures in Yogyakarta
Agus Faisal
Irma Yuliani 375
Productive Zakat of Baznas Yogyakarta on the Growth of Micro Business
Rakhmawati 397
ISSN: 2503-4235 (p); 2503-4243 (e)
Indonesian Capital Market Efficiency:
Islamic
vis-a-vis
Conventional
Abdul Qoyum
Department of Islamic Financial Management, Universitas Islam Negeri Sunan Kalijaga, Yogyakarta Ph.D Candidate on Islamic Economics, UIN Sunan Kalijaga Yogyakarta
Milzamulhaq Mardiya
Department of Islamic Financial Management, Universitas Islam Negeri Sunan Kalijaga Yogyakarta
Muhammad Rizky Prima Sakti
Researcher, ISEFID (Islamic Economics Forum for Indonesian Development), Kuala Lumpur, Malaysia
Ph.D Candidate in Finance, University Technology Malaysia [email protected]
Abstract
Capital market efficiency is one of the most important part in finance theory, in which assume the price of stock will fully reflect the information available in the market, hence the price will adjust directly and quickly. The objective of this study is to evaluate the efficiency of both Islamic and conventional stock markets, particularly in case of Indonesia. Event study of King Salman Visit in Indonesia was used as testing periods. Abnormal return and average abnormal trading volume activity of 30 companies listed in Jakarta Islamic Index (JII) to represent Islamic capital market and 17 companies listed in LQ45 to represent conventional capital market were employed to explain this issue. The result shows that from abnormal return perspectives both Islamic and conventional capital market are efficient. While from abnormal trading volume activities, shows that during the visit of King Salman, the trading activity in Islamic capital market is increased significantly rather than conventional counterpart.
Introduction
An efficient capital market is a market whose securities prices are reflecting all the information. The capital market will be said to be efficient when the price of security can absorb information quickly. The sooner the new information is reflected in the price of securities, the more efficient the capital market (Husnan, 1996: 246).Efficient capital markets are urgently needed to eliminate speculative action, since all information becomes the basis of investors in making investment decisions. In an efficient capital market where the price is adjusting quickly with the information received is an ideal Islamic capital market (Umar, 2006). The impact of an efficient market is that no investor can dominate the market. With the efficient capital market, it means no one can get abnormal return. In addition, if the market is efficient then there is no asymmetric information or everyone gets the same information (Yusup, 2012).
Stock exchange activity as part of economic activity is not spared from the influence of political turmoil. Stable political conditions in a country will contribute to economic growth that will ultimately affect supply (supply) and demand (demand) for securities (Husnan, 2005: 9). Political events do not interfere directly with the stock market, but these events can be one of the information absorbed by capital market actors and used to obtain expected benefits in the future. Although not directly related to the dynamics occurring in the capital market, non-economic environment influences can not be separated from stock market activity that triggers fluctuations in stock prices and trading volume (Gunaasih: 2014).
The visit of King Salman (King of Arabia) in early March 2017 is considered historic considering his last visit to Indonesia was conducted in 1970. This time he brought a group of about 1,500 people, including 10 ministers and 25 princes. The visit will discuss five cooperation agreements, namely the promotion of art and cultural heritage, expert exchange including hajj and umroh health, the promotion of modern Islam through preaching and exchange of scholars, increasing the frequency of flights from Indonesia to Arabia as well as the eradication of transnational crime. One important aspect of this visit is Saudi Arabia's investment to Indonesia. So expect the arrival of King Salman will have a good impact on economic growth, especially in the capital market.On February 28, 2017 i.e. ahead of the visit of Arab King March 1, 2017, JCI movement has increased. JCI closed up 3.8 points (0.07%) to 5,386 levels. The LQ45 index fell 1 point (0.12%) to 892, and JII stalled at 698.
exchange at this time the stock price is very volatile and easily influenced by the economic and political conditions that exist within the state or outside the state. It can be seen from the graph of stock movement JCI, JII, and LQ45 from 1 December 2016 until 28 February 2017 below:
Graph 1: Historical Price of IHSG, JII and LQ45
In addition, in sharia stock trading on wednesday (1/3), the Jakarta Islamic Index (JII) closed down weaker -4.05 points or -0.58% to 694.04. Indonesia Sharia Stock Index (ISSI) also ended in the red zone with a decline of -1.03 points or -0.59% to 173.72. As of March 1, 2017, ISSI market capitalization containing 329 shares reached Rp3,195.4 trillion or 54.8% of the total capitalization of shares listed on the Indonesia Stock Exchange. While the shares that enter the calculation of JII has a total capitalization of Rp2,034.9 trillion or 34.9% of total capitalization (syariahsaham.com).
Capital Market responded to information from the event as good news. Shown by the emergence of average abnormal returns that are of significant positive value around the date of the event (Wardhani, 2012). The event of the change of the Minister of Finance of the Republic of Indonesia in 2010, the Indonesia Stock Exchange (BEI) responded to the information from the event with the emergence of the difference between the Average Abnormal Return (AAR) significant before and after the turn of events (Sirait et.al., 2012)
While at the inauguration of Joko Widodo as the President of the Republic of Indonesia, the results showed abnormal return in the event period varied but statistically not significant. Similarly, the results of research on differences in market reaction before and after the inauguration event. In other words, this inaugural event does not contain meaningful information for investors, thus making the market unreasonable (Primary et al, 2015). Another political event is the 2014 General Election, from the results of research there is a significant difference between the stock price average before and after the event. As for the average stock return, the average trading volume of stock activity and the average bid-ask spread do not differ between before and after the 2014 election (Mansur and Jumaili, 2014).
on a company or a particular or general industry that affects the entire company in the capital market. According to the time, an event can be a periodic or sporadic event.
This study measured non-economic events against abnormal return of stocks listed as sharia and conventional stocks. Sharia stocks that the researcher as an object is an issuer on the Jakarta Islamic Index, while for conventional stock is an issuer on Liquid Index 45. Jakarta Islamic Index is 30 stocks that fulfill sharia criteria set by sharia supervisory board (DSN) and include liquid stock (Rodoni & Hamid: 2008). While the Liquid 45 Index is a collection of 45 liquid stocks selected after going through some sort of selection. Based on the previous description, some non economic events also have an effect on abnormal return and stock trading activity.
Capital Market Efficiency
Islam teaches to promote justice, so of course the market formed according to sharia is a fair and free market. Islam as a rule of life (nidham alhayat) which regulates all sides of human life makes the signs to invest in the scope of Shariah in order that the property invested becomes a blessing. Among the signs (Satrio, 2005) are as follows:
a. Free from the element of usury. Ribaetymologically means to grow and increase, and in sharia terminology many scholars provide a definition of them, riba is an addition to the basic assets in the absence of real business transactions. Other scholars say that the value added of every exchange of gold and silver (money) and all basic food items without any equivalent and justified by sharia.
b. Escape from gharar element. Gharar is said to be uncertainty. Sale and purchase gharar means a sale that contains ignorance or uncertainty (jahalah) between two people who transact, or buying and selling something that akad objects that are believed can not be submitted (al-Mu’jama al-Wasith, 1960). According to Imam Sarkhasi,gharar is a result that can not be predicted, and this is the opinion of the majority of fuqaha (Satrio, 2005).
c. Avoid the gambling element (maysir). Etymologically maysir means easy. Maysir is a form of object that is defined as a place to facilitate something. It is said to make things easier because someone who is supposed to take a hard path but shortcuts in the hope of achieving what is desired, even though the shortcuts are contrary to the established sharia.
everything that is dedicated to other than Allah. Second, haram because the process taken in obtaining something. For example food obtained for stealing, robbing and others.
e. Avoid from the element of syubahat. The word syubahat means similar, like and mixed. In sharia terminology the shubahat is defined as a mixed matter (between halal and haram) but it is not known for certain whether it is halal or haram, and whether it is right or false.
Jakarta Islamic Index (JII) and LQ 45
According Tjipto Darmaji (2008), Islamic capital market can be interpreted as a capital market that applies the principles of sharia in economic transactions activities and regardless of things that are prohibited. The development of sharia investment in Indonesian capital market began since PT Danareksa Investment Management launched the first sharia mutual fund in Indonesia on July 3, 1997 which was followed by the launching of the Jakarta Islamic Index on July 3, 2000 by Indonesia Stock Exchange (Bank Indonesia 2016: 412) .The Jakarta Islamic Index was created as a benchmark to calculate the performance of shariah-based investment sections. JII consists of 30 selected companies that have been in accordance with the principles of sharia. Shares included in the shariah index are shares of companies whose business activities do not conflict with Islamic laws as follows (Mufti, 2014: 30):
a. Gambling business and all games that incorporate illegal gambling or trading elements.
b. Conventional financial institutions include banks and conventional insurance.
c. Businesses that create, distribute and sell food or beverages prohibited by Islamic law.
shares have been listed in the stock for more than 3 months (unless the stock is included in the list of 10 major shares).
e. The company’s annual financial report or its mid-year report has a maximum bond-of-assets ratio of 90%.
f. Included in the 60 large shares in the average market capitalization of the previous year.
g. Included in the 30 major shares in the average general market liquidity of the previous year.
LQ 45 is formed only from the 45 most actively traded stocks. The considerations underlying the selection of shares that entered in the LQ45 Index are liquidity and market capitalization with the following criteria (Jogiyanto, 2008):
a. Over the past 12 months, the average share transactions are in the top 60 of total stock transactions on the regular market.
b. Over the past 12 months, the average market capitalization value has been in the top 60 in the regular market.
c. It has been listed on IDX for at least 3 months.
Assymetric Information and Signalling Theory
According Manurung (2013), investors who have experienced investing in the market are always looking for information about the stock first before making an investment. While there are investors who invest only get very minimal information on the market. A smart investor will have a discussion with the analyst to get the full picture of the company so that it invests appropriately and gains future capital gain.
information is always on hold and informs it in due time. In accordance with the previous description, then there is a difference in information owned between investors with corporate agents. Investors have fairly insufficient information while the agent has complete information. Differences of information owned by companies and investors are known as asymmetric information.
Signaling theory is developed in economics and finance to take into account that insiders generally have better and faster information relating to the conditions and prospects of the company than others. The emergence of asymmetric information is difficult for investors in assessing objectively related to the quality of the company. The statements made by the manager are in doubt because the good companies and bad companies alike claim that the company has good prospects. The emergence of this asymmetric information problem makes investors on average give a lower rating to all the company's shares (Arifin, 2007: 11).
Information is an important element for companies and investors because it contains everything associated with the company both in the past and now. Complete, accurate, relevant and timely information is indispensable for investors in the capital market as an analytic tool to make a decision. If an information is considered positive it will affect the capital market when the information is received. The reaction can be seen from the change of return and Trading Volume Activity around the period of the information event is published (Rohmiyati, 2017: 39)
Previous Researh
and Abdul Qoyum (2012) in his journal Testing the Semi Strong Efficiency of Islamic Capital Market with a Study In Jakarta Islamic Index, in this study stated that JII is not classified in an efficient market in information. Rica Syafitri Sirait, Wiwik Tiswiyanti and Fitrini Mansur (2012) examined the impact of the change of the Minister of Finance of the Republic of Indonesia on the abnormal return of banking companies listed on the IDX, concluding that there is a significant difference between Average Abnormal Return (AAR) before and after the change finance minister in 2010.
Lakshmi Swastika Wardhani (2012) examined the reaction of Indonesian Capital Market to the event of Jakarta Second Round Governor Election 2012 (Event Study at Composite Stock Index Member 100), concluded that Indonesia capital market responded to information from DKI Jakarta Second Round Regional Election 2012 as good news , indicated by the appearance of an average of abnormal returns that are of significant positive value around the date of the occurrence of the event. I Gede Bhakti Pratama, Ni Kadek Sinarwati and Nyoman Ari Surya Dharmawan (2015) examined the Indonesian capital market reaction to political events (Event Study on the Inauguration of Joko Widodo as the President of the 7th Indonesian Republic), concluded that the inauguration of Joko Widodo as President The 7th Republic of Indonesia does not contain significant information content for investors, which makes the market unresponsive.
examine the effect of corporate social responsibility disclosure against abnormal return, the result of information disclosure CSR in the annual report has a significant positive effect on the abnormal return.
I Nyoman Suta Werdhy (2013) studied the analysis of differences in abnormal return and trading volume activity before and after stock split, concluding there is no difference of abnormal return before and after stock split policy, but there is difference of trading volume activity before and after stock split. Ni Putu Sentia Dewi and I Nyoman Wijana Asmara Putra (2013) examined the effect of right issue announcement on abnormal return and stock trading volume, concluded that right issue announcement has no significant effect to abnormal return of companies doing right issue but has significant effect to volume stock trades.Ali Sadikin (2011) examines the analysis of stock returns and stock trading volumes, before and after stock split events (case studies of publicly listed companies on the Indonesia Stock Exchange) found that there was no significant difference in average stock prices in the preceding period and after the stock split announcement. R. Andi Sularso (2003) examines the effect of dividend announcement on stock price changes before and after the ex-dividend date on the Jakarta Stock Exchange (BEJ) found that the stock price reacted positively to the ex-dividend date information, good news (investors who understand ex-dividend date information, buy stock before event date at lower price with expectation of stock price at ex-dividend date increase so that can get positive abnormal return).
Research Methodology
533 companies.The sample represents a portion of the total population, which consists of selected or selected members of the existing population (now, 2006: 123). Samples taken in this study consisted of 30 companies listed in the Jakarta Islamic Index and 17 companies listed on Index Liquid 45 during the observation period. Of the 45 companies listed in LQ45 a number of 28 companies registered in JII as sharia shares.
The sample selection was done by purposive sampling method. According Sekaran (2006: 136), purposive sampling method is a technique of determining the sample with certain considerations. Where sampling in this case is limited to specific groups that can provide the desired information. The sample selection refers to the shares of the Jakarta Islamic Index listed on the announcement of the Indonesia Stock Exchange. Peng-00.917 / BEI.OPP / 11-2016 (period December 2016 s.d. May 2017) and refers to LQ45 shares listed in the announcement of the Indonesia Stock Exchange. Peng-00025 / BEI.OPP / 01-2017 (period February 2017 s.d July 2017). In this study the criteria are as follows:
a. Shares of companies classified as liquid and listed in benchmark Jakarta Islamic Index and LQ45.
b. The shares of the Jakarta Islamic Index and LQ45 are active and registered during the observation period.
c. The company has complete data related to the variables used in the research, such as: closing price of daily stock price, daily stock trading volume, share share, and daily JCI data.
d. Company shares are not in two indexes.
Window Periods
T-5 T0 T+5
Picture 2: Observation Periods
In the observation period of the study on the visit of the Arab King March 1, 2017, starting from February 22, 2017 (t-5) to March 8, 2017 (t + 5) by March 1, 2017 as (t0). In this research use market adjusted method where the estimated security return is equal to market index return, so it does not require period estimation. The selection of window periods for 10 days of exchange is considered sufficient to determine whether there are differences in average abnormal return and average trading volume activity. The window period is too short, the likelihood of effect or effect will not be captured during the event in full. While the window period is too long too not too good, because other counfounding events such as right issue, stock split, dividend announcement, and others, can be caught in that period (Hartono, 2010: 23).
Sources of data used in this study is secondary data, ie data obtained in the form of finished (Supriyanto: 2009). Secondary data refers to information collected by a person, and not a researcher who conducts a recent study. The secondary data in this study are as follows:
Indonesia No .: Peng-00025 / BEI.OPP / 01-2017 dated January 25, 2017.
b. Daily share price of companies entering JII and LQ45 at the beginning of the estimated period until the end of the event period obtained from the website www.idx.co.id and www.finance.yahoo. com.
The main data to be used in the study include daily closing price and daily trading volume of companies listed in the Jakarta Islamic Index and LQ45 during the study period.
Research Technique
Abnormal Return
The steps in the calculation of abnormal return, namely (Hartono, 2014: 648)
a. Calculate the actual return (Actual Return), to determine the comparison between today’s stock price with the previous stock price, that is by the formula:
Rit = (1)
Where;
Rit : actual return of stock i at time t Pit : JII and LQ45 at time t
Pit-1 : JII and LQ45 at time t-1
b. Calculating the daily market return, daily market return used in this study is the JCI data, by the formula:
Where;
Rm, t = market return at time t IHSGt = IHSG at day t
IHSGt-1 = IHSG at day t-1
c. Calculating abnormal return using market adjusted model can be obtained by the formula:
Arit = Rit – Rm,t (3)
Where;
ARit = abnormal return of the securities i in the period of t-event
Rit = the actual return that occurs for the securities i in the periodt-event
Rm, t = Expected return of the security i at period of t-event
d. Calculate the average abnormal return (average abnormal return), by the formula
AARt = (4)
Where;
AARt = average abnormal return or average abnormal return
k = number of sample shares on day t Arit = abnormal return at time t
event date. CAR can be calculated by the formula:
CAR = ∑n
i=1 ARi,t
(5) Where;
CAR = Cumulative abnormal return
ARit = Abnormal return of stock t during observation period
f. Calculating the accumulated average abnormal return (AAR) or cumulative average abnormal return (CAAR), can be calculated by summing up the cumulative abnormal return divided by the number of populations, by the formula:
CAAR = (6)
Where;
CAAR = average cumulative abnormal return
CARit = cumulative abnormal return of stock i at time t k = total population
g. Calculate standard error estimation (KSE) by using market adjusted model method with the formula:
KSEt = (7)
Where;
KSEt = Standard error estimation on day t-in event period ARi, t = abnormal return of i-th securities for day t in the
event period
AART = average abnormal return of i-th security for day t in event period
h. Parametric Statistics Test
This test uses t-test, by comparing t-count with t-table. This test has a purpose to see the significance of the average abnormal return in the event period. To test the hypothesis t-count can be obtained by the formula:
Thitung= (8)
Where;
AARt = Average abnormal return on day t KSEt = Standard error estimation on day t
Trading Volume Activity
Trading Volume Activity (TVA) is used to see whether an information affects investors' decision to trade differently from normal trading. Stock trading volume activity with TVA indicator in general can be formulated as follows:
a. Calculates Actual Trading Volume Activity
The formula used to calculate trading volume activity is as follows:
TVAit = (9)
Where;
TVAi.t = activity of securities trading volume i in period t
b. Calculates Expected Trading Volume Activity
Where;
E (TVAt) = trading volume activity expectation at period t
c. Calculating Abnormal Trading Volume Activity (AbTVA)
AbTVAi,t = Actual TVAi,t – E(TVAi,t) (11)
d. Calculates Average Abnormal Trading Volume Activity
The way to calculate Average Abnormal Trading Volume Activity is as follows:
AAbTVAt= (12)
Note:
AAbTVA = Mean day trading day t
= Number of TVA shares on day t n = Number of samples
e. Statistical Calculating
This test uses t-test, by comparing t-count with t-table. This test has a purpose to see the significance of trading volume activity in the event period. To test the hypothesis t-count can be obtained by the formula:
Thitung= (13)
Information:
ATVAt = Average trading volume activity on day t
The amount of standard deviation is calculated by the formula: S =
S2 =
Information:
S2 = sample variant
S = standard deviation of sample xi = the amount of data per sample
n = number of samples / number of issuers observed
The standard error of estimate is determined by the standard deviation of the average trading volume during the period of the event.
When the Market React
Data analysis is done by calculating average abnormal return, cumulative average abnormal return, average abnormal trading volume activity, cumulative average abnormal trading volume activity and t-count.
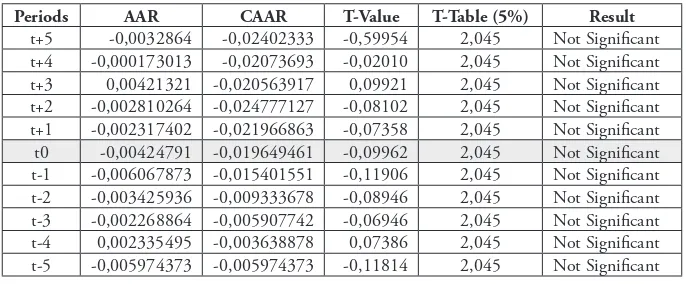
Tabel 1. Average Abnormal ReturnStock Listed in JII
Periods AAR CAAR T-Value T-Table (5%) Result
t+5 -0,0032864 -0,02402333 -0,59954 2,045 Not Significant t+4 -0,000173013 -0,02073693 -0,02010 2,045 Not Significant t+3 0,00421321 -0,020563917 0,09921 2,045 Not Significant t+2 -0,002810264 -0,024777127 -0,08102 2,045 Not Significant t+1 -0,002317402 -0,021966863 -0,07358 2,045 Not Significant t0 -0,00424791 -0,019649461 -0,09962 2,045 Not Significant t-1 -0,006067873 -0,015401551 -0,11906 2,045 Not Significant t-2 -0,003425936 -0,009333678 -0,08946 2,045 Not Significant t-3 -0,002268864 -0,005907742 -0,06946 2,045 Not Significant t-4 0,002335495 -0,003638878 0,07386 2,045 Not Significant t-5 -0,005974373 -0,005974373 -0,11814 2,045 Not Significant
*Significantat alpha 5%.
Average Abnormal Fluctuation Flat Rate (AAR) with cumulative average abnormal return (CAAR) can be seen in the following graph.
Graph 3.AAR and CAARJII
Graph 3 shows the movement of cumulative average abnormal return during the observation period. Visible cumulative average abnormal return experienced a fairly volatile movement. The highest cumulative average abnormal return occurs on t-4 or four days before the visit of the Arab King March 1, 2017 with a value of -0.003638878. The lowest cumulative average abnormal return occurs at t + 2 or two days after the visit of the Arab King March 1, 2017 with a value of -0.024777127.
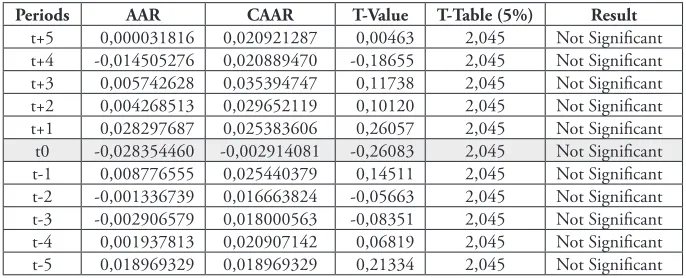
Table 2 Average Abnormal Return Stock LQ45
Periods AAR CAAR T-Value T-Table (5%) Result
t+5 0,000031816 0,020921287 0,00463 2,045 Not Significant t+4 -0,014505276 0,020889470 -0,18655 2,045 Not Significant t+3 0,005742628 0,035394747 0,11738 2,045 Not Significant t+2 0,004268513 0,029652119 0,10120 2,045 Not Significant t+1 0,028297687 0,025383606 0,26057 2,045 Not Significant t0 -0,028354460 -0,002914081 -0,26083 2,045 Not Significant t-1 0,008776555 0,025440379 0,14511 2,045 Not Significant t-2 -0,001336739 0,016663824 -0,05663 2,045 Not Significant t-3 -0,002906579 0,018000563 -0,08351 2,045 Not Significant t-4 0,001937813 0,020907142 0,06819 2,045 Not Significant t-5 0,018969329 0,018969329 0,21334 2,045 Not Significant
*Significant at alpha 5%. All t-value < t-table.
Table 2 shows that all t-calculated values are smaller than t-tables, either before or after the visit of the Arab King March 1, 2017. This suggests that during the visit of the Arab King of March 1, 2017 there was no significant effect on the difference abnormal return in Liquid45 (LQ45). Thus the results of this test reject the second hypothesis (H2).
The highest AAR value is shown at t + 1 of 0.028297687. This indicates that the market fluctuation is normal without the visit of the Arab King March 1, 2017. On t-1, the average value of positive abnormal return is insignificant, this condition occurs because the market tends to refrain against the visit of the Arab King March 1, 2017 on the next day (t0). At t + 1 the average value of abnormal return indicated positive is not significant, it is indicated that investors still see the fluctuation of stock price after implementation of visit of Arab King March 1, 2017.Investors are still holding stock trading by waiting for the completion of the effect of the visit of the Arab King March 1, 2017, this condition is shown on the average abnormal return t + 1 where the positive AAR value 0.028297687 bringing a new impact for investors in trading in the market capital.
average abnormal return (CAAR) can be seen in the following graph.
Graph 4.T-test Average Abnormal Return Stock listed in LQ45
Figure 4 shows the movement of cumulative average abnormal return during the observation period. Visible cumulative average abnormal return experienced a fairly volatile movement. The highest cumulative average abnormal return occurs at t + 3 or three days after the visit of the Arab King March 1, 2017 with a value of 0.035394747. The lowest cumulative average abnormal return occurs on the visit of the Arabian Arabic March 1, 2017 with a value of -0.002914081.
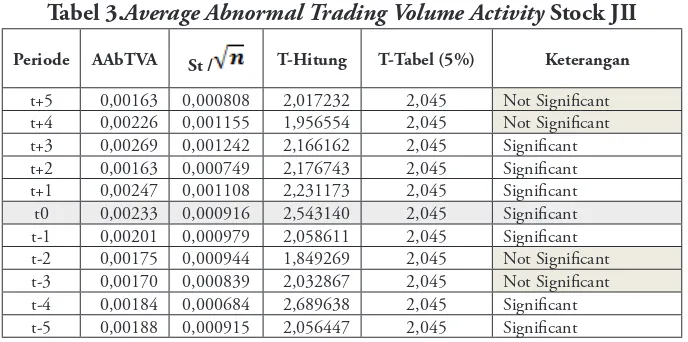
Tabel 3.Average Abnormal Trading Volume Activity Stock JII
Periode AAbTVA St / T-Hitung T-Tabel (5%) Keterangan
t+5 0,00163 0,000808 2,017232 2,045 Not Significant t+4 0,00226 0,001155 1,956554 2,045 Not Significant t+3 0,00269 0,001242 2,166162 2,045 Significant t+2 0,00163 0,000749 2,176743 2,045 Significant t+1 0,00247 0,001108 2,231173 2,045 Significant t0 0,00233 0,000916 2,543140 2,045 Significant t-1 0,00201 0,000979 2,058611 2,045 Significant t-2 0,00175 0,000944 1,849269 2,045 Not Significant t-3 0,00170 0,000839 2,032867 2,045 Not Significant t-4 0,00184 0,000684 2,689638 2,045 Significant t-5 0,00188 0,000915 2,056447 2,045 Significant
Table 3 shows that there are t-count values greater than t-tables on days t-5, t-4 and t-1 before the visit of the Arab King March 1, 2017, and on t + 1, t + 2 and t +3 after the Arabian King March 1, 2017. This indicates that the market is indeed proven to be affected on several days both before and after the events of the Arabian King's visit on March 1, 2017. This concludes that the third hypothesis is accepted or appropriate that there is an abnormal average difference in trading volume activity (AAbTVA) in the event of the visit of the Arab King March 1, 2017 on Sharia shares at the Jakarta Islamic Index (JII). Thus the results of this test accept the third hypothesis (H3). This reaction is also in accordance with the signaling theory that states that the market will react positively to information that is considered good news and react negatively to information that is considered bad news.
Graph 5.T-Test of Average Abnormal Trading Volume Activity Stock Listed in JII
The value of AAbTVA before the visit of the Arab King March 1, 2017 shows the value of 0.00188, 0.00184, 0.00170, 0.00175, and 0.00201. Then, following the visit of the Arab King March 1, 2017 the value of AAbTVA shows values of 0.00247, 0.00163, 0.00269, 0.00226, and 0.00163. Based on the graph above that AAbTVA before the visit of the Arab King March 1, 2017 tends to rise in the t-5 observation period until the eve of the visit of the Arab King March 1, 2017 on t-1. Then, after the visit of the Arab King March 1, 2017 AAbTVA valuestend to fluctuate and positive value.
abnormal trading volume activity, the following is the result of the calculation.
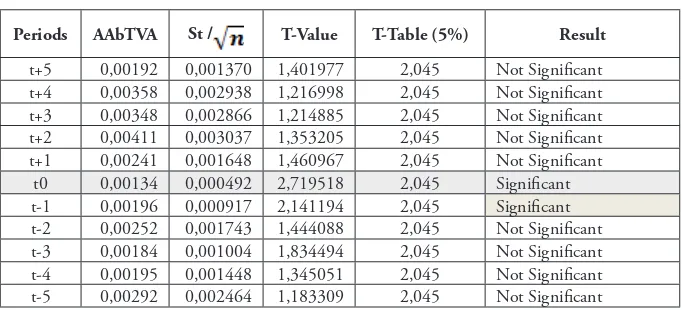
Tabel 4.Average Abnormal Trading Volume Activity Stock Listed LQ45
Periods AAbTVA St / T-Value T-Table (5%) Result
t+5 0,00192 0,001370 1,401977 2,045 Not Significant t+4 0,00358 0,002938 1,216998 2,045 Not Significant t+3 0,00348 0,002866 1,214885 2,045 Not Significant t+2 0,00411 0,003037 1,353205 2,045 Not Significant t+1 0,00241 0,001648 1,460967 2,045 Not Significant
t0 0,00134 0,000492 2,719518 2,045 Significant t-1 0,00196 0,000917 2,141194 2,045 Significant t-2 0,00252 0,001743 1,444088 2,045 Not Significant t-3 0,00184 0,001004 1,834494 2,045 Not Significant t-4 0,00195 0,001448 1,345051 2,045 Not Significant t-5 0,00292 0,002464 1,183309 2,045 Not Significant
Table 4 shows that there is a t-count value greater than t-table on day t-1 before the visit of the Arab King March 1, 2017, while on the day after the Arabian King March 1, 2017 the t-hit value tended to be less than t -table. This indicates that the market indeed proved to be affected on the day before the events of the King of Arabic cemetery of March 1, 2017. This concludes that the fourth hypothesis is accepted or appropriate that there is a difference in average abnormal trading volume activity (AAbTVA) in the event of the Arab King's visit March 1, 2017 on the stock sharia in Liquid 45 (LQ45). Thus the results of this test accept the fourth hypothesis (H4). This reaction is also in accordance with the signaling theory that states that the market will react positively to information that is considered good news and react negatively to information that is considered bad news.
Graph 6. T-test ofAverage Abnormal Trading Volume Activity Stock LQ45
The value of AAbTVA before the visit of the Arab King March 1, 2017 shows the value of 0.00292, 0.00195, 0.00184, 0.00252, and 0.00196. Then, following the visit of the Arab King March 1, 2017 the value of AAbTVA shows values of 0.00241, 0.00411, 0.00348, 0.00358, and 0.00192. Based on the graph above that AAbTVA before the visit of the Arab King March 1, 2017 tended to decrease in the t-3 observation period until the incident visit of the Arab King March 1, 2017 on t-1. Then, after the visit of the Arab King March 1, 2017 AAbTVA values tend to fluctuate and positive value.
Conclusion
market, Ardiansyah and Qoyum (2012: 1026) explained that Shariah Capital Market Efficiency will be achieved when the price of shariah securities is able to reflect all the information available. The sooner the new information is reflected in the price of securities, the more efficient the capital market (Husnan, 1996: 246). This indicates that the rules contained in the Fatwa of the National Shari'ah Council NO: 40 / DSN-MUI / X / 2003 on Capital Market and Application of Sharia Principles in the Capital Market area are very helpful to many parties and in accordance with the expectation for Islamic Capital Market including Market Capital is efficient, can even be more efficient than others.
References
Algifari. (2013). Statistik Induktif untuk Ekonomi dan Bisnis, edisi II. Yogyakarta: UUP AMP YKPN.
Ardiansyah, Misnen dan Abdul Qoyyum. (2012).Testing the Semi Strong Efficiency of Islamic Capital Market with Response to Infprmation Content of Divident Announcement : A Study In Jakarta Islamic Index. Jurnal of Modern Accounting and Auditing
Arifin, Zaenal. (2007). Teori Keuangan dan Pasar Modal. Yogyakarta: EKONESIA
Aziz, Abdul (2010). Manajemen Investasi Syariah. ALFABETA-Bandung Cheng, Megawati dan Yulius Jogi Christiawan. (2011). Pengaruh
Pengungkapan Corporate Sosial Responsibility Terhadap Abnormal Return. Jurnal Akuntansi dan Keuangan (Volume 13 No.1 Tahun 2011)
Darmadji, Tjiptonono dan Fakhruddin Hendy. (2008). Pasar Modal di Indonesia Pendekatan Tanya Jawab. Jakarta : Salemba Empat.
Darsono dkk. (2016). Dinamika Produk dan Akad Keuangan Syariah di Indonesia, Bank Indonesia.
Dewi, Ni Putu Sentia dan I Nyoman Wijana Asmara Putra. (2013). Pengaruh Pengumuman Right Issue Pada Abnormal Return dan Volume Perdagangan Saham. E-Jurnal Akuntansi Universitas Udayana (Volume 3 No. 3 Tahun 2013)
Gunaasih, Sang Ayu Putu Piastini. (2014). Pengaruh Peristiwa Non Ekonomi Terhadap Reaksi Pasar Saham-Saham Indeks LQ-45 Di Bursa Efek Indonesia. Tesis. Fakultas Ekonomika dan Bisnis. Universitas Gadjah Mada Yogyakarta.
Husnan, Suad. (1996). Dasar-dasar teoriportofolio dan analisis sekuritas. Edisi kedua. Yogyakarta: UPP AMP YKPN
Jogiyanto (2010). Studi Peristiwa : Menguji Reaksi Pasar Modal Akibat Suatu Peristiwa. Edisi Peristiwa. BPFE- Yogyakarta
Khan, A.Q. dan Ikram, Sana. (2010). Testing Semi-Strong Form of Efficient Market Hypothesis in Relation to the Impact of Foreign Institutional Investors’ (FII’s) Investments on Indian Capital Market. International Journal of Trade, Economics, and Finance, 1 (4), pp:373-379.
Madura, Jeff. (2012). International Financial Manajemen. 11th edition. United State Of America: South Western
Mansur, Fitriani dan Salman Jumaili. (2014). Reaksi Pasar Modal Terhadap Peristiwa Pemilihan umum Tahun 2014 Pada Perusahaan Terdaftar Di Bursa Efek Indonesia. Jurnal Penelitian Universitas Jambi: Seri Humaniora Vol. 16, No 2
Manurung, Adler Haymans. (2013). Teori Investasi: Konsep dan Empiris. Jakarta: PT. Adler Manurung Press
Mardani. (2015). Aspek hukum lembaga keuangan syariah di Indonesia. Jakarta: Prenada Media Grup
MES. Syariah Economic Outlook 2014
Mei, Jianping. (2002). Political Uncertainty, Financial Crisis, and Market Volatility.
Mufti, Aries dan Syakir Sula. (2014). Amanah Bagi Bangsa Ekonomi Berbasis Syariah. Edisi Kedua. Jakarta : Masyarakat Ekonomi Syariah Nafik, Nyhamaad. (2009). Bursa Efek & Investasi Syariah. Jakarta: Serambi
Ilmu Semesta
Nasarudin, Surya, Yustiavandana, Nevi, dan Adiwarman. (2011). Aspek Hukum Pasar Modal Indonesia. Jakarta: Perdana Media Grup
Presiden Republik Indonesia Ke-7). e-Journal S1 Ak Universitas Pendidikan Ganesha Jurusan Akuntansi Program S1 (Volume 3 No.13 Tahun 2015)
Rohmiyati, Yuni. (2017). Pengaruh Peristiwa Pemilihan Presiden Amerika Serikat 8 November 2016 Terhadap Harga Saham dan Volume Perdagangan pada Perusahaan yang masuk di Jakarta Islamic Index. Skripsi. Fakultas Ekonomi dan Bisnis Islam. Universitas Islam Negeri Sunan Kalijaga Yogyakarta
Sadikin, Ali. (2011). Analisis Abnormal Return Saham dan Volume Perdagangan Saham, Sebelum dan Sesudah Peristiwa Pemecahan Saham (Studi Pada Perusahaan yang Go Publik di Bursa Efek Indonesia). Jurnal Manajemen dan Akuntansi (Volume 12 No. 1 Tahun 2011)
Samsul, Muhammad. (2015). Pasar Modal & Manajemen Portofolio. Jakarta: Erlangga
Sekaran, Uma. (2006). Metodologi Penelitian Untuk Bisnis. Jakarta: Salemba Empat
Sheikhbahaei, Ali, Osman, Mohd. Hassan, Mohd. dan Ismail, Abd. (2013). Information Content in Dividend Announcement, a Test of Market Efficiency in Malaysian Market. International Business Research, 5(12), pp:38-45.
Sirait, Rica Syafitri, Wiwik Tiswiyanti, dan Fitrini Mansur. (2012). Dampak Pergantian Menteri Keuangan RI Tahun 2010 Terhadap Abnormal Return Perusahaan Perbankan Yang Terdaftar Di BEI. e-Jurnal Binar Akuntansi (Volume 1 No. 1 Tahun 2012)
Sularso, R. Andi (2003). Pengaruh Pengumuman Dividen Terhadap Perubahan Harga Saham (Return) Sebelum dan Sesudah Ex-Dividend Date di Bursa Efek Jakarta (BEJ). Jurnal Akuntansi dan Keuangan (Volume 5 No. 1 Tahun 2003)
Supriyanto. (2009). Metodologi Riset Bisnis.Jakarta: Indek
Surawijaya, Asri san Arif Setiawan. Reaksi Pasar Modal Indonesia Terhadap Peristiwa Politik Dalam Negeri (Event Study Pada Peristiwa 27 Juli 1996)
Suryomurti, Wiku. (2011). Super Cerdas Investasi Syariah. Jakarta: Qultum Media
The World Bank. (2014). World Investment And Political Risk 2013. Washington, DC: MIGA, World Bank Grup
Umar, Husein. (2013). Metode Penelitian Untuk Skripsi dan Tesis. Jakarta: Rajagrafindo.
Umar, Peter. (2006). Analisis Efisiensi Pasar Saham Syariah dengan Event Studi: Pengaruh Pengumuman Pembagian Dividen Pada Return Harga Saham-Saham Jakarta Islamic Index. Tesis. Perpustakaan Universitas Indonesia.
Werdhi, I Nyoman Suta. (2013). Analisis Perbedaan Abnormal Return dan Trading Volume Activity Sebelum dan Sesudah Stock Split. Jurnal Ilmiah Universitas Bakrie (Volume 1 No. 2 Tahun 2013)
Wardhani, Laksmi Swastika. (2012). Reaksi Pasar Modal Indonesia Terhadap Peristiwa Pemilihan Gubernur DKI Jakarta Putaran II 2012 (Event Study pada Saham Anggota Indeks Kompas 100). Jurnal Ilmiah Mahasiswa Fakultas Ekonomi dan Bisnis
Yusup, Aldi Muhammad. (2012). Efisiensi Pasar Modal Syariah dengan Event Studi: Pengaruh Pengumuman Pembagian Dividen terhadap Harga-harga Saham Jakarta Islamic Index
Websites:
Shirkah currently offers two routes to submit manuscripts. We highly recommend to submit the articles which are made using OJS (Open Journal System). Feel free register as author soon through visiting http:// shirkah.or.id/index.php/home/user/register. The authors may directly send their manuscripts, along with their resume, to shirkahiainsurakarta@ gmail.com. Please prepare your manuscripts, using following guidelines: 1. Manuscript must be written in English. Submitted articles should not
have been published or be under review for publication with another journal.
2. Manuscript’s length is about 15 – 20 pages, typed in one-half spaced on A4-paper size.
3. Manuscript must include an 150 – 200 word abstract and keywords. 4. Manuscript must be arranged as follows: Title, Name of Author,
E-mail address, Abstract, Keywords, Introduction (including method if any), Discussion, Conclusion, References.
5. Manuscript’s titles not more than ten words.
6. Manuscript must be submitted in Microsoft Word or RTF.
7. Arabic words should be transliterated according to the style of International Journal of Middle Eastern Studies.
8. Manuscript references are preferably derived from the up-to-date references.
9. The author’s resume should be submitted separately, consisting of at least full name, institutional address, phone number, areas of studies, and recent publications (if any).
Swann, G. M. Peter. (2014). The Economics of Innovation an Introduction. Cheltenhum & Northampton: Edward Elgar.
in-text citation: (Swann, 2014)
Articles in reference books
Alatas, S. F. (2006). Islam and the Science of Economics in Abu Rabi’, I.M. The Blackwell Companion to Contemporary Islamic Thought. USA: Willey-Blackwell (pp. 587-606).
in text citation: (Alatas, 2006)
E-Book
Hackett, Rosalind (2007). “Religous Dimentions of War and Peace: Introduction.” Dalam Gerrie ter Haar dan Yoshio Tsuruoka (Ed.), Religion and Society: An Agenda for the 21st Century (h. 3-6). Retrieved from http:// brill.nl.
in text citation: (Hackett, 2006)
Master’s thesis, from a commercial database
McNieI, D. S. (2006). Meaning through narrative: A personal narrative discussing growing up with an alcoholic mother (Master’s thesis). Available from ProQuest Dissertations and Theses database. (UMI No. 1434728)
in text citation: (Mc Niel, 2006)
Doctoral dissertation, from an institutional database
Adams, R. J. (1973). Building a foundation for evaluation of instruction in higher education and continuing education (Doctoral dissertation). Retrieved from http://www.ohiolink.edu/etd/
Bruckman, A. (1997). MOOSE Crossing: Construction, community, and learning in a networked virtual world for kids (Doctoral dissertation, Massachusetts Institute of Technology). Retrieved from http://www-static. cc.gatech.edu/--asb/thesis/
in text citation: (Bruckman, 1997)
Journal article with No DOI
Bourkhis, K., and Nabi, M. S. (2013). Islamic and conventional banks’ soundness during the 2007-2008 financial crisis. Journal Metrics, 22(2), 68-77.
in-text citation: (Bourkhis & Nabi, 2013).
Journal article with DOI
Ichwan, M. (2012). The Local Politics Of Orthodoxy: The Majelis Ulama Indonesia in the Post-New Order Banten. Journal Of Indonesian Islam, 6(1), 166-194. doi:http://dx.doi.org/10.15642/JIIS.2012.6.1.166-194
In text citation : (Ichwan, 2012)
Abstract as citation
Hasan, N. (2012). Islamist Party, Electoral Politics And Da’wah Mobilization Among Youth : The Prosperous Justice Party (PKS) in Indonesia. Journal of Indonesian Islam, 6(1), 17-47. Abstract from http:// jiis.uinsby.ac.id/index.php/jiis/article/view/97
in text citation : (Hasan, 2012)
Mass media article
Sahal, Akhmad (2014, March 2). Kiai Sahal dan Realisme Fikih.Tempo Magazine, p. 120.
Fisher, B. S., Cullen, F. T., & Turner, M. G. (2000). The Sexual Victimization of College Women. Research Report.
in text citation : (Fisher, Cullen, Turner, 2000)
Monograph
Routray, Bibhu Prasad (2013), National Security Decision-Making in India (RSIS Monograph No. 27). Singapura: Rajaratnam School of International Studies.
in text citation : (Routray, 2013)
Proceeding article
Sudibyakto, Hizbaron, D.R., & Jati, R (Ed.) (2009), Proceeding International Seminar Disaster Theory, Research and Policy. International seminar held by Sekolah Pascasarjana, Universitas Gajahmada, Yogyakarta, 8-9 Desember 2009.
in text citation : (sudibyakto and Jati, 2009)
Paper conference/seminar/symposium
Janutama, Herman Sinung (2011). “Kraton dan Hubungan Antar Agama.” Paper presented in Seminar Kraton dan Panatagama held by Center for the Study of Islam and Social Transformation (CISForm), Yogyakarta, 17 November.
in text citation :(Janutama, 2011)
Online article in web
Online research report
Kessy, S. S. A., & Urio, F M. (2006). The contribution of microfinance institutions to poverty reduction in Tanzania (Research Report No. 06.3). Retrieved from Research on Poverty Alleviation website: http://www. repoa.or.tz /documents_storage/Publications/Reports/06.3_Kessy_and_ Urio.pcif
in text citation : (kessy and urion, 2006)
Holy book
Qur an, 2 (25)
In text citation : (Q. al-Baqarah 2:25).
Encyclopaedia
Graycar, Adam (1992). Social Welfare Policy. Dalam Mary Hawkesworth dan Maurice Kogan (Ed.), Encyclopedia of Government and Politics (Vol. 1). London: Routledge.
in text citation : (Graycar, 1992)
Interview
Sultan Hamengkubuwono X (interview, 2011, April 19)
in text citation : (Hamengkubuwono, 2011)
Documentary film
Steijlen, Fridus (2008). A Day in the Life of Indonesia [documentary film, 58 minutes]. Leiden: KITLV Press.