Using group communication to monitor
web-based group learning
G.D.
Chen, C.Y. Wang & K.L. Ou
National Central University and National Taitung University, Taiwan
Abstract In a web group-learning environment, students must
communicate with other group members on the Internet to accomplish group projects and share knowledge. Communication is likely to affect performance and so analysing the relationship between communicative relationships and group performance may help teachers to monitor groups effectively. Certain tasks are necessary to perform such an analysis — recording group communication, extracting communication relationships and determining the relationship between group communication and group performance. This study developed a method for determining relationships and rules for predicting performance to enable teachers to take act appropriately according to the predicted performance of the group. Four group performance indicators are considered — average grades within a group, project grade, frequency of resource-sharing and drop-out rate. Experimental results are presented, concerning the application of the methodology to a web class of 706 students, divided into 70 groups. The experimental results show that group communication patterns significantly affect group performance.
Keywords: Collaboration; Communication; Discourse analysis; Email;
Group; Quantitative; Undergraduate; World-wide web
Introduction
Group learning (Webb, 1989; Stewart et al., 1999; 81–90) promotes individual responsibility, social awareness and communication skills. Several researchers agree that students perform better through group learning than by learning alone (Laughlin & Barth, 1981; Johnson & Johnson, 1989; Slavin, 1996). Students may learn through the assistance of other group members. Learning is both a group activity and a social process, and thus learning performance is strongly affected by peers (Lave & Wenger, 1991; Vygotsky, 1978; Brown & Palincsar, 1989).
In a group-learning environment, teachers must organise collaborative projects, forcing or encouraging students to communicate with other group members (Johnson & Johnson, 1991; Kimball, 1995; Soong et al. 2001). Teachers must also guide and monitor the group learning process to ensure that groups continue to collaborate effectively. Poor group development may cause members learning to suffer. Certain tools will assist teachers to monitor and understand the group learning process.
Accepted 1 November 2002
Researchers have used activity theory (Marx, Vygotsky) to analyse Computer Supported Collaborative Work (CSCW) systems (Kuutti, 1991) and distributed communities (Lewis, 1997). The decoding methods help researchers to understand clearly group members’ collaboration. Morgan (1986) proposed a metaphorical perspective method to conceptualise the nature of the processes and structures of organisations. Henri (1992) proposed a method for analysing messages during the computer-mediated communication (CMC) on five dimensions: participative, social, interactive, cognitive and metacognitive.
Group communication relationship (Watzlawick, 1967; 118-148) refers to the intragroup relationships determined by the interactions among members, which may be important for teachers’ prediction of group performance. This study considers three aspects of the group communication relationship, namely communication among the whole group, subgroups within the group and crucial members of the group. Thus, a method is required to determine predictive rules that link group communication and group performance to enable group learning to be monitored by observing communicative relationships in groups. After the predictive rules are determined, teachers of web-based systems can monitor group development, predict group performance and efficiently intervene in group learning.
However, teachers cannot easily determine group communications and derive predictive rules in conventional classrooms for the following reasons:
• recording communication within a group is hard. In a conventional classroom,
group members may communicate through writing notes or talking. These communications may be recorded on videotapes or by requesting student reports. Recording and extracting information remain difficult because reporters or recorders are not always able to record all the communications.
• the contents of group communication are always extensive and disorganised: much effort is required to capture communicative relationships based on paper records or videotapes. Moreover, the communicative patterns (Milson, 1973) and the characteristics of communication in groups, such as the times someone talks to someone else, cannot be determined directly from the content of the
communication.
• a mechanism for predicting group performance is required to help a teacher monitor group progress. Without a web-based group monitoring system, teachers may not be able to predict group performance from observations of group communications and rules governing relationships.
In the absence of a web-based group learning environment, significant time and effort has to be expended in watching videotapes to track and analyse group communication. Some researchers have used computer programs to record group communications in a computer mediated communication (CMC) environment (McGrath & Hollingshead, 1993) and group learning behaviour and communication can be stored in a database for subsequent analysis.
communication graphs, communication patterns, subgroups and critical members. The communication graph resembles a social network, organised as nodes and directed links between nodes. The nodes represent group members, while the directed links represent communications among members and the implications of communication relationships. Therefore, group communication relationships can be captured by analysing GLCN.
Besides the communication graph, GLCN representation also adopts Milson’s communication patterns (Milson, 1973) to represent the communication among the entire group. Moreover, GLCN also uses p* (Wasserman & Pattison, 1996) to represent the subgroups with two or three members. Special types of edges and nodes from graph theory are used to identify certain types of group members. The communication patterns categorise the interactions of members according to the topology of the group communication graph. Essentially, group communication logs are transformed into GLCN representation, and p* and communication patterns are then used to specify it. In this research, tools have been developed for:
• transforming group communication logs into GLCN representation; • categorising communication patterns and
• capturing p* attributes and members of special types.
A means is required to determine rules to predict group performance. Web-based group learning systems can use predictive rules to help teachers predict future group performance. Thereafter, teachers can intervene in groups and apply an appropriate teaching strategy to make group learning more effective. Another approach is to rearrange unsuccessful groups or reassign failing group members to other groups.
Group learning performance in this research included four primary indicators: average grade of group members; group project grade; frequency of sharing resources and drop-out rate. Also, a visualisation tool useable by teachers to monitor group communication patterns was developed. The tool can identify a student who does not participate in group collaboration, allowing the teacher to intervene in a timely fashion. Then, SPSS was used to determine whether learning performance is related to the characteristics of group communication. If such a relationship exists, a performance prediction tool can be built to provide teachers with information on group performance allowing group collaboration to be made more effective.
Group learning communication network
The contents of group communication must first be organised to elicit the communicative relationships within a group. This study proposes a communication representation for organising intragroup communication and extracting group communication relationships.
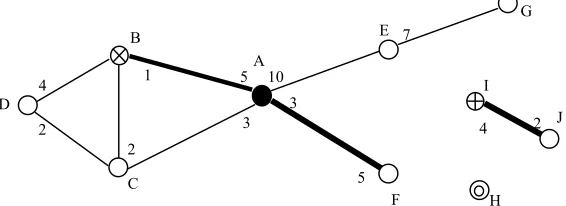
GLCN is based on the idea of representing social networks. The communication graph of GLCN represents the communicative relationships among group members with nodes and links in a network. The GLCN representation includes three parts: communication graph; communication pattern, and p* and critical graph elements. The first component represents visually the contents of group communication, allowing a teacher to understand the group communication situation, and thus classify the group communication relationships into various communication patterns. Figure 1 illustrates an example of GLCN.
A communication graph consists of nodes and links. Figure 1 presents group members as nodes with various types of symbols, and the communications are represented as numbered links.
Five types of nodes exist: ‘
•
’ represents a group leader; ‘⊗’ represents a group coleader; ‘⊕’ represents the reporter; ‘O’ represents any other kind of member, and a hollow node represents a member who does not communicate with any other members of the same group. Group members elected the leader, coleader and reporter in the first week of the course.Two types of links exist: a thick link represents the fact that the two members at each end have sent a message to the other, and a thin link represents the fact that a member has delivered a message to the other, but has not received any response. The number near a link represents the number of messages delivered from one member to the other member at the end of the link.
Figure 1 shows 10 nodes, representing 10 members of a group, from A to J. Member A is the group leader; member B is the group coleader; and member I is the group reporter. Member A sent five messages to member B. Meanwhile, member H does not communicate with any other members.
The GLCN involves two components — communication pattern and p* elements. Communication patterns are introduced to represent communication status within the group. This study aimed to determine whether group communication patterns are related to group performance, and if such a relationship exists, how it can be used to predict group performance. p* elements are also introduced to represent subgroups that contain two or three members. The main goal is to provide a tool to enable teachers to predict group performance from communicative relationships within the group. Computers can efficiently process decision-trees with several attributes and value ranges to predict group learning performance.
Two related models are used to analyse communicative relationships — Milson’s communication patterns (Milson, 1973) and Wasserman’s p* model (Wasserman & Pattison, 1996; Anderson et al., 1999). These two models are explained below.
D
A B
C
F E
G
H 5
1 4
2 3
10 3
7
5
I
J 2 4 2
Communication patterns
Milson (1973) introduced communication patterns for representing the communication in a group. These patterns may serve as useful indicators for estimating group performance. The seven patterns including the ideal Milson communication pattern are shown in Fig. 2.
Group communication is classified according to one of the graphs. But communication is not easily categorised into a Milson’s pattern because patterns are not limited to those patterns. However, teachers can classify group commun-ication according to its closest Milson’s pattern, using a visualisation tool that generates a group communication graph from the communication log, see below. The teacher first rearranges the graph into the layout of a Milson pattern and then performs pattern recognition according to the specification of Milson.
The following features of the communication in GLCN reveal group communication status.
• Participants: number of group members.
• Marginal participants: number of students not involved in any subgroup with more than two members.
• Out-degree: number of communication links from a node. • In-degree: number of communication links to a node.
• Density: the proportion of all links that contrast with completed graph. For example, the total number of possible communication links in Fig. 1 is
10 2
C
= 10(10–1)/2 = 45; allowing for bi-directionality, the number of communication links in an ideal communication graph is 90. The number of communication links in Fig. 1 is 12, and thus the density in Fig. 1 is 0.133. • Aggregation operators: the maximum value (MAX), minimum value (MIN),average value(AVG) and the standard deviation (SD) of the above attributes, as in the maximum out-degree or the average in-degree of a group.
The six attributes and the communication graph can together be used to classify the communication pattern of a group. These attributes can also used to construct decision trees.
p* elements for subgroups and elements from graph theory
The p* model is a statistical model for modeling relationships among actors. Figure 3 presents the subgroup patterns in the p* model while the following attributes are subgroup patterns in the p* model:
• mutuality = number of reciprocal communication pairs; for example, in Fig. 1, the mutuality is three (A –B, A-F and I-J)
• transitivity = number of transitive node: For example, in Fig. 1, A communicates with C; C communicates with B, and A communicates with B. All the nodes A, B and C are transitive nodes.
• cyclicity = number of cyclical communications; for example A communicates with C; C communicates B, and B communicates with A
• 2-in-stars = number of pairs of members who communicate with a third member • 2-out-stars = number of individual members who communicate with another two
members
• 2-mixed-stars = number of communications with an out-going link and an incoming link; for example A communicates with B and B communicates with C. The above p* variables are illustrated in Fig. 3. The p* is associated with the communication patterns of small subgroups. However, p* does not include special
types of elements in a communication graph. Consequ-ently, this study introduced elements from graph theory which are important in analysing abstract graphs. Four elements are analysed here, namely cut-point, bridge, leaf and flow. Following are the descriptions of the four elements.
• Cut-Point: a member who is the only communicator with two or more
subgroups. For example, in Fig. 1, student A is the cut-point of the group communication network.
• Bridge: the only communication link between two subgroups. For example, in
Fig. 1, the communication link between A and E is the only connection between two subgraphs and is therefore a bridge.
• Leaf: a node with only one link to another node, and which only receives
messages.
• Flow: amount of communication between two nodes.
Methodological overview
This study had two foci. First, the relationship between communicative relationships and group performance was explored. Second, a computer tool that can predict group performance from group communication was established. Two tools were implemented to assist researchers and teachers in determining the communication patterns and GLCN elements in group communication relationships — a visualisation tool to support the graphical classification of communication patterns and a GLCN element extractor. Furthermore, a machine learning tool, C5.0, was used to induce rules and to predict group performance from group communication relationships. This section introduces these methods, which facilitate teachers’ monitoring and guiding the development of the group, according to the predicted group performance.
Process flow for exploring the association between communicative relationships and group learning performance
Figure 4 illustrates the primary process and main flows for extracting necessary information from an on-line group discussion, and identifies the association between communication relationships and group performance. The group communication relationships extractor derives two types of organised communication relationships:
Reciprocal
2-in-star
2-mixed-star 2-out-star
Transitive Cyclic
• GLCN elements that form the communication graph and p* attributes, and • communication patterns analysed from the on-line group discussion.
Teachers can determine a group’s communication pattern using the relationship extractor. After all the characteristics of group communications are determined, a decision-tree analysis tool C5.0 is applied to them to generate the rules for predicting group learning performance.
Group performance has four indicators — average grade of group members; group project grade; frequency of sharing resources and drop out rate.
Group performance can be monitored if a tool is available for predicting performance based on information extracted from the communication relationship. Three tasks must be performed. First, tools are required to extract information from the communicative relationship. Second, a relation must be found between communication relationships and group performance. Third, relation rules must be devised to predict group performance.
Communication relationships extractor
A GLCN elements extractor and communication patterns extracting assistor were implemented to capture GLCN elements and communication patterns, and thereby to determine group communication relationships. The GLCN elements extractor extracts GLCN elements from on-line group discussions, while the communication patterns extracting assistor organises information extracted from the communication into a communication graph that can help teachers to observe a communication network and determine the communication pattern of a group.
Graph analysis algorithms (Lau, 1989) can be used to analyse group communication to help teachers extract the communication elements and present these elements in a structural form. The on-line group discussion dialogs are stored in database (see Table 1).
Table 1. Data schema of group communication
Attribute Name Group ID Deliver ID Receiver ID Date of Issue Subject Content
Data Type Number Number Number Date Text Text
Teachers can extract group GLCN elements from a specific period using the GLCN element extractor tool. This information can then be sent to the machine learning tool to predict group performance.
S
The influence parameters of communication relationships and
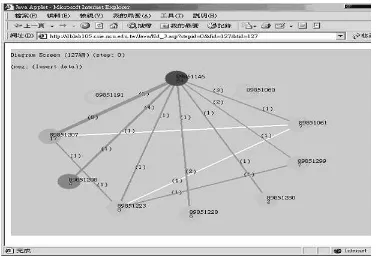
A visualising tool is required to help teachers to determine and structurally represent the communication pattern of a group (Freeman, 2000). Figure 5 represents the communication situation of a group graphically using the tool developed for extracting visualising patterns:
The group members are listed counterclockwise in descending ID number. However, a teacher will face difficulties in classifying a communication pattern from a communication graph, as shown in Fig. 5. The communcation pattern extraction assistor provides drag and drop functions, and supports teachers in rearranging a commun-ication graph to fit one of Milson’s communcation patterns. Figure 6 shows that a teacher can rearrange Fig. 5 such that its pattern can be
classified.
In Fig. 6, the group leader is linked to most group members, but few communication links exist among the remaining members. The communication of the group is thus clear enough to be regarded as ‘dominant leader’ pattern.
The GLCN element extractors and GLCN pattern extraction assistor extract the communication relationships of groups. This information is then used to help teachers monitor group learning, and generate rules for predicting performance based on communication relationships using decision tree analysis.
Decision tree analysis
The decision tree relates to a machine learning technique that can induce rules for predicting a target attribute from other attributes. The induction performed by the decision tree tool C5.0 (Quinlan, 1993) is based on the value of entropy (Mitchell, 1997; 52–80). For example, a set of groups can be clustered according to the values of attributes. If groups of a cluster have the same score, the cluster has the lowest entropy, while if every group in a cluster has a different score, the class has a highest entropy. The decision tree tool is used to generate a tree with the minimum entropy. Therefore, groups in the same class share similar communication relationships and performance.
C5.0 is a machine learning tool for classification, and was developed by Quinlan (Quinlan, 1993; 1996). There is a trial version on the Internet (www.rulequest.com/). C5.0 can help teachers generate a decision tree from the observed data and also to
Fig. 5. Original graph pattern represent on web browser about a group communication status
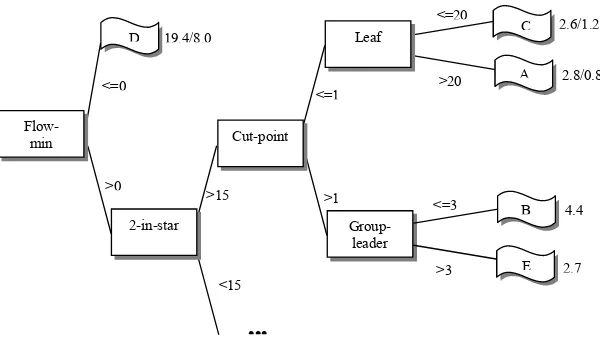
produce a predictive tool using the derived tree. The example decision tree in Fig. 7 predicts group grades in (A, B, C, D, E) from four of the p* components (Flow-min,
2-in-star, Cut-point and Group-leader). Mean of individual grades are ranked in
five levels from A to E, where A specifies that the group’s performance exceeds the average by at least one standard deviation; B means the performance exceeds the average under one standard deviation; C means the performance is lower than the average by up to one standard deviation; D means the performance is lower than the average by more than one standard deviation, and E means the group did not participate in the examination; that is, all members dropped out before the end of the semester. Figure 7 shows an induced decision tree built for a class after 10 trials (Quinlan, 1996) and illustrates how GLCN components and patterns affect group grades.
Experiment and results
The experiment was conducted in an introduction to a ‘Computer Networks and Applications’ course in a web-based learning environment. The curriculum includes fundamental concepts of computer networks and programming languages, and techniques for building WWW pages, such as TCP/IP, Network security, HTML, JavaScript and FrontPage. Group members communicated on the web and their communications were recorded in a database. Meanwhile, tools were developed to extract GLCN elements and communication patterns from the group communication behaviour. The decision tree tool C5.0 was used to extract rules for predicting learning performance from communication relationships, including patterns and GLCN elements. The predicted performance helped teachers monitor groups.
Experimental environment and subjects
An experiment was performed using the proposed methodology on a web-based group learning system. The class included seven teachers, five teaching assistants and 706 students of whom 459 (65.0%) were male. The mean age of the students was 32.38. The course ran from January 2000 to March 2000. Students were system-atically grouped into several heterogeneous groups (Chen et al., 2001); the grouping
Group- leader
D Leaf
Cut-point
2-in-star Flow-
min
C
A
B
E
•••
<=0
>0
<=1
>1
<=20
>20
<=3
>3
19.4/8.0 2.6/1.2
2.8/0.8
4.4
2.7 >15
<15
criterion included personal profile and thinking style. Personal profiles included gender, age, area of residence and educational background. Teachers selected the student’s thinking style (Sternberg, 1997) as the main determinant in grouping, hoping that each group had an equal distribution of members with different thinking styles. The teachers classified students using three thinking styles, as described by Sternberg, (1997), namely, judicial, legislative and executive. Each group was expected to have three kinds of members: those with an executive thinking style to set goals and to devise and implement plans; those with a legislative thinking style to provide criticism and challenge the goal and plan, and those with a judicial thinking style to evaluate the work.
Communication graphs were constructed by analysing communication logs, and other GLCN attributes were also extracted from the logs. The teachers then determined the communication patterns (using a communication graph visualisation tool). Communication graphs for groups were classified using six (k = 6, dfb = 5)
patterns, as proposed by Milson. Finally, 70 (dfw = 64) learning groups existed, each
containing 10–11 students. In the first week of the course, the group elected members as group-leader, coleader and reporter.
Effectof GLCN patterns on learning performance
Six Milson’s communication patterns were found from the experimental groups: five groups showed the unresponsive pattern, 18 the dominant leader pattern, 11 the tête-à-tête pattern, 10 the cliquish pattern, three the ideal pattern, and 23 the unsocial pattern. The four criteria of learning performance are as following: the average individual grades in a group, the project grades, the frequency of sharing resources and the drop out rate. One-way ANOVA was applied to each indicator to compare the effects to six communication patterns. The results are presented below.
Table 2. Means and standard deviations of average individual grades, and group numbers of each communication pattern
communication unresponsive dominant tête-à-tête cliquish ideal unsocial pattern leader
Mean 71.69187 75.74435 68.54046 74.04825 76.85906 38.29603
SD 10.18473 8.591956 8.506688 10.00014 11.85958 22.75898
Count (n) 5 18 11 10 3 23
Table 2 shows that the six patterns differ significantly (F5,64 = 16.57, p < 0.01), such
that at least one communication pattern is likely to affect average individual grades. Next, a one-way ANOVA was used to compare the effects of the six communi-cation patterns on group project grades. The results are presented below.
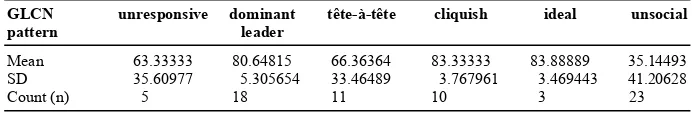
Table 3. Means and standard deviations of project grades, and the number of examples of each GLCN pattern
GLCN unresponsive dominant tête-à-tête cliquish ideal unsocial pattern leader
Mean 63.33333 80.64815 66.36364 83.33333 83.88889 35.14493
SD 35.60977 5.305654 33.46489 3.767961 3.469443 41.20628
Count (n) 5 18 11 10 3 23
Table 3 shows that group project grades differ significantly (F5,64 = 6.85, p < 0.01)
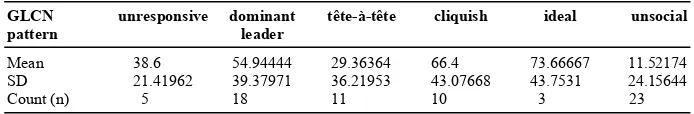
Third, a one-way ANOVA was applied again to compare the effect of communi-cative relationships on the frequency of sharing resources.
Table 4. Means and standard deviations of resource-sharing frequency, and group numbers of each GLCN pattern
GLCN unresponsive dominant tête-à-tête cliquish ideal unsocial pattern leader
Mean 38.6 54.94444 29.36364 66.4 73.66667 11.52174
SD 21.41962 39.37971 36.21953 43.07668 43.7531 24.15644
Count (n) 5 18 11 10 3 23
Table 4 shows that various communication patterns create significantly different levels of resource sharing (F5,64 = 5.83, p < 0.01), these implying that at least one
pattern probably influenced the frequency of sharing the resources of a group.
Finally, ANOVA was applied to compare the effect of communication relationships on drop out rate. The results are shown below.
Table 5. Means and standard deviations of drop out rate, and group numbers of each GLCN pattern
GLCN unresponsive dominant tête-à-tête cliquish ideal unsocial pattern leader
Mean 2.6 1.888889 3 2.1 1.666667 6.391304
SD 1.516575 1.07861 1.095445 1.37032 1.527525 2.589123
Count (n) 5 18 11 10 3 23
Table 5 shows that the communication pattern significantly influences (F5,64 = 16.73, p < 0.01) the drop out rate of a group.
Scheffe’s post hoc comparisons were performed to investigate which patterns significantly influence group performance and they reveal that the average individual grade of a group with an unsocial communication pattern differs significantly from that with any other communication pattern. The post hoc
comparisons reveal that the group project grade of groups with unsocial communication pattern differ significantly from those of groups with the dominant leader or the cliquish communication pattern.
Scheffe’s post hoc comparisons indicate that the resource sharing frequency of groups with the unsocial communication pattern differs significantly that of groups with the dominant leader or cliquish and they reveal that the group drop out rate of groups with an unsocial pattern differs significantly from those of groups with any other GLCN pattern.
In summary, groups with unsocial communication patterns have a low group learning performance for all indicators. The following section introduces the decision tree tool C5.0 for extracting decision rules for predicting group performance from communication relationships.
Extracting the rules that link communication relationships to group performance
Tools were established to record most of the communication that occurred in a web learning system in order to elucidate the influence of communication relationships on group learning performance. For efficiency and readability, the factor analysis of SPSS was applied to reduce the number of variables. Using Kaiser (1958) varimax factor analysis, the 69 factors can be reduced to four (λ³≥ 1, cumulative variance — 89.364%). These four factors are the number of communication links to the leader (LEADER_LINKS), number of bridges in the communication network (BRIDGE), number of communication links between nonleader members (COMMON_TO_COMMON) and number of 2-in-star of the p* model (2-IN-STAR). The C5.0 tool induced the following decision tree.
The partial tree in Fig. 8 depends on patterns and GLCN elements to predict the mean score of each group. For example if the communication pattern is DOMINANT_LEADER, the value of 2_IN_STAR less or equal then five, and the value of bridge is more then three, then the group score will be B. C5.0 generated 18 decision rules as Fig. 8 in this experiment for rule based prediction. One of the above rules associated with group communication patterns DOMINANT_LEADER are listed below.
Rule 0/13 indicates (Fig. 9) that if the communication pattern is DOMINANT_LEADER, the value of bridges is more than three but less then or
equal five, and the value of 2-in-stars is less then or equal five, then the group will have 75% probability to get grade C. The overall accuracy about using C5.0 to predict group performance is 78.9%. The details of the above trials are given below.
Figure 10 shows that groups obtained grade B: 20 were classified correctly and five were misclassified. These results demonstrate that the tool was not fully accurate. However, it provided a good means of determining groups that might perform poorly so that a teacher who focused on identifying groups that are likely to perform poorly can intervene in a timely fashion. The decision tree and decision rule analysis helped teachers to predict performance, improving their capacity to monitor groups and improving the effectiveness of group learning.
PATTERN = DOMINANT_LEADER: Fig. 8. Partial decision tree built by analysing communication relationship attributes targeted for
predicting group average score
Rule 0/13: (cover 2)
Fig. 9. One of the rules that correspond to the decision tree in Fig. 8
(a) (b) (c) (d) (e) classified as
Furthermore, all students’ communications were separated into two groups — communications related to group project tasks and social or emotional communications. The task-related communications were considered to analyse group communication pattern. The relationship between group project grades and communication patterns was analysed again. The results are as follows.
• Ideal: The mean group project grade is 86.4.
• Fragmented, cliquish: The average group project grade is 82.9. • Dominant leader: The average group project grade is 80.5. • Tête-à-tête: The average group project grade is 30.4. • Unresponsive: The average group project grade is 26.6. • Unsocial: The average group project grade is 0.
The above data indicate that Ideal, Fragmented and Dominant-Leader commun-ication patterns are often associated with high grades in group projects. Groups with the Ideal communication pattern gain the highest group project grade. Groups with the Tête-A-Tête and Unresponsive communication patterns obtain very low average group project grades because of poor group production and because some groups give up projects. All unsocial groups chose to give up and not produce a final project report. Their grades were thus zero.
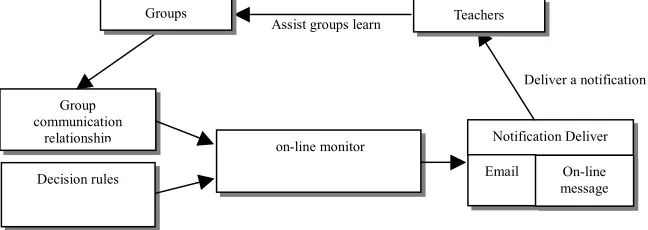
Supporting teachers in monitoring group learning performance
Figure 11 shows the workflow that extracts communication relationships and uses derived decision rules to predict group performance. When the on-line monitor detects groups that meet the conditions specified by the teacher, teachers were notified by email or on-line message system. Teachers could then intervene to improve group performance.
Conclusion
This study has presented a new method to explore the relationship between group communication relationships and group performance. Four group performance indicators were investigated: average individual grades of group members; group project grade; frequency of sharing resource and group drop-out rate. Tools for extracting communication relationships from a group discussion board were established to help both teachers and performance-prediction tools to describe intragroup communication. The experimental results show that communication patterns within a group significantly influenced group performance; groups with the unsocial communication pattern perform most poorly on all of the four indicators. The proposed mechanisms enabled teachers to save considerable time, since they no
on-line monitor Group
communication
relationship Notification Deliver
Email On-line message Assist groups learn
Groups Teachers
Decision rules
Deliver a notification
longer needed to infer group communication relationships from vast unorganised web logs. However, the precise effect of rules concerning group learning communication on group learning performance was hard to track.
Besides the communication pattern, four factors were extracted from 69 attributes of group communication relationships as crucial components in predicting group performance. The factors are the number of communication links to the leader (LEADER_LINKS), the number of bridges in the communication network (BRIDGE), the number of communication links among nonleader role members (COMMON_TO_COMMOM) and the number of 2-in-stars of the p* model (2-IN-STAR). This study applies the decision tree tool C5.0 to build a performance prediction tool according to the communication pattern and the stated four factors. Its prediction was 78.9% accurate. The accuracy of the identification of bad performance group was 96%.
This paper reports on help given to teachers to track communication relationships within groups, deriving elements and patterns of a communication network; supported decision tree analysis for predicting group performance based on communication relationships that were extracted from a group discussion board using particular tools and supported an on-line monitor of a group communication relationship and a notification system that allowed teachers assist groups in learning.
Closely monitoring group communication relationships helps teachers to identify groups that require intervention to improve their learning. Finally, the experimental results verify that the proposed system enabled teachers to monitor and guide a collaborative on-line learning program that involved 706 students.
Acknowledgements
The authors would like to thank the National Science Council and the Ministry of Education of the Republic of China for financially supporting this research under Contracts No. NSC 89–2520-S-008–019 and EDU 90-H-FA07-1-4.
References
Anderson, C.J., Wasserman, S. & Crouch, B. (1999) A p* primer: logic models for social networks. Social Networks, 21, 37–66.
Brown, A.L. & Palincsar, A.S. (1989). Guided, Cooperative Learning and Individual Knowledge Acquisition. In Knowing, Learning, and Instruction: Essays in Honer of Robert Glaser (ed. L.B. Resnick) pp. 393-451. Lawrence Erlbaum, Hillsdale, NJ. Chang, C.K., Chen, G.D. & Ou, K.L. (1998) Student portfolio analysis by data cube
technology for decision support of web based classroom teacher. Journal of Educational Computing Research, 19, 3, 307-328.
Chen, G.D., Ou, K.L., Liu, C.C. & Liu, B.J. (2001) Interventions and strategy analysis for web group-learning. Journal of Computer Assisted Learning, 17, 1, 58–71.
Freeman, L.C. (1984) Turning a profit from mathematics: The case of social networks. Journal of Mathematical Sociology, 10, 343–360.
Freeman, L.C. (2000) Visualizing social groups. Journal of Social Structure, 1, 1. Electronic journal: http://www.heinz.cmu.edu/project/INSNA/joss/index1.html
Henri, F. (1992) Computer conferencing and content analysis. In Collaborative Learning Through Computer Conferencing -The Najaden Papers (eds. A. Kaye) pp. 117–136. Springer-Verlag, Berlin.
Johnson, D. & Johnson, R. (1991) Learning together and alone. Prentice Hall, Englewood Cliffs, NJ.
Kaiser, H.F. (1958) The varimax criterion for analytic relation in analysis. Psychometrika, 23, 187–200.
Kimball, L. (1995) Ten ways to make online learning groups work. Educational Leadership, 53, 2, 54–56.
Kuutti, K. (1991) The concept of activity as a basic unit of analysis for CSCW research. In Proceedings of the Second European Conference on Computer-Supported Co-operative Work: EC-CSCW′91 (eds. L.J. Bannon, M. Robinson & K. Schmidt) pp. 249–264. Kluwer, Dordrecht.
Lau, H.T. (1989) Algorithms on Graphs. TAB Books Inc, Blue Ridge Summit, PA. Laughlin, P.R. & Barth, J.M. (1981) Group-to-individual and individual-to-group
problem-solving transfer. Journal of Personality and Social Psychology, 41, 1087–1093. Lave, J. & Wenger, E. (1991) Situated Learning: Legitimate Peripheral Participation.
Cambridge University Press, Cambridge.
Lewis, R. (1997) An Activity Theory framework to explore distributed communities. Journal of Computer Assisted Learning, 13, 4, 210–225.
McGrath, J.E. & Hollingshead, A.B. (1993) Putting the ‘Group’ Back in Group Support Systems: Some Theoretical Issues About Dynamic Process in Group with Technological Enhancements. Group Support Systems. New Perspectives. (eds. L.M. Jessup & J.S. Valacich) pp. 78-96. Macmillan, New York.
Milson, F. (1973) An Introduction to Group Work Skill. Routledge and Degan Paul, London. Mitchell, T.M. (1997) Machine Learning. McGraw-Hill, New York.
Morgan, G. (1986) Images of Organizations. Sage, Newbury Park, CA.
Quinlan, J.R. (1993) C4.5 Programs for Machine Learning. Morgan Kaufmann Publishers, San Mateo, CA.
Quinlan, J.R. (1996) Boosting, Bagging, and C4.5.In Proceedings of the Thirteenth National Conference on Artificial Intelligence (ed. W.R. Swartout) pp. 725–730. AAAI Press, Menlo Park, CA.
Seidman. S.B. & Foster, B.L. (1978) SONET-I: social network analysis and modeling system. Social Networks, 2, 85–90.
Slavin, R. (1996) Research on cooperative learning and achievement: what we know, what we need to know. Contemporary Educational Pshchology, 21, 1, 43–69.
Soong, M.H., Chan, H.C., Chua, B.C. & Loh, K.F. (2001) Critical success factors for on-line course resources. Computers and Education, 36, 101–120.
Sternberg, R. (1997) Thinking Styles. Cambridge University Press, Cambridge.
Stewart, G.L., Manz, C.C. & Sims, H.P. (1999) Team Work and Group Dynamic. John Wiley, New York.
Vygotsky. L.S. (1978) Mind in Society. Harvard University Press, Cambridge, MA. Wasserman, S. & Faust, K. (1994) Social Network Analysis: Methods and Applications.
Cambridge University Press, New York.
Wasserman, S. & Pattison, P. (1996) Logit models and logistic regressions for social networks: I. An introduction to Markov random graphs and p*. Psychometrika, 60, 401– 426.
Watzlawick, P. (1967) Pragmatics of Human Communication: A Study of Interactional Patterns. Pathologies and Paradoxes. W.W. Norton, New York.