UJI VALIDITAS DAN RELIABILIAS VARIABEL KESELAMATAN
KERJA
Case Processing Summary
N %
Cases
Valid 25 100.0
Excludeda 0 .0
Total 25 100.0
a. Listwise deletion based on all variables in the
procedure.
Reliability Statistics
Cronbach's
Alpha
N of Items
.837 4
Item Statistics
Mean Std. Deviation N
X1_1 3.76 1.052 25
X1_2 3.92 .702 25
X1_3 4.12 .833 25
Item-Total Statistics
Scale Mean if
Item Deleted
Scale Variance
if Item Deleted
Corrected
Item-Total
Correlation
Cronbach's
Alpha if Item
Deleted
X1_1 11.92 4.160 .748 .762
X1_2 11.76 5.857 .626 .819
X1_3 11.56 5.340 .635 .809
UJI VALIDITAS DAN RELIABILIAS VARIABEL LINGKUNGAN
KERJA
Case Processing Summary
N %
Cases
Valid 25 100.0
Excludeda 0 .0
Total 25 100.0
a. Listwise deletion based on all variables in the
procedure.
Reliability Statistics
Cronbach's
Alpha
N of Items
.933 10
Item Statistics
Mean Std. Deviation N
X2_1 3.60 .913 25
X2_2 3.68 .988 25
X2_3 3.52 .918 25
X2_4 3.64 .995 25
X2_5 3.64 1.036 25
X2_6 3.60 1.041 25
X2_7 3.72 .737 25
X2_8 3.72 .843 25
X2_9 3.72 .792 25
Item-Total Statistics
Scale Mean if
Item Deleted
Scale Variance
if Item Deleted
Corrected
Item-Total
Correlation
Cronbach's
Alpha if Item
Deleted
X2_1 33.04 43.957 .677 .928
X2_2 32.96 42.373 .749 .925
X2_3 33.12 43.443 .719 .926
X2_4 33.00 42.417 .739 .925
X2_5 33.00 42.417 .704 .928
X2_6 33.04 41.290 .794 .923
X2_7 32.92 45.827 .663 .929
X2_8 32.92 43.493 .791 .923
X2_9 32.92 45.077 .685 .928
UJI VALIDITAS DAN RELIABILIAS VARIABEL BEBAN KERJA
Case Processing Summary
N %
Cases
Valid 25 100.0
Excludeda 0 .0
Total 25 100.0
a. Listwise deletion based on all variables in the
procedure.
Reliability Statistics
Cronbach's
Alpha
N of Items
.878 6
Item Statistics
Mean Std. Deviation N
X3_1 3.96 .790 25
X3_2 4.00 .816 25
X3_3 3.72 .980 25
X3_4 3.72 .737 25
X3_5 3.84 .800 25
Item-Total Statistics
Scale Mean if
Item Deleted
Scale Variance
if Item Deleted
Corrected
Item-Total
Correlation
Cronbach's
Alpha if Item
Deleted
X3_1 19.20 12.250 .712 .853
X3_2 19.16 12.973 .538 .880
X3_3 19.44 11.423 .668 .862
X3_4 19.44 12.673 .684 .859
X3_5 19.32 11.810 .792 .840
UJI VALIDITAS DAN RELIABILIAS VARIABEL KEPUASAN
KERJA KARYAWAN
Case Processing Summary
N %
Cases
Valid 25 100.0
Excludeda 0 .0
Total 25 100.0
a. Listwise deletion based on all variables in the
procedure.
Reliability Statistics
Cronbach's
Alpha
N of Items
.783 4
Item Statistics
Mean Std. Deviation N
Y_1 3.80 .577 25
Y_2 3.80 .816 25
Y_3 3.92 .759 25
Item-Total Statistics
Scale Mean if
Item Deleted
Scale Variance
if Item Deleted
Corrected
Item-Total
Correlation
Cronbach's
Alpha if Item
Deleted
Y_1 11.64 4.407 .694 .710
Y_2 11.64 3.907 .573 .737
Y_3 11.52 3.843 .673 .690
Descriptive Statistics
Mean Std. Deviation N
Kepuasan Kerja (Y) 15.28 2.627 93
Keselamatan Kerja (X1) 15.38 3.039 93
Lingkungan Kerja (X2) 36.68 7.435 93
Beban Kerja (X3) 22.78 4.537 93
Variables Entered/Removeda
Model Variables Entered Variables
Removed
Method
1
Beban Kerja (X3), Lingkungan
Kerja (X2), Keselamatan Kerja
(X1)b
. Enter
a. Dependent Variable: Kepuasan Kerja (Y)
b. All requested variables entered.
Model Summary
Model R R Square Adjusted R
Square
Std. Error of the
Estimate
1 .898a .806 .800 1.175
a. Predictors: (Constant), Beban Kerja (X3), Lingkungan Kerja (X2),
Keselamatan Kerja (X1)
ANOVAa
Model Sum of Squares df Mean Square F Sig.
1
Regression 511.833 3 170.611 123.553 .000b
Residual 122.898 89 1.381
Total 634.731 92
a. Dependent Variable: Kepuasan Kerja (Y)
Coefficientsa
Model Unstandardized
Coefficients
Standardized
Coefficients
t Sig.
B Std. Error Beta
1
(Constant) 2.674 .668 4.003 .000
Keselamatan Kerja (X1) .201 .078 .232 2.570 .012
Lingkungan Kerja (X2) .132 .030 .374 4.470 .000
Beban Kerja (X3) .205 .055 .355 3.744 .000
Cuplikan Tabel Distribusi t
0
No
10%
5%
2,5%
71
1.294
1.667
1.994
72
1.293
1.666
1.993
73
1.293
1.666
1.993
74
1.293
1.666
1.993
75
1.293
1.665
1.992
76
1.293
1.665
1.992
77
1.293
1.665
1.991
78
1.292
1.665
1.991
79
1.292
1.664
1.990
80
1.292
1.664
1.990
81
1.292
1.664
1.990
82
1.292
1.664
1.989
83
1.292
1.663
1.989
84
1.292
1.663
1.989
85
1.292
1.663
1.988
86
1.291
1.663
1.988
87
1.291
1.663
1.988
88
1.291
1.662
1.987
89
1.291
1.662
1.987
90
1.291
1.662
1.987
91
1.291
1.662
1.986
92
1.291
1.662
1.986
93
1.291
1.661
1.986
94
1.291
1.661
1.986
95
1.291
1.661
1.985
96
1.290
1.661
1.985
97
1.290
1.661
1.985
98
1.290
1.661
1.984
99
1.290
1.660
1.984
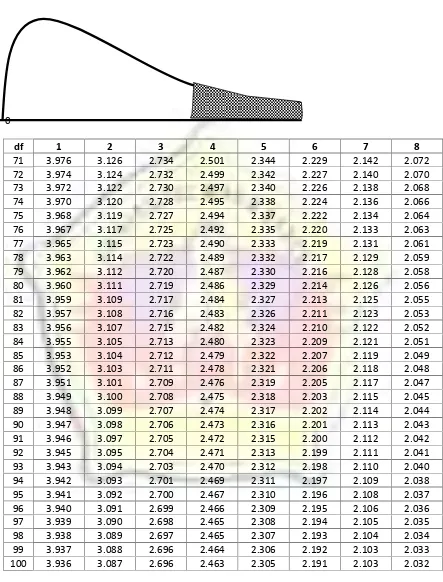
Tabel F untuk
= 0.05
0
df
1
2
3
4
5
6
7
8
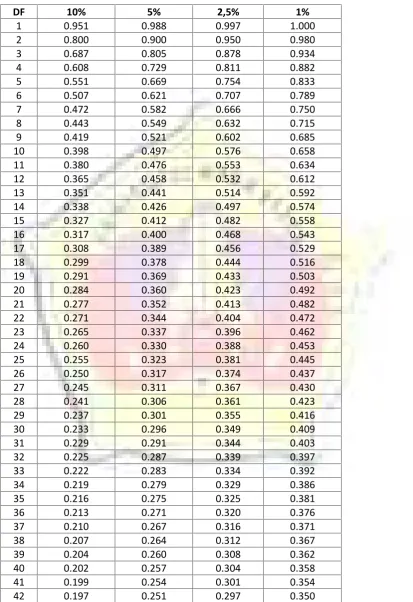
TABEL R
DF
10%
5%
2,5%
1%
1
0.951
0.988
0.997
1.000
2
0.800
0.900
0.950
0.980
3
0.687
0.805
0.878
0.934
4
0.608
0.729
0.811
0.882
5
0.551
0.669
0.754
0.833
6
0.507
0.621
0.707
0.789
7
0.472
0.582
0.666
0.750
8
0.443
0.549
0.632
0.715
9
0.419
0.521
0.602
0.685
10
0.398
0.497
0.576
0.658
11
0.380
0.476
0.553
0.634
12
0.365
0.458
0.532
0.612
13
0.351
0.441
0.514
0.592
14
0.338
0.426
0.497
0.574
15
0.327
0.412
0.482
0.558
16
0.317
0.400
0.468
0.543
17
0.308
0.389
0.456
0.529
18
0.299
0.378
0.444
0.516
19
0.291
0.369
0.433
0.503
20
0.284
0.360
0.423
0.492
21
0.277
0.352
0.413
0.482
22
0.271
0.344
0.404
0.472
23
0.265
0.337
0.396
0.462
24
0.260
0.330
0.388
0.453
25
0.255
0.323
0.381
0.445
26
0.250
0.317
0.374
0.437
27
0.245
0.311
0.367
0.430
28
0.241
0.306
0.361
0.423
29
0.237
0.301
0.355
0.416
30
0.233
0.296
0.349
0.409
31
0.229
0.291
0.344
0.403
32
0.225
0.287
0.339
0.397
33
0.222
0.283
0.334
0.392
34
0.219
0.279
0.329
0.386
35
0.216
0.275
0.325
0.381
36
0.213
0.271
0.320
0.376
37
0.210
0.267
0.316
0.371
38
0.207
0.264
0.312
0.367
39
0.204
0.260
0.308
0.362
40
0.202
0.257
0.304
0.358
41
0.199
0.254
0.301
0.354
43
0.195
0.248
0.294
0.346
44
0.192
0.246
0.291
0.342
45
0.190
0.243
0.288
0.338
46
0.188
0.240
0.285
0.335
47
0.186
0.238
0.282
0.331
48
0.184
0.235
0.279
0.328
49
0.182
0.233
0.276
0.325
50
0.181
0.231
0.273
0.322
51
0.179
0.228
0.271
0.319
52
0.177
0.226
0.268
0.316
53
0.175
0.224
0.266
0.313
54
0.174
0.222
0.263
0.310
55
0.172
0.220
0.261
0.307
56
0.171
0.218
0.259
0.305
57
0.169
0.216
0.256
0.302
58
0.168
0.214
0.254
0.300
59
0.166
0.213
0.252
0.297
60
0.165
0.211
0.250
0.295
61
0.164
0.209
0.248
0.293
62
0.162
0.207
0.246
0.290
63
0.161
0.206
0.244
0.288
64
0.160
0.204
0.242
0.286
65
0.159
0.203
0.240
0.284
66
0.157
0.201
0.239
0.282
67
0.156
0.200
0.237
0.280
68
0.155
0.198
0.235
0.278
69
0.154
0.197
0.234
0.276
Frekuensi Identitas Responden
Statistics
Jenis Kelamin Usia Pendidikan Masa Kerja
N
Valid 93 93 93 93
Missing 0 0 0 0
Frequency Table
Jenis Kelamin
Frequency Percent Valid Percent Cumulative
Percent
Valid
Pria 35 37.6 37.6 37.6
Wanita 58 62.4 62.4 100.0
Total 93 100.0 100.0
Usia
Frequency Percent Valid Percent Cumulative
Percent
Pendidikan
Frequency Percent Valid Percent Cumulative
Percent
Valid
SLTP 3 3.2 3.2 3.2
SLTA 56 60.2 60.2 63.4
D3/S1 34 36.6 36.6 100.0
Total 93 100.0 100.0
Masa Kerja
Frequency Percent Valid Percent Cumulative
Percent
Valid
3 - 8 th 12 12.9 12.9 12.9
9 - 14 th 16 17.2 17.2 30.1
15 - 20 th 28 30.1 30.1 60.2
> 20 th 37 39.8 39.8 100.0
Frekuensi Keselamatan Kerja
Statistics
X1_1 X1_2 X1_3 X1_4 Keselamatan
Kerja (X1)
N
Valid 93 93 93 93 93
Missing 0 0 0 0 0
Mean 3.73 3.78 4.09 3.77 15.38
Median 4.00 4.00 4.00 4.00 16.00
Mode 4 4 5 4 17
Sum 347 352 380 351 1430
Frequency Table
X1_1
Frequency Percent Valid Percent Cumulative
Percent
X1_2
Frequency Percent Valid Percent Cumulative
Percent
Valid
1 3 3.2 3.2 3.2
2 3 3.2 3.2 6.5
3 21 22.6 22.6 29.0
4 50 53.8 53.8 82.8
5 16 17.2 17.2 100.0
Total 93 100.0 100.0
X1_3
Frequency Percent Valid Percent Cumulative
Percent
Valid
1 1 1.1 1.1 1.1
2 2 2.2 2.2 3.2
3 23 24.7 24.7 28.0
4 29 31.2 31.2 59.1
5 38 40.9 40.9 100.0
X1_4
Frequency Percent Valid Percent Cumulative
Percent
Valid
1 2 2.2 2.2 2.2
2 7 7.5 7.5 9.7
3 21 22.6 22.6 32.3
4 43 46.2 46.2 78.5
5 20 21.5 21.5 100.0
Total 93 100.0 100.0
Keselamatan Kerja (X1)
Frequency Percent Valid Percent Cumulative
Percent
Valid
7 1 1.1 1.1 1.1
8 2 2.2 2.2 3.2
9 2 2.2 2.2 5.4
10 4 4.3 4.3 9.7
12 1 1.1 1.1 17.2
13 3 3.2 3.2 20.4
14 10 10.8 10.8 31.2
15 9 9.7 9.7 40.9
16 16 17.2 17.2 58.1
17 17 18.3 18.3 76.3
18 10 10.8 10.8 87.1
19 8 8.6 8.6 95.7
20 4 4.3 4.3 100.0
Frekuensi Variabel Lingkungan Kerja
Statistics
N Mean Median Mode Sum
Valid Missing
X2_1 93 0 3.57 4.00 4 332
Lingkungan Kerja (X2) 93 0 36.68 38.00 34 3411
Frequency Table
X2_1
Frequency Percent Valid Percent Cumulative
Percent
X2_2
Frequency Percent Valid Percent Cumulative
Percent
Total 93 100.0 100.0
X2_3
Frequency Percent Valid Percent Cumulative
Percent
Total 93 100.0 100.0
X2_4
Frequency Percent Valid Percent Cumulative
Percent
X2_5
Frequency Percent Valid Percent Cumulative
Percent
Total 93 100.0 100.0
X2_6
Frequency Percent Valid Percent Cumulative
Percent
Total 93 100.0 100.0
X2_7
Frequency Percent Valid Percent Cumulative
Percent
X2_8
Frequency Percent Valid Percent Cumulative
Percent
Total 93 100.0 100.0
X2_9
Frequency Percent Valid Percent Cumulative
Percent
Total 93 100.0 100.0
X2_10
Frequency Percent Valid Percent Cumulative
Percent
Lingkungan Kerja (X2)
Frequency Percent Valid Percent Cumulative
Percent
Frekuensi Variabel Beban Kerja
Statistics
X3_1 X3_2 X3_3 X3_4 X3_5 X3_6 Beban Kerja
(X3)
N
Valid 93 93 93 93 93 93 93
Missing 0 0 0 0 0 0 0
Mean 3.91 3.95 3.65 3.69 3.75 3.84 22.78
Median 4.00 4.00 4.00 4.00 4.00 4.00 23.00
Mode 4 4 4 4 4 4 26
Sum 364 367 339 343 349 357 2119
Frequency Table
X3_1
Frequency Percent Valid Percent Cumulative
Percent
X3_2
Frequency Percent Valid Percent Cumulative
Percent
Valid
1 4 4.3 4.3 4.3
2 3 3.2 3.2 7.5
3 10 10.8 10.8 18.3
4 53 57.0 57.0 75.3
5 23 24.7 24.7 100.0
Total 93 100.0 100.0
X3_3
Frequency Percent Valid Percent Cumulative
Percent
Valid
1 7 7.5 7.5 7.5
2 3 3.2 3.2 10.8
3 16 17.2 17.2 28.0
4 57 61.3 61.3 89.2
5 10 10.8 10.8 100.0
X3_4
Frequency Percent Valid Percent Cumulative
Percent
Valid
1 4 4.3 4.3 4.3
2 5 5.4 5.4 9.7
3 24 25.8 25.8 35.5
4 43 46.2 46.2 81.7
5 17 18.3 18.3 100.0
Total 93 100.0 100.0
X3_5
Frequency Percent Valid Percent Cumulative
Percent
Valid
1 2 2.2 2.2 2.2
2 3 3.2 3.2 5.4
3 26 28.0 28.0 33.3
4 47 50.5 50.5 83.9
5 15 16.1 16.1 100.0
X3_6
Frequency Percent Valid Percent Cumulative
Percent
Total 93 100.0 100.0
Beban Kerja (X3)
Frequency Percent Valid Percent Cumulative
22 9 9.7 9.7 37.6
23 12 12.9 12.9 50.5
24 1 1.1 1.1 51.6
25 12 12.9 12.9 64.5
26 13 14.0 14.0 78.5
27 9 9.7 9.7 88.2
28 10 10.8 10.8 98.9
29 1 1.1 1.1 100.0
Frekuensi Variabel Kepuasan Kerja Karyawan
Statistics
Y_1 Y_2 Y_3 Y_4 Kepuasan Kerja
(Y)
N
Valid 93 93 93 93 93
Missing 0 0 0 0 0
Mean 3.73 3.76 3.87 3.91 15.28
Median 4.00 4.00 4.00 4.00 16.00
Mode 4 4 4 4 16
Sum 347 350 360 364 1421
Frequency Table
Y_1
Frequency Percent Valid Percent Cumulative
Percent
Y_2
Frequency Percent Valid Percent Cumulative
Percent
Valid
1 1 1.1 1.1 1.1
2 5 5.4 5.4 6.5
3 17 18.3 18.3 24.7
4 62 66.7 66.7 91.4
5 8 8.6 8.6 100.0
Total 93 100.0 100.0
Y_3
Frequency Percent Valid Percent Cumulative
Percent
Valid
1 1 1.1 1.1 1.1
2 3 3.2 3.2 4.3
3 23 24.7 24.7 29.0
4 46 49.5 49.5 78.5
5 20 21.5 21.5 100.0
Y_4
Frequency Percent Valid Percent Cumulative
Percent
Total 93 100.0 100.0
Kepuasan Kerja (Y)
Frequency Percent Valid Percent Cumulative
Percent