Identification and Ranking of Black Spots:
Sensitivity Analysis
K. Geurts, G. Wets, T. Jacobs
Prof. dr. G. Wets
Kennis verkeersonveiligheid
LUC DAM, LUC BMA, PHL, VUB, VITO
Identifying and Ranking Black Spots:
Sensitivity Analysis
RA-2003-18
K. Geurts, G. Wets, T. Jacobs
Onderzoekslijn Kennis verkeersonveiligheid
DIEPENBEEK, 2003.
Documentbeschrijving
Rapportnummer: RA-2003-18
Titel: Identifying and Ranking Black Spots:
Sensitivity Analysis
Ondertitel:
Auteur(s): K. Geurts, G. Wets, T. Jacobs
Promotor: Prof. dr. G. Wets
Onderzoekslijn: Kennis verkeersonveiligheid
Partner: Limburgs Universitair Centrum
Aantal pagina’s: 22
Trefwoorden: sensitivity analysis, black spot, dangerous accident location, identification, selection, ranking, weighting values
Projectnummer Steunpunt: 1.2
Projectinhoud: Analyse en detectie van zwarte zones
Uitgave: Steunpunt Verkeersveiligheid bij Stijgende Mobiliteit, juli 2003.
Steunpunt Verkeersveiligheid bij Stijgende Mobiliteit Universitaire Campus
Gebouw D
B 3590 Diepenbeek
T 011 26 81 90 F 011 26 87 11
Samenvatting
In Vlaanderen worden momenteel ongeveer 1014 ongevallenlocaties als ‘gevaarlijk’ beschouwd. Deze gevaarlijke plaatsen of zogenoemde ‘gevaarlijke punten’ worden geselecteerd op basis van hun historische ongevallendata voor de periode 1997_1999. Meer bepaald wordt een combinatie van gewichten gebruikt om de gevaarlijke ongevallenlocaties te rangschikken en te selecteren: respectievelijk 1 voor elke licht gewonde, 3 voor elke zwaar gewonde en 5 voor elke dode (combinatie 1_3_5). In dit rapport wordt een sensitiviteitsanalyse uitgevoerd om te onderzoeken welke impact zal ontstaan op het identificeren en rangschikken van zwarte punten wanneer we 3 verschillende combinaties van gewichten hanteren die elk in overeenstemming zijn met een andere benadering van het verkeersveiligheidsprobleem: het vermijden van elk ongeval (1_1_1), het vermijden van dodelijke ongevallen (1_1_10) en het vermijden van ongevallen met doden en zwaar gewonden (1_10_10). Resultaten tonen aan dat een verschillende benadering van het verkeersveiligheidsprobleem en de overeenkomstige keuze voor een bepaalde combinatie van wegingsfactoren wel degelijk belangrijke gevolgen heeft voor het selecteren en rangschikken van zwarte punten. Verder zal een verandering in het verkeersveiligheidsbeleid en de weerspiegeling van dit beleid in de keuze van de wegingsfactoren niet alleen een belangrijk effect hebben op het aantal ongevallenlocaties dat zal wijzigen bij het selecteren en rangschikken van zwarte punten, het zal ook een belangrijke invloed hebben op het type van locatie dat geselecteerd zal worden en bijgevolg ook op toekomstige acties om deze locaties verkeersveilig te maken.
Summary
In Flanders, approximately 1014 accident locations are currently considered as ‘dangerous’. These ‘dangerous’ accident sites or so-called ‘black spots’ are selected by means of their historic accident data for the period 1997-1999. More specifically, a combination of weighting values, respectively 1 for each light injury, 3 for each serious injury and 5 for each deadly injury (combination 1_3_5), is used to rank and select the most dangerous accident locations. In this paper a sensitivity analysis is performed to investigate the impact on the identification and ranking of black spots of 3 different weighting value combinations each representing a different attitude towards the traffic safety problem: avoiding all accidents (1_1_1), avoiding all deadly accidents (1_1_10) and avoiding all accidents with serious or deadly injuries (1_10_10). Results show that a different attitude towards the traffic safety problem and the choice of the corresponding injury weighting values does have important consequences for the selection and ranking of black spots and for traffic safety actions in general. Furthermore, a change in the traffic safety policy and the reflection of this choice in the injury weighting values will not only have an important impact on the number of accident locations that will change when selecting and ranking black spots, it will also have an important effect on the type of accident locations that are selected and accordingly on the resulting future traffic safety decisions.
Inhoudsopgave
1.
INTRODUCTION
... 7
2.
DATA
... 8
3.
TECHNIQUES... 9
4.
RESULTS
...11
4.1 Evaluating The Ranking Order Of The 1014 Currently Most Dangerous Accident Locations 11 4.2 Evaluating The Ranking Order Of All Accident Locations 14 4.3 Evaluating The Ranking Order Of All Accident Locations with min. 3 accidents between 1997-1999 16
5.
CONCLUSIONS AND FURTHER RESEARCH...19
6.
REFERENCES...20
1 . I
N T R O D U C T I O NIn Flanders, approximately 1014 accident locations are currently considered as ‘dangerous’. These ‘dangerous’ accident sites or so-called ‘black spots’ are selected by means of their historic accident data for the period 1997-1999. Based on these data, each site where in the last three years 3 or more accidents have occurred, is selected. Then, a location is considered to be dangerous when its priority value (P), calculated using the following formula, equals 15 or more (Ministry of Flemish Community, 2001)
P = X + 3*Y + 5*Z, where
X = total number of light injuries Y = total number of serious injuries Z = total number of deadly injuries
To improve the traffic safety on these locations, the Flemish government, will each year, starting in 2003 for a period of 5 years, invest 100 million EURO to redesign the infrastructure of the 800 black spots with the highest priority value.
However, the choice for the different parameters used in the priority value formula will greatly influence the ranking and selection of the most dangerous accident locations. Therefore, in this research we will perform a sensitivity analysis to investigate the strengths and weaknesses of the currently used method to identify and rank black spots.
Not only will we evaluate the changes in the ranking orders for the 1014 accident locations that are currently considered as most dangerous, we will also investigate the effects on the ranking order of respectively all accident locations of Flanders for the years 1999 and all accident locations where at least 3 accidents occurred between 1997-1999. For these 3 datasets, we will investigate the effect of changing the 1_3_5 weighting values on the ranking and selection of the most dangerous accident locations.
2 . D
A T ATo allow for a sensitivity analysis on the currently used black spot criterion, this study is based on the same data used to select and rank the 1.014 dangerous accident locations. These data originate from a large data set of traffic accidents obtained from the National Institute of Statistics (NIS) for the region of Flanders (Belgium) for the period 1997-1999. More specifically, the data are obtained from the Belgian “Analysis Form for Traffic Accidents” that has to be filled out by a police officer for each road accident that occurs on a public road and that involves casualties. These traffic accident data contain a rich source of information on the different circumstances in which the accidents have occurred: course of the accident, traffic, environmental conditions, road conditions, human conditions and geographical conditions.
The accident data needed to perform this sensitivity analysis will be limited to the number of casualties per accident. Furthermore, these data are limited to accidents with casualties on numbered roads (i.e. motorways, regional and provincial roads linking towns), since the location of these accidents is accurately known by means of a hectometer stone marker. In total, 50961 traffic accidents with casualties are reported in this period. To account for crossroads and accordingly prevent double counts of accidents on multiple streets, the corresponding accident locations are corrected and are allocated one unique location identifier per accident. This results in 23184 unique accident locations included in the data set. On the one hand, we will concentrate on all of these accident locations to evaluate the stability of the current list of black spots when using different selection criteria. On the other hand, we will focus on the 1.014 most dangerous accident locations to explore the sensitivity of their ranking orders when using adapted weighting values.
3 . T
E C H N I Q U E STo investigate the effects of changes in the ranking and selection criteria of black spots, we will use a combination of different statistical techniques. First of all, the Spearman correlation coefficient is used to present the changes in the ranking order of accident locations. This coefficient takes into account the differences between the original and the modified ranking order to calculate the correlation between two ordered datasets. Table 1 gives an overview of the possible outcomes of the Spearman correlation coefficient and the associated interpretation for the linear relation between the two ordered datasets (Mansfield, 1980).
Definition 1: Spearman correlation coefficient (rs)
)
Table 1: Interpretation of Spearman correlation coefficient
Outcome Interpretation
rs = 1 Perfect positive linear relation between the rankings.
rs = 0 No linear relation between the rankings.
rs = -1 Perfect negative linear relation between the rankings.
Since the ranking orders of the accident locations are not completely independent between the different datasets, this analysis will be biased towards high values for the Spearman correlation coefficient. Therefore, this coefficient can not give any conclusions about the significance of the changes in ranking orders. It can, however, by approximation give some important insights into the dimensions of the shifts in the ranking orders of the 800 currently selected black spots (Moses, 1986).
Furthermore, the Spearman correlation requires that the accident locations in the two ranked datasets are the same. However, when considering the 800 most dangerous accident locations, it is possible that changing the weighting values of the ranking criterion will cause new accident locations to come into the top 800 black spots while other locations are removed from this data set. In this case, the Spearman correlation can not be used since we would like to compare the rankings of two datasets containing different elements. Therefore, we will use the percentage deviation to calculate the changes in the ranking order of the accident locations. As described in definition 2, the percentage deviation is calculated by dividing the number of accident locations that do not appear in both data sets by the total number of elements in one dataset.
Definition 2: Percentage deviation (pr)
T
G
−
=
1
p
r with G = Number of common elements in both datasetsT = Total number of elements in each dataset
When the percentage deviation value is small, the two ranked datasets will contain a great number of common elements. In a traffic safety context, this would mean that the current priority list of 800 black spots is rather stable, regardless of the used weighting values or the consideration of the number of passengers in the analysis.
Despite the fact that the percentage deviation only gives information about the number of accident locations that do not appear in both ranked datasets and does not take into account internal shifts in the ranking position of these common accident locations, it is an important measure for traffic policy. Additionally, the Spearman correlation can be used in combination with the percentage deviation to estimate the shifts in the ranking position of the common accident locations.
4 . R
E S U L T S4.1 Evaluating The Ranking Order Of The 1014 Currently Most
Dangerous Accident Locations
As explained in the introduction of this paper, the 1014 most dangerous accident locations are currently ranked and prioritized using respectively the values 1, 3, 5 as the different weighting values for a lightly (LI), seriously (SI) or deadly injured (DI) casualty of an accident.
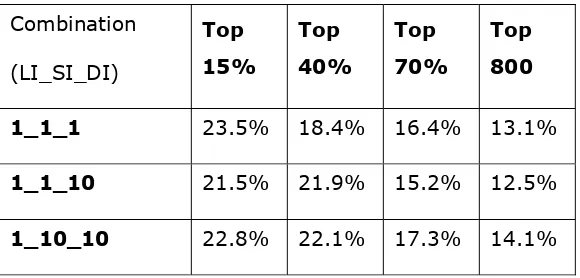
Table 2 gives an overview of the effects of changing the weighting values on the ranking order of these 1014 accident locations. More specifically, table 2 shows the percentage deviation values for different combinations of weighting values and for different subsets of the 1014 accident locations, all related to the ranking order of the currently used 1_3_5 weighting values.
Table 2: Percentage deviation values for different subsets of the 1014 currently most dangerous accident locations using different combinations of weighting values related to the currently used 1_3_5 combination
Combination
In particular, table 2 presents the combinations of weighting values that represent a specific attitude of policy makers towards traffic safety:
•
•
•
1_1_1: This combination of weighting values assumes that every casualty of a traffic accident is evenly important. Therefore, all accidents are evenly important and should be avoided, regardless of the severity of the injury.
1_1_10: Using these weighting values, attention will be focused on accidents with deadly injured casualties. Accidents with lightly or seriously injured casualties receive relatively small attention.
1_10_10: This last group of weighting value combinations discriminates between accidents with small injuries on the one hand and accidents with serious or deadly injuries on the other hand. It is assumed that a seriously injured person could just as easily have been killed in the accident and the other way around. Lightly injured persons, however, are assumed to be characteristic for less serious accidents and will be less taken into account when identifying black spots.
• 1_3_5: These combinations of weighting values use a more moderate approach to stress the importance of deadly accidents. As the injury types are more serious, the accident is considered to be more important. Note that the current black spot selection criterion is based on this proportion of weighting values.
Results of table 2 show that the changed weighting value combinations cause the different location subsets to deviate from the original location subsets from 12.5% to 23.5%. This means that in the most extreme case, 23.5% of the accident locations considered belonging to the 40% most dangerous accident locations of the 1014 dangerous accident locations using 1_3_5 weighting values do not appear in the top 40% when changing the weighting values to 1_1_10 or 1_10_10. On the other hand, when changing the weighting values to the combination 1_1_10, only 12.5% of the resulting most dangerous accident locations will differ from the currently 800 selected black spots. These results illustrate that a different attitude towards the traffic safety problem and the choice of the corresponding injury weighting values has important consequences for the selection and ranking of black spots and for traffic safety actions in general.
Furthermore, the percentage deviation values are on average smaller when more accident locations are involved in the analysis. A possible explanation could be that the accident locations with a higher ranking value, according to the 1_3_5 weighting values, are more sensitive to changes in the weighting values than the accident locations with smaller ranking values. However, we should take into account that the greater the top of accident locations that is considered for analysis (X), the more accident locations can obtain a different ranking order without falling out of the top X% most dangerous accident locations. As explained in section 3, the percentage deviation value gives no information about these internal changes in ranking orders.
In figure 1 the Spearman correlation coefficient is calculated for the 1014 currently considered most dangerous accident locations compared to different combinations of weighting values.
8_9_10 6_7_9 4_5_6 5_6_10 3_4_6 2_3_4 1_6_7 3_5_7 4_7_10 1_5_6 1_3_9 1_2_4 3_7_10 3_9_10 2_6_9
Injury weighting values
Spearman correlation
Figure 1: Spearman correlation for 1_3_5 injury weighting values
These results show that the Spearman correlation coefficient varies from 0.753 to 0.998. Although this coefficient should not be interpreted by means of its absolute value (see section 2), figure 1 indicates that this coefficient is relatively lower for the weighting
values that strongly differ from the 1_3_5 combination. For example, the weighting values 1_10_10 lead to a Spearman correlation coefficient of 0.753 while the combination 2_6_9 results in a correlation value of 0.998. This indicates that not only the subset of the most dangerous accident locations can change dramatically when using more extreme weighting values (see table 2), the internal changes in the ranking orders will also differ more with a different attitude towards the traffic safety problem. Furthermore, when calculating the Spearman correlation coefficient for the different combinations of weighting values discussed in table 2, results show that these coefficients correspond with respectively 0.790, 0.776 and 0.753 for the 1_1_1, 1_1_10 and 1_10_10 weighting combinations. These results indicate that changing the 1_3_5 weighting values to one of these weighting value combinations will approximately have an equally strong effect on the changes in the ranking orders of the 1014 accident locations.
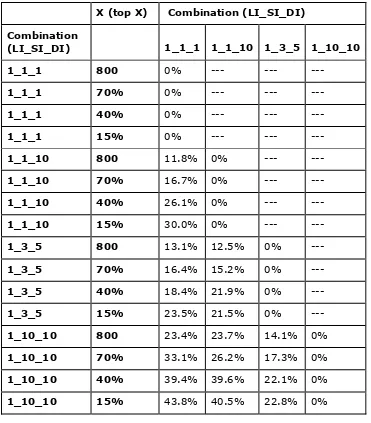
However, table 3 shows the percentage deviation values for these different weighting value combinations and for different subsets of the 1014 accident locations.
Table 3: Percentage deviation values for different subsets of the 1014 currently most dangerous accident locations using different combinations of weighting values.
X (top X) Combination (LI_SI_DI)
Combination
(LI_SI_DI) 1_1_1 1_1_10 1_3_5 1_10_10
1_1_1 800 0% --- --- ---
Results of table 3 show that the percentage deviation values of the different weighting value combinations differ greatly amongst each other. The more the weighting values deviate from each other, the greater the variability of the black spots will be. For example, when comparing the top 15% (of the 1014 most dangerous accident locations) calculated using the weighting value combination 1_10_10 and the weighting value combination 1_1_1, table 3 shows that 43.8% of the accident locations in this subset will differ from each other. When comparing this result with the results of table 2, it can be seen that this percentage deviation value is more extreme than the value related to the 1_3_5 weighting combination. This can be explained by the more ‘general’ character of the 1_3_5 weighting values, which does not differ as greatly from the other weighting value combinations.
Furthermore, the percentage deviation values for the 1_1_1 weighting value combination and the 1_10_10 weighting value combination, each related to the 1_3_5 weighting values are both approximately 20% (see table 2). However, results from table 5 show that although both weighting value combinations practically have an equal impact on the number of accident locations that will differ in the top 15%, the actual accident locations that change in this subset will not be the same.
4.2 Evaluating The Ranking Order Of All Accident Locations
In this section we will look at the consequences of changing the injury weighting values on all 23184 accident locations of Flanders. This allows exploring the sensitivity of the ranking orders of all accident locations, including the locations that are currently not considered as being very dangerous.
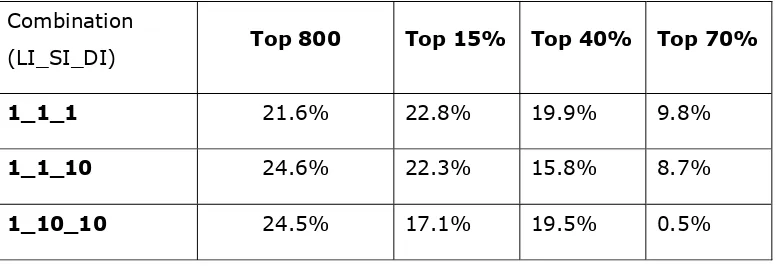
Table 4 gives an overview of the effects of changing the weighting values on the ranking order of different subsets of all accident locations. More specifically, table 4 shows the
percentage deviation values for the three combinations of weighting values representing different attitudes towards the traffic safety problem (see previous section), all related to the ranking order of the currently used 1_3_5 weighting values.
Results of table 4 show that changing the injury weighting values according to a different traffic safety policy will have a serious impact on the selection of the most dangerous accident locations. When selecting the 800 most dangerous accident locations using the different combinations of weighting values, the ‘new’ black spots will contain between 21.6% and 24.6% different accident locations compared to the 800 most dangerous accident locations selected by the 1_3_5 values. These results show that the concept of black spots is rather relative and depends strongly on the chosen traffic safety policy. Note that these figures differ from the results in table 2 for the top 800. This can be explained by the fact that the top 800, which in both tables is selected by the 1_3_5 conditions and which is used to calculate the percentage deviation values with the other weighting values, differs in the two tables. In this last analysis, we do not select the locations with a minimum of 3 accidents in the last 3 years first. Nor does the priority value need to exceed 15. This allows a more reliable comparison of the results for the top 800 since we single out the effects of changing the weighting values without including effects of additional criteria.
Table 4: Percentage deviation values for different subsets of all accident locations using different combinations of weighting values related to the currently used 1_3_5 combination
Furthermore, when considering subsets of different sizes of all the accident locations, in general the percentage deviation values will vary from 0.5% to 24.6%. Similar to the results of the previous section, these percentage deviation values are on average smaller when more accident locations are involved in the analysis. For example, when using the 1_10_10 values to determine the subset of 70% most dangerous accident locations, only 0.5% of these accident locations will differ from the results of the 1_3_5 weighting combination. As explained in the previous section, this can be a result from the inclusion of more accident locations, which allows more internal shifts without falling out of the subset. However, when comparing these results with the percentage deviation value for the 1_1_1 weighting values to identify the top 70% (9.8%), we can conclude that, although the size of the subset increases, still some significant changes can appear depending on the weighting values.
When calculating the Spearman correlation coefficients, for all accident locations these values result in respectively 0.866, 0.898 and 0.964 for the 1_1_1, 1_1_10 and 1_10_10 weighting value combinations. Accordingly with the previous section, these results indicate that changing the 1_3_5 weighting values to one of these weighting value combinations will approximately have an equally strong effect on the changes in the ranking orders of all accident locations.
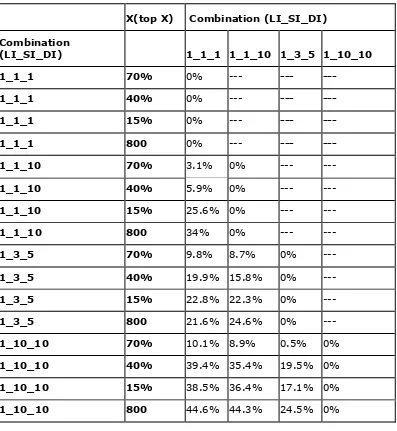
The percentage deviation values for these different weighting value combinations and for
different subsets of all accident locations are shown in table 5. This table shows that comparing the accident locations that are actually selected by the different weighting value combinations leads to some interesting results in accordance with the results of table 3. For example, when comparing the top 15% of all accident locations calculated using the weighting value combination 1_10_10 and the weighting value combination 1_1_1, table 5 shows that 38.5% of the accident locations in this subset differ from each other. When comparing this result with the results of table 4 (17.1%), again it can be seen that this percentage deviation value is more extreme than the value related to the 1_3_5 weighting combination.
Additionally, although results from table 4 show that the impact of both weighting value combinations on the number of accident locations that will differ in the top 15% does not vary strongly (respectively 22.8% and 17.1% for the 1_1_1 and 1_10_10 combination), the actual accident locations that change in this subset will not be the same.
Table 5: Percentage deviation values for different subsets of all accident locations using different combinations of weighting values.
X(top X) Combination (LI_SI_DI)
4.3 Evaluating The Ranking Order Of All Accident Locations with
min. 3 accidents between 1997-1999
In this last section we will investigate the effects of changing the injury weighting values on all accident locations of Flanders where at least 3 accidents occurred between 1997 and 1999. Note that this is currently one of the conditions (besides the priority value) for an accident location to be considered as dangerous (see introduction). Therefore, analyzing the impact of the injury weighting values on the ranking orders of these 5326 accident locations allows a more realistic exploration of the sensitivity of the ranking and selecting of dangerous accident locations when using different weighting values.
Table 6 gives an overview of the effects of changing the weighting values on the ranking order of these accident locations. More specifically, table 6 shows the percentage deviation values for different combinations of weighting values and for different subsets
of the accident locations with at least 3 accidents, all related to the ranking order of the currently used 1_3_5 weighting values.
Table 6: Percentage deviation values for different subsets of all accident locations with min. 3 accidents using different combinations of weighting values related to the currently used 1_3_5 combination
Results of table 6 show that depending on the chosen injury weighting values, selecting subsets of the most dangerous accident locations can deviate from the original location subsets from 6.9% to 22.1%. More specifically, when selecting the 800 most dangerous accident locations using the 1_10_10 weighting values, 22.1% of these accident locations will differ from the 1_3_5 selection. These results illustrate that changing the weighting values according to a chosen safety traffic policy will definitely have an impact on the selection and ranking of the most dangerous accident locations. Note that for the top 800, these results strongly coincide with the results of table 4 although in this analysis the extra criterion of minimum 3 accidents per location was used. Furthermore, analogously to the results of table 2 and table 4, the percentage deviation values are on average smaller when more accident locations are involved in the analysis.
When calculating the Spearman correlation coefficient for the different combinations of weighting values discussed in table 6, results show that these coefficients correspond with respectively 0.888, 0.911 and 0.928 for the 1_1_1, 1_1_10 and 1_10_10 weighting combinations. Analogously with results of the previous sections, these figures show that using one of the above weighting value combinations in stead of the currently used 1_3_5 injury weighting values will approximately have an equally strong impact on the ranking orders of the 5326 accident location.
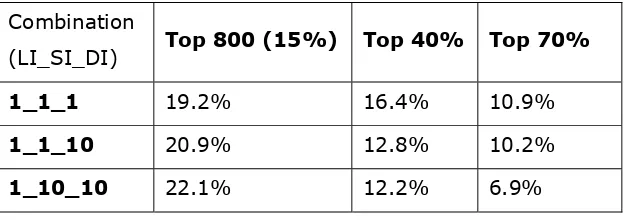
To analyze the way in which these weighting values differ amongst each other, the percentage deviation values for different subsets of the 5326 accident locations are presented in table 7. These results show that, although the Spearman correlation values for the 1_1_1, 1_1_10 and 1_10_10 weighting combinations are closely related, the choice for one of these weighting combinations will have a strong impact on the type of accident locations that are selected. For example, when selecting the 800 most dangerous accident locations, table 6 showed that for both the 1_1_1 as for the 1_10_10 weighting value combinations approximately 20% of the selected locations will differ from the locations selected with the 1_3_5 injury weighting values. However, amongst each other 40% of the 800 selected accident locations will differ. Once more, these percentage deviation values will decline when more accidents are involved in the analysis.
Table 7: Percentage deviation values for different subsets of all accident locations with min. 3 accidents using different combinations of weighting values.
X(top X) Combination (LI_SI_DI)
Combination
(LI_SI_DI) 1_1_1 1_1_10 1_3_5 1_10_10
1_1_1 70% 0% --- --- ---
1_1_1 40% 0% --- --- ---
1_1_1 800 0% --- --- ---
1_1_10 70% 1.8% 0% --- ---
1_1_10 40% 9.0% 0% --- ---
1_1_10 800 27.5% 0% --- ---
1_3_5 70% 10.9% 10.2% 0% ---
1_3_5 40% 16.4% 12.8% 0% ---
1_3_5 800 19.2% 20.9% 0% ---
1_10_10 70% 17.9% 17.1% 6.9% 0%
1_10_10 40% 26.1% 24.5% 12.2% 0%
1_10_10 800 40.0% 34.6% 22.1% 0%
5 . C
O N C L U S I O N S A N D F U R T H E R R E S E A R C HIn this paper a sensitivity analysis is performed to investigate the strengths and weaknesses of the currently used method to identify and rank black spots. This analysis shows that a change in the traffic safety policy and the reflection of this choice in the injury weighting values used to identify and rank the most dangerous accident locations will not only have an important impact on the number of accident locations that will change when selecting and ranking black spots, it will also have an important effect on the type of accident locations that are selected (e.g. locations with high traffic volumes resulting in many small accidents) and accordingly on the resulting future traffic safety decisions. Government should therefore carefully decide which priorities should be stressed in the traffic safety policy. Next, the according weighting value combination can be chosen to rank and select the most dangerous accident locations.
In future research, we will not only investigate the effect of changing the 1_3_5 weighting values, we will also take into account the number of passengers and finally we will take into account the number of passengers as well as change the 1_3_5 weighting values. In conclusion, we will estimate the reliability of the calculated ranking orders using first the historic accident count values and next a Bayesian estimation method and we will take into account the problem of underregistration.
Steunpunt Verkeersveiligheid 20 RA-2003-18
6 . R
E F E R E N C E SMinistry of Flemish Community (2001), Ontwerp-Mobiliteitsplan Vlaanderen, Brussels. http://viwc.lin.vlaanderen.be/mobiliteit, March 2003.
Mansfield, E. (1980). Statistics for Business and Economics, W.W. Norton & Company Inc., New York, USA.