ANALYSIS
Protest responses and willingness to pay: attitude toward
paying for stormwater pollution abatement
Bradley S. Jorgensen
a,*, Geoffrey J. Syme
baDepartment of Psychology,Uni6ersity of Bath,Cla6erton Down,Bath BA2 7AY, UK bAustralian Research Center for Water in Society,CSIRO Land and Water,Perth, Australia
Received 6 July 1999; received in revised form 25 October 1999; accepted 25 October 1999
Abstract
In contingent valuation (CV) surveys, there is often a proportion of individuals who are not willing to pay to obtain (avoid) an increase (decrease) in some attribute of a particular environmental public good. Some of these respondents might protest an aspect of the CV survey (e.g. payment vehicle) or the behavioral intention (i.e. willingness to pay, WTP) constituting the measure of economic value. Respondents’ attitudes toward the behavior of paying for a particular public good may contribute to the decision to pay independent of other explanatory variables, such as the price of the intervention, household income, and methodological characteristics of the CV survey. Moreover, attitude toward paying for the good may manifest in protest responses as a reaction to higher prices and methodological factors (e.g. the payment vehicle). To the extent that protest beliefs are dependent on such matters of survey design, they may be alleviated through changes in CV methodology. However, to the extent that protest beliefs are a reaction to the act of paying, methodological remedies may not be effective. CV surveys of stormwater pollution abatement were conducted in four Australian state capital cities. The surveys differed with respect to the type of pollution abatement intervention, the payment regime, the vector of prices used in the dichotomous choice question, and the institution responsible for implementing the stormwater pollution intervention. Protest beliefs were measured for all respondents irrespective of their responses to the WTP question. Results indicated that attitude toward paying underpinned protest beliefs regarding the role of government in stormwater management and individual rights to unpolluted waterways. This attitude was present in each city sample despite methodological differences between the CV surveys. Attitude toward paying explained variability in WTP, and was a larger predictor than was price. Household income was significantly associated with attitude toward paying, and this relationship was also invariant over city samples. Protest beliefs were not independent of either the WTP question or demographic factors, such as household income. Rather, these beliefs were related to WTP through attitudes toward the act of paying for stormwater pollution abatement. Censoring protest responses in the present study would bias CV samples toward
www.elsevier.com/locate/ecolecon
* Corresponding author. Tel.: +44-1225-826826; fax: +44-1225-826752. E-mail address:[email protected] (B.S. Jorgensen)
those individuals who are favorably disposed toward paying for environmental public goods and those from higher income households. © 2000 Elsevier Science B.V. All rights reserved.
Keywords:Contingent valuation; Protest responses; Willingness to pay; Attitude toward paying; Stormwater pollution; Water quality
1. Introduction
In contingent valuation (CV) surveys, there is often a proportion of individuals who are not willing to pay to obtain (avoid) an increase (de-crease) in some attribute of a particular environ-mental public good. Some of these respondents may feel that they can’t afford to pay and/or that they do not value the public good change. Re-spondents might also hold other beliefs that protest some aspect of the valuation process. These reasons for not paying may include insuffi-cient information, dissension regarding the pro-posed means of bringing about the change in the public good (e.g. the payment vehicle, pollution abatement intervention, etc.), an ethical objection to the idea of placing valued environmental ob-jects in a market context, and/or beliefs that paying for environmental quality is the responsi-bility of government rather than individual citizens.
Protest beliefs are representative of attitudes toward the valuation process (Jorgensen and Syme, 1995; Jorgensen et al., 1999). The most obvious aspect of CV is the assumption that people should pay if they value the change in the public good. Given this assumption, certain rea-sons why people won’t pay become problematic (Lindsey, 1994; Soderqvist, 1998). For example, others have noted that there is a problem with refusals to pay that are indicative of some reason not associated with a lack of value for the public good change (Halstead et al., 1992; Lindsey, 1994) and an inability to pay (Soderqvist, 1998).
In practice, the distinction between beliefs about refusing to pay for environmental public goods is not straightforward. Individuals who will not pay because of a lack of ability may also believe that the valuation process is objectionable in some manner. For example, beliefs about one’s ability to pay for stormwater pollution abatement were associated with attitudes toward paying that
reflected the fairness of the act and equity con-cerns (Jorgensen et al., 1999).
Currently, CV practitioners identify those who will not pay, scrutinize their reasons, reject those that do not fit with an economic interpretation of value, and then offer the end product as a basis for policy decisions. However, many people who do intend to pay may also not like the WTP question, or feel that they cannot really afford to pay. If respondents’ answers to the WTP question are to be censored, the criteria should be indepen-dent of the payment offered (Jorgensen and Syme, 1995).
If practitioners are to censor refusals to pay, they have to demonstrate that the practice is independent of the willingness to pay (WTP) question format, the distribution of ‘legitimate’ reasons, variables external to the valuation pro-cess (e.g. income), and the WTP response. If censoring one type of response results in a biased sample, then all claims for generalizability on the basis of representative sampling are forgone. In such cases, the aggregate WTP value only has significance for the sample from which it was generated.
When practitioners censor certain reasons for refusing to pay, assumptions are made about the meaning of those WTP responses. CV research has not embraced questions regarding the mean-ing of environmental objects and the process of valuation (Jorgensen, 1999).
2. Understanding protest beliefs as attitudes toward paying for public goods
to which aggregate values are to be generalized. Further, to the extent that attitude toward paying is associated with WTP, censorship may simply bias the sample toward individuals who are more favorably disposed toward paying for public goods.
2.1. The relationship between price,income, and attitude toward paying
In econometric analyses of CV data, WTP is often regressed on variables such as annual house-hold income, a vector of prices, and a number of variables intended to reflect individual tastes for the public good. Attitude toward paying is likely to be negatively associated with price when the latter is perceived to be beyond respondents’ WTP. Alternatively, price may be unrelated to attitude when respondents’ perceive that there is not enough information to make a decision about paying, or that the payment vehicle is inappropri-ate in some way. Here, respondents may be will-ing to pay if information deficits could be alleviated, or if a different payment vehicle were instigated.
Price and attitude toward paying may also be unrelated when additional household payments are perceived to be unfair and objectionable in principle. For example, respondents may believe that: (1) they are entitled to the public good change without having to pay an additional sum; and/or (2) some other party is responsible for paying for the change. In these instances, there would seem to be little potential to persuade respondents not to protest the CV survey since their objection is toward the act by which eco-nomic values are measured.
Income may also have a positive, linear rela-tionship with attitude. Low-income respondents may consider that it is unfair that they should have to pay given their financial constraints. In contrast, higher income respondents may also protest the act of paying if they believe that they are unfairly targeted to bear a greater proportion of the cost of intervention. Further, income might correlate with attitude as a result of potential common correlates such as demographic variables and environmental values.
2.2. The relationship between price, income,
attitude and WTP
Price may have an effect on WTP that is inde-pendent of its indirect effect via attitude. All previous applications of the dichotomous form of WTP have sought to measure the direct effect of price on WTP. This relationship is important to the validity of the responses if they are to be incorporated into efficiency analyses.
Income may also directly effect WTP. Respon-dents with relatively higher household incomes may be more willing to pay compared with those from low income households. This relationship is often sought in applications of CV utilizing the open-ended question format. In the absence of a vector of prices, the effect of income on WTP has been taken to support the validity of the WTP responses (Cummings et al., 1986). These findings are consistent with interpretations of environmen-tal quality as a normal good.
Finally, WTP responses may reflect individuals’ attitudes toward paying. Respondents who are unfavorably disposed toward paying might be less willing to pay for a public good change indepen-dent of the price offered and their level of income. A large proportion of the variability in WTP may simply be a function of whether respondents be-lieve that additional household contributions are an equitable means to achieving environmental improvements. To the extent that some respon-dents pay despite holding a negative attitude to-ward paying, the linear relationship between attitude and WTP is diminished. Similarly, re-spondents who have a positive attitude toward paying may still refuse to pay due to a number of factors (e.g. strategic reasons, financial con-straints, a lack of information, etc.).
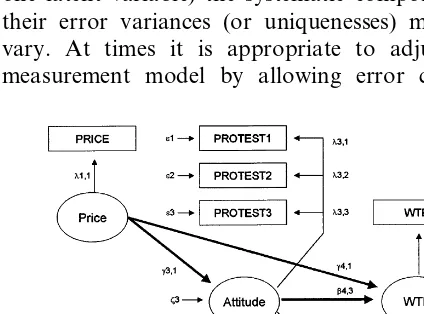
3. An empirical model of attitude toward paying and WTP
latent variable is represented by one or more observed (or manifest) variables included in the CV questionnaire. The latent variables in the model (i.e. price, income, attitude and WTP) are shown as ellipses in the diagram, and the relation-ships between these variables are designated by the thicker arrows. There are nine observed vari-ables in the model (indicated by rectangles) which are linked to one of the latent variables (repre-sented by thinner arrows in the diagram).
Structural equation modeling is a confirmatory process. The researcher specifies the form of the model to be fitted to a variance – covariance ma-trix of observed variables. An estimation proce-dure (e.g. maximum likelihood) is used to derive all of the model’s unknown parameters. When the model is over-identified (i.e. there are more known parameters compared with unknown parameters), a variety of goodness-of-fit statistics can be used to assess the statistical adequacy of the model (Bollen, 1989; Browne and Cudeck, 1993).
The attitude factor in the model is represented by the shared variance of six belief items (i.e. protests 1 – 6), but only four indicators are neces-sary for a latent variable to be over-identified. When the variability in two or more items of a particular factor is complex (measures more than one latent variable) the systematic component of their error variances (or uniquenesses) may co-vary. At times it is appropriate to adjust the measurement model by allowing error
compo-nents to covary and, therefore, incorporate the effect of residual factors that would otherwise be unaccounted.
All other latent variables in the model are under-identified since each has only one indicator. The indicator for price is represented without measurement error, since the practitioner, as part of the CV design, fixes its values. In this respect, the latent variable corresponds exactly with its observed indicator (as is the case in regression analysis). The income and WTP observed vari-ables, on the other hand, are assumed to contain measurement error that can be fixed to values derived from the following formula:
di=fi(1−pi) (1)
where fi is the item variance and ri is the item reliability. In standard econometric analyses of CV data, measurement error is assumed to be absent despite contrary evidence (Jorgensen et al., 1998). One benefit of structural equation models over regression models is their capacity to deal with measurement error (Goldberger, 1972). By fixing the error variances of the single indicators to more realistic and less arbitrary values than zero, the model can be empirically identified and subject to a goodness-of-fit test (e.g. a x2
-test). The overall fit of a model is based on the dis-crepancy between the observed variance – covari-ance matrix and the varicovari-ance – covaricovari-ance matrix implied by the model.
Finally, in structural equation modeling ordinal measures such as WTP may be used to reflect continuous latent dependent variables. However, when the dependent variable is conceptually cate-gorical (e.g. when it demarcates individuals who take an action and those who do not), latent class analysis is more appropriate (Marcoulides, 1998). In latent class analysis, both the observed indica-tor and the underlying latent variable are categor-ical. As others have noted (Cameron and James, 1987), WTP is a continuous latent variable that may be measured on an observed scale having ordered categories. As a behavioral intention, rather than actual behavior, responses to dichoto-mous choice WTP measures can be conceived as representing points on a latent continuum of WTP.
3.1. Hypotheses
The preceding discussion highlighted the impor-tance of understanding the meaning of protest responses. An empirical model was presented as a means for testing the following hypotheses: (1) protest beliefs are significantly associated with attitude toward paying; (2) attitude toward paying is significantly associated with income and price; and (3) attitude toward paying is significantly associated with WTP. These hypotheses corre-spond to the following model parameters:
1. l3,1l3,2…l3,6 not equal to 0. 2. g1,3g2,3 not equal to 0. 3. b3,4 not equal to 0.
The structural equation model described earlier can be compared across samples in order to test a fourth hypothesis: Attitude toward paying and its relationships with other variables in the model are invariant with respect to variability in a range of methodological factors. These methodological factors might include the type of payment vehicle, the frequency of payments that households are required to pay, and the type of pollution abate-ment intervention proposed.
If attitude toward paying is simply a reaction to mutable methodological conditions rather than to the act of paying, it should vary in the presence of different payment vehicles, payment regimes, in-terventions, etc. The same attitude toward paying that is expressed in reaction to one type of CV survey would not manifest in the same form when different methodological characteristics apply. If attitude toward paying is dependent upon such methodological characteristics then variations in them should be associated with differences in attitude over samples.
Alternatively, attitude toward paying might manifest in exactly the same form if respondents in different samples perceive similar issues to be at stake where paying for stormwater pollution abatement interventions are concerned. In other words, the attitude would not be invariant over different methodological conditions so that changes in these conditions may not solve the presence of protest beliefs.
The process of invariance testing begins with a test of ‘configural invariance’ (Steenkamp and
Baumgartner, 1998). This test concerns the extent to which the model takes the same form in each group (i.e. has the same pattern of zero and non-zero factor loadings). If configural invariance is established, the model’s ‘metric invariance’ can be ascertained by placing equality constraints on the factor loadings (contained in the Lmatrix) in each group. This step is determined on the basis of a x2 difference test between models with and without the equality constraints. If this test is not significant then it supports the conclusion that the attitude is comparable in each sample. In other words, the attitude is represented in each group by an equivalent set of indicators associated with loadings that are not significantly different in either their magnitudes or their variances. Next, by placing equality constraints on the relation-ships between the exogenous and endogenous variables in the model (contained in the G and B matrices), conclusions can be drawn about the invariance of the structural relationships in the presence of methodological variations.1
4. Method
Two hundred and ten households were selected within an urban watershed located in one of four Australian state capital cities (i.e. Brisbane, Syd-ney, Melbourne, and Perth). All four watersheds were relatively small (:1500 households) and
residential. The watersheds were part of a larger longitudinal stormwater management study, con-ducted by the Australian Research Center for Water in Society at the Commonwealth Scientific and Industrial Research Organization (Nancar-row et al., 1995, 1998).
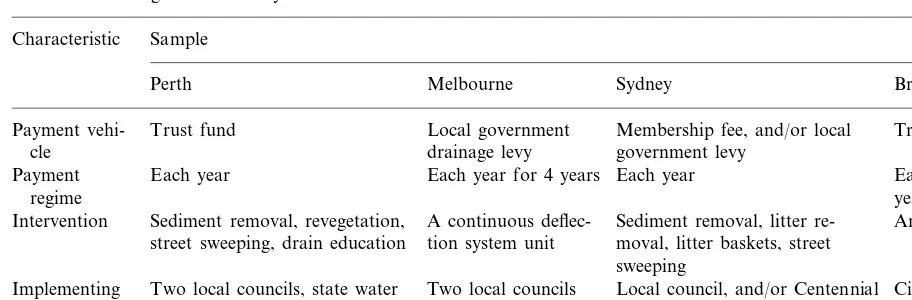
Table 1
Differences among the CV surveys
Sample Characteristic
Melbourne Sydney
Perth Brisbane
Trust fund Local government
Payment vehi- Membership fee, and/or local Trust fund
drainage levy
cle government levy
Payment Each year Each year for 4 years Each year Each year for 4
regime years
Sediment removal, litter re-A continuous
deflec-Sediment removal, revegetation,
Intervention Artificial wetland
tion system unit
street sweeping, drain education moval, litter baskets, street sweeping
Two local councils, state water Two local councils City council
Implementing Local council, and/or Centennial
institution agency, quasi-government Park and Moore Park Trust agency
CV interview schedules, response cards, and information booklets were developed in cooperation with state water agencies to depict stormwater pollution abatement interventions for each watershed. In each watershed, the pro-posed intervention aimed to improve the efficiency of the existing pollution abatement sys-tem.
The interventions relevant to each water-shed are summarized below. Some of the most salient differences among the four CV sur-veys are also summarized in Table 1. More detailed information regarding the study methods and materials is given in Nancarrow et al. (1998).
4.1. The Litoria watershed inter6ention in Perth
A works program was proposed that would: (1) clean out the existing sediment ponds more fre-quently; (2) plant more reeds and trees around the sediment ponds; (3) plant 20 trees and shrubs around the main drain leading to the receiving waters; (4) double the existing frequency of street sweeping; and (5) increase drain eduction from one to four times a year. Photographs of the existing ponds, street sweeping operation, and main drain were included in the information booklet. Respondents were told that they would be required to make contributions to a trust fund each year in order for the works program to proceed.
4.2. The Ricketts Point watershed inter6ention in
Melbourne
The intervention sought to improve the removal of stormwater pollutants such as litter and fine sediments by installing and maintaining an in-line continuous deflective separation (CDS) unit in the main underground drain before it discharged to the receiving waters. The operation and proposed location of the CDS unit were detailed in the information booklet. For example, respondents were informed that the CDS unit could remove 100% of the litter and coarse sediment in the stormwater, as well as most of the existing levels of fine sediment. The money for the intervention was to be collected through the introduction of a local government drainage levy, to be paid each year for 4 years by all ratepayers in the watershed.
4.3. The Queens Park watershed inter6ention in
Sydney
street sweeping. Within Centennial Park, the in-tervention included an increase in the frequency of litter collection in the park grounds and from the litter traps in the drain leading to the sediment pond. The introduction of a pond sediment re-moval strategy was also proposed to take place every 5 years. Respondents were given the oppor-tunity to make an annual contribution to a local government levy and/or to membership in the Centennial Park and Moore Park Trust’s ‘Friends of Centennial Park’ Group.
4.4. The Wa6ell Heights watershed inter6ention in
Brisbane
The Brisbane intervention proposed an artificial wetland be built in parkland at the bottom of the watershed. Respondents were told that the wet-land would require an area of 2 ha (or 2% of the watershed). A diagram and photographs were in-cluded in the information booklet to show respon-dents how the wetland achieved cleaner stormwater, and what it would look like when completed. Respondents were informed that up to 80% of sediment and 60% of phosphorus could be removed from the stormwater by the artificial wetland. For the wetland program to proceed, respondents were told that they would be required to make contributions to a trust fund each year for 4 years.
4.5. Materials
All necessary information regarding the stormwater interventions was included in a book-let that was read aloud to respondents by trained and experienced interviewers. Full color informa-tion booklets were also provided to respondents so that they could monitor and clarify informa-tion provided by the interviewers. Each booklet began with a map identifying the watershed in which the respondent resided. Stormwater was defined as water that runs off homes, buildings, car parks, roads and building sites. Respondents were informed about the existing local disposal system with the assistance of photographs show-ing the local main drain, drainage pits, and receiv-ing waters. Next, the sources of stormwater
pollution and their effects on humans and the receiving waters were explained. In addition, ex-isting stormwater abatement strategies in the re-spondents’ watersheds were proposed (e.g. their frequency and effectiveness). Finally, the relevant intervention was presented to respondents as a means of improving the quality of the stormwater emanating from their watersheds. This section of the booklet showed how the intervention repre-sented an improvement to the existing strategy by pointing to pollution reductions arising from (1) increases in the frequency of existing services (e.g. street sweeping); (2) increases in the number of existing abatement mechanisms (e.g. litter bas-kets); and/or (3) the introduction of more effective pollution abatement technology (e.g. artificial wetland). In addition to the information booklets, respondents were presented with a card summa-rizing the existing and proposed pollution abate-ment strategies and asked to consider factors such as current expenses and household income.
The prices offered to equal proportions within the samples were 10, 30, 70, 160, and 350 for Perth, Melbourne and Sydney. The prices associ-ated with the intervention in Brisbane were 50, 100, 200, 400, and $700. These prices were se-lected on the basis of an earlier large sample study utilizing both open-ended and dichotomous choice elicitation formats for WTP for stormwater pollution abatement (Nancarrow et al., 1995). Small scale, face-to-face pretests of the interview schedule and materials were also conducted.
paying, their error variances may covary due to the shared influence of attitude toward government.
The six belief statements were developed on the basis of previous stormwater management re-search conducted with participants from the same populations (Nancarrow et al., 1995; Jorgensen et al., 1999) as well as research using samples from other populations (Lindsey, 1994). Agreement or disagreement with each statement was recorded on 5-point Likert scales. Interviewers were in-structed to vary the order of presentation for each statement, so as to control for response effects.
Toward the end of the interview, respondents were asked to provide information about their annual gross household income, age, and level of education. Income was measured with ten cate-gories that were consistent with those used in the Australian census. These categories ranged from ‘B$5000’ to ‘\$80 001’. Missing values on the
income question amounted to 19 respondents in Perth, 59 in Melbourne, 28 in Sydney, and 31 in Brisbane. Missing data imputation was under-taken in Prelis 2 (Joreskog and Sorbom, 1996a) using responses to the age and education ques-tions as variables with matching response pat-terns. Imputation substitutes real values for missing values on the basis of cases that have matching ages and education levels. In order to enhance precision in the estimation pro-cedure, only values predicted with a variance ratio of B0.5 were imputed. The variance ratio is
calculated by dividing the variance of the income values of the matching cases, by the total variance of the complete data on income. Following this procedure, 9, 30, 8, and 14 missing values on income were imputed in the Perth, Melbourne, Sydney, and Brisbane samples, re-spectively.
The total samples sizes in each group were 177 (Perth), 171 (Melbourne), 164 (Sydney), and 174 (Brisbane) after accounting for ‘don’t know’ responses on the WTP question and missing values. Twenty-three respondents in Perth, 7 in Melbourne, 13 in Sydney, and 22 in Brisbane did not know whether they would be WTP for additional stormwater pollution abate-ment.
Table 2
Description of attitude toward paying items
Item label Item description
Protest 1 It is unfair to ask me to pay more money for stormwater pollution controls Protest 2 The government should use existing
rev-enue to pay for stormwater pollution con-trols
Protest 3 We would be able to afford better protec-tion of (receiving waters) already if the government did not waste so much money It is my right to have cleaner stormwater Protest 4
and not something I should have to pay extra for
Protest 5 If the money was collected, I don’t really believe that it would be spent on making the stormwater cleaner
Protest 6 I pay enough already in government and council charges for cleaner stormwater
Table 3
Descriptive statistics of variables in the modela
Variable Sample
Perth Melbourne Sydney Brisbane
Price 1.24 1.22 1.17 2.89
(2.36)
Protest 1 2.94 3.43
(1.39)
(0.97) (1.08) (1.13) (1.04) 4.44 Protest 3 4.60 3.73 4.03
(0.87) (1.28) (1.23) (1.03) Protest 4 3.47 2.97 3.07 3.59 (1.20) (1.35) (1.35) (1.36)
3.38 3.57
Protest 5 3.48 4.06
(1.04) (1.17) (1.25) (1.12) 3.98
Protest 6 3.57 3.48 4.06
(1.04) (1.17) (1.25) (1.12)
1.55 1.75 1.65
WTPb 1.50
(0.50) (0.43) (0.48) (0.50)
aS.D. in parentheses.
5. Results
The means and S.D. for all variables in the analysis are presented in Table 3. Note that price has been scaled by a factor of 0.01 to make it more consistent with the scales of the other vari-ables in the analysis. Large differences in scales among variables can produce operational prob-lems in Prelis 2 (Joreskog and Sorbom, 1996a) such that the software adjusts the scaling of vari-ables automatically.
From Table 3, it is evident that the mean level of agreement with the belief statements were higher in the two samples having the lowest mean household income. The mean WTP responses were also lower in these samples, despite the equivalent price vectors used in the Perth, Mel-bourne and Sydney CV surveys. Across samples, highest agreement occurred for Protest 2 (i.e. ‘the government should use existing revenue to pay for stormwater pollution controls’) and Protest 3 (i.e. ‘We would be able to afford better protection (of receiving waters) already if the government did not waste so much money’).
Variance – covariance matrices were computed for each watershed sample, together with their asymptotic variances – covariances. These matrices were calculated with bootstrapping so as to ob-tain the best estimates given the relatively small sample sizes (Joreskog and Sorbom, 1996a). The inclusion of the asymptotic variances – covariances allowed the model parameters to be estimated, without an assumption of multivariate normality. This method enabled the calculation of x2 (Sa-torra and Bentler, 1988) and S.E. (Yuan and Bentler, 1997) corrected for non-normality.
The model was estimated in each group using Lisrel 8.20 (Joreskog and Sorbom, 1996b) prior to tests of invariance across samples. If a model fails to demonstrate an acceptable approximation to the data in each group, then invariance tests would be unwarranted (Byrne et al., 1989).
In all four samples, the error variances for Protest 2 and 3 were allowed to covary to test for the presence of a residual attitude toward govern-ment. Moreover, the error variances of the single indicator variables were fixed to appropriate val-ues based on the item variances and reliabilities.
WTP was assumed to have a reliability of 0.70 based on published data (Mitchell and Carson, 1989; Jorgensen et al., 1998). Dichotomous choice WTP reliability studies have reported test – retest coefficients ranging from 0.30 (Stevens et al., 1994) to 0.75 (Heberlein, 1986). Whitehead et al. (1995), using the equivalent forms method and assuming parallel measures, reported a reliability coefficient of 0.92 for dichotomous choice WTP. If only congeneric measures are assumed for their data (a more reasonable assumption in their case), the reliability coefficient was approximately 0.85 since a measure cannot correlate with another variable more than the square root of its reliabil-ity (Carmines and Zeller, 1979).
The reliability of the income measure was as-sumed to be 0.80 on the basis of previous research (Withey, 1954; Stein et al., 1993). Importantly, the value at which the error variance is fixed does not affect a model’sx2statistic, but does influence the variances and error variances of the relevant la-tent variables. In general, assumptions of higher reliability in endogenous variables (e.g. the perfect reliability assumed in regression analysis) produce larger disturbance terms within latent variable equations. This is because higher indicator reli-ability suggests that more of the endogenous la-tent variable’s variance is explicable by the exogenous latent variables.
The overall fit of the model in each sample was satisfactory (Table 4). The Satorra – Bentler scaled x2 (SB
x2) was associated with a probability level
\0.05 in all samples. The goodness-of-fit index
(GFI) (Tanaka & Huba, 1984) which is based on the SBx2statistic, had values in excess of the 0.90 criterion proposed by Browne and Cudeck (1993). The comparative fit index (CFI) (Bentler, 1990), like the GFI, can range between 0 and 1, with higher values associated with better fit. The CFI indicates the extent to which the model fits better than a baseline model in which all latent variables are orthogonal. The baseline model had 36 de-grees of freedom and x2 values, ranging from 286.10 (Perth) to 394.56 (Melbourne).
Table 4
Model goodness-of-fit within samples
Sample Fit statistic
Melbourne Sydney
Perth Brisbane
SBx2(df)a 33.25 (24) 28.90 (24) 27.32 (24) 22.05 (24)
0.96
GFI 0.96 0.96 0.97
0.98 0.98
0.95 1.00
CFI
0.05
RMSEA 0.03 0.03 0.00
0.00, 0.08
90% CI RMSEA 0.00, 0.07 0.00, 0.07 0.00, 0.06
0.04 0.05
0.05 0.04
SRMR
aAllx2 statistics are not significant atPB0.05.
error of approximation in the population as well as the model degrees of freedom. A 90 confidence interval can be calculated for the RMSEA so as to determine the precision of the statistic. Browne and Cudeck (1993) contended that point estimates
B0.08 represent reasonable errors of
approxima-tion in the populaapproxima-tion. The RMSEA estimates in Table 4 indicate that even the upper bounds of the confidence intervals are not \0.08 in each
sample.
Finally, the standardized root mean-square residuals (SRMR) also indicated acceptable levels of fit in each sample. The SRMS is the average standardized fitted residual and indicates the dis-crepancy between the sample variance – covariance matrix and the fitted matrix. In each sample, the SRMR was below the criterion of 0.08 proposed by Hu and Bentler (1995).
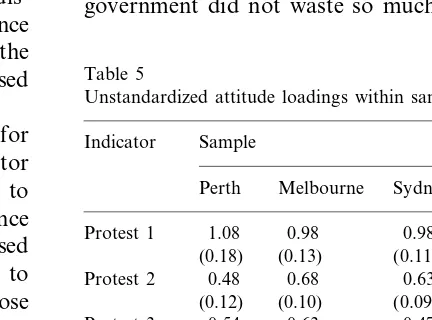
The factor loadings and standard errors for attitude are given in Table 5. The single indicator loadings are not shown since they were fixed to unity and, therefore, not subject to significance tests. When a variance covariance matrix is used in structural equation modeling, it is necessary to fix the scale of the latent variables for the purpose of identification (Anderson and Gerbing, 1988). Setting one of the factor loadings (lij) of a latent
variable to unity does this. The scale of the latent variable is then fixed to equal the scale of the reference indicator.
Protest 6 was chosen as the reference indictor for the attitude factor, so its value was also equal to one in each sample. The parameter estimates, shown in the table, indicate little variation over
samples, and all were significantly different to zero at PB0.001. In all samples, attitude toward
paying was best reflected in responses to the belief statements Protest 4 (i.e. ‘It is my right to have cleaner stormwater and not something I should have to pay extra for’) and Protest 1 (i.e. It is unfair to ask me to pay more money for stormwa-ter pollution controls’). The items having the smallest relationship with attitude were Protest 2 (i.e. ‘The government should use existing revenue to pay for stormwater pollution controls’) and Protest 3 (i.e. ‘We would be able to afford better protection (of receiving waters) already, if the government did not waste so much money’).
Table 5
Unstandardized attitude loadings within samplesa
Sample Indicator
Melbourne Sydney Brisbane Perth
1.08
Protest 1 0.98 0.98 1.25
(0.11)
(0.13) (0.15)
(0.18) 0.48 0.68
Protest 2 0.63 0.72
(0.09) (0.12) (0.12) (0.10)
0.54 0.63
Protest 3 0.47 0.49
(0.12) (0.12) (0.11) (0.12) 1.27 1.14
Protest 4 1.06 1.18
(0.16) (0.11) (0.10) (0.13) 1.01
Protest 5 0.84 0.90 0.98
(0.16) (0.10) (0.11) (0.13) Protest 6b 1.00 1.00 1.00 1.00
aAll coefficients are significantly different to zero at PB 0.001.
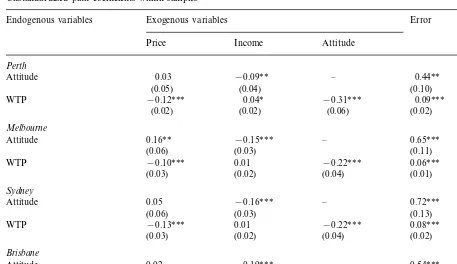
Table 6
Unstandardized path coefficients within samples
Error
Exogenous variables R2
Endogenous variables
Price Income Attitude
Perth
−0.09** – 0.44** 0.07
Attitude 0.03
(0.04)
(0.05) (0.10)
0.04* −0.31*** 0.09***
WTP −0.12*** 0.47
(0.02) (0.06) (0.02)
(0.02) Melbourne
−0.15***
Attitude 0.16** – 0.65*** 0.20
(0.03)
(0.06) (0.11)
−0.10***
WTP 0.01 −0.22*** 0.06*** 0.53
(0.02) (0.04) (0.01)
(0.03) Sydney
−0.16*** –
0.05 0.72***
Attitude 0.20
(0.06) (0.03) (0.13)
0.01 −0.22***
−0.13*** 0.08***
WTP 0.47
(0.02) (0.04) (0.02)
(0.03) Brisbane
−0.19***
Attitude 0.02 – 0.54*** 0.21
(0.03) (0.04) (0.12)
0.01 −0.29***
−0.03* 0.11***
WTP 0.38
(0.02)
(0.01) (0.05) (0.02)
*PB0.05; **PB0.01; ***PB0.001.
There was a significant covariance between the uniquenesses of Protest 2 and 3 in the Perth (o2,3=0.19, PB0.001) and Sydney (o2,3=0.25,
PB0.01) samples. These items seem to measure
both attitude toward paying and a smaller atti-tude toward government factor. The error covari-ance was not significant in either the Brisbane or Melbourne samples, suggesting that attitudes to-ward government efficiency and toto-ward paying for stormwater pollution were statistically indis-tinguishable in these groups.
Estimates for parameters in the structural com-ponent of the model are shown in Table 6. In each sample, price and attitude were negatively associated with WTP, and the path from income to attitude was also negative and significantly different to 0. In the Melbourne sample only, attitude increased with price, suggesting that a small proportion of the protest variability in this group was a function of the magnitude of the prices associated with the intervention.
Income had a positive direct effect on WTP in the Perth group only. However, this effect was marginally significant at 0.05 (t=2.09). When the model was re-estimated in Perth, after setting this path to 0, the increase in the x2 was not signifi-cantly different to the model that included the path. The x2
difference test for the two models was equal to 2.05 with 1 degree of freedom and was less than the critical value of 3.84 at the 5% level of significance. Since the path between In-come and WTP (g4,2 in Fig. 1) was not robust in any of the samples, it was removed from the model.
and income observed variables. An assumption of higher (lower) reliability would result in smaller (larger) coefficients of determination. For exam-ple, when the reliability of WTP was assumed to be perfect (as is the case in regression analysis) the coefficients of determination ranged from 0.26 (Brisbane) to 0.37 (Melbourne).
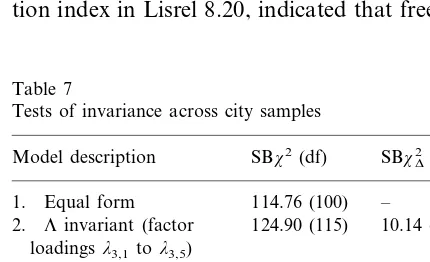
The model was compared across samples in order to assess the extent to which attitude to-ward paying and its relationship with WTP was invariant with respect to methodological differ-ences in the stormwater CV surveys. The results of the various tests of each matrix of parameters comprising the structural equation model are pre-sented in Table 7.
The comparisons across samples began with a test of equal form (or configural invariance) in which only the reference indicators of the factors were held invariant over samples. Thex2value for Model 1 served as a baseline for comparison with Model 2 in which all the loadings of the factors were held invariant over groups. Thex2difference between Model 1 and 2 was less than the critical value of 11.07. This indicated that setting the attitude factor loadings to be equal across the samples (i.e. metric invariance) did not produce a significant decrease in fit.
Next, the error variances of the attitude items were held invariant over samples (Model 3 in Table 7). The resultingx2was significantly larger than that associated with model 2. The modifica-tion index in Lisrel 8.20, indicated that freeing the
error variance of Protest 3 (o3) would produce a better model fit. Model 4 was the same as Model 3, except thato3was estimated in each group. The difference in the x2 for Models 2 and 4 was not statistically significant.
With subsequent tests of invariance, only the relationship between price and WTP (g4,1) was significantly different between samples. This can be seen in Table 8 showing the unstandardized coefficients for the structural parameters in each group. In addition to the nonsignificant x2 for this model (Model 7), other measures of overall fit were also satisfactory (GFI=0.96, CFI=0.99, RMSEA=0.01, SRMR=0.06). Thus, despite methodological variations in the CV surveys, the same attitude was present in all samples and had an equivalent relationship with WTP in all four cases.
It is possible to scale the latent variables so that a weighted average of their covariance matrix is a correlation matrix. This is different from stan-dardizing within groups where the covariance ma-trix of the latent variables is rescaled to a correlation matrix for each group. When a weighted average of the four sample covariance matrices is scaled to a correlation matrix, the metric invariance of the unstandardized solution holds for the standardized solution, such that a scale common to all groups is retained (Joreskog and Sorbom, 1996b). By scaling the coefficients in Model 7 to a standardized metric common across groups, all parameters could be compared be-tween and within groups.
The parameter estimates of the standardized common metric solution for the final model (Model 7) are given in parentheses in Table 8. The largest predictor of WTP was attitude toward paying. This variable had a larger effect on WTP in each sample than did price. However, the price associated with the interventions was a relatively strong predictor of WTP in all samples, with the exception of the Brisbane group. WTP in the Brisbane sample was much more a function of whether respondents felt favorably disposed toward paying for stormwater pollution abate-ment.
Table 7
Tests of invariance across city samples
SBx2
D(df)
SBx2(df) Model description
1. Equal form 114.76 (100) – 124.90 (115) 10.14 (5) 2. Linvariant (factor
loadingsl3,1tol3,5)
3. Uinvariant (error vari- 156.12 (133) 31.22 (18)* ances)
5.59 (15) 4. o3free (protest 3) 130.49 (130)
5. B invariant (path B4,3) 134.19 (133) 3.7 (3) 6. Ginvariant (pathsg3,1 154.88 (142) 20.69 (9)*
g3,2g4,1g4,2)
Table 8
Unstandardized and common metric path coefficients between samplesa
Error
Exogenous variables R2
Endogenous variables
Price Income Attitude
Perth
−0.15*** – 0.46*** 0.15
Attitude 0.05*
(−0.40)
(0.10) (0.66)
−0.12***
WTP – −0.26*** 0.10*** 0.39
(−0.56) (0.64) (−0.47)
Melbourne
−0.15*** –
0.05* 0.61***
Attitude 0.18
(−0.40) (0.87)
(0.01)
−0.26***
−0.10*** 0.06***
WTP 0.54
(−0.40) (−0.56) (0.38)
Sydney
−0.15*** – 0.64***
Attitude 0.05* 0.20
(−0.40)
(0.10) (0.91)
– −0.26*** 0.08***
WTP −0.12*** 0.50
(−0.56) (0.5.) (−0.50)
Brisbane
−0.15*** –
0.05* 0.62***
Attitude 0.15
(−0.40) (0.88)
(0.10)
– −0.26***
−0.03* 0.11***
WTP 0.35
(−0.56) (0.70) (−0.12)
aCommon metric coefficients are given in parentheses. *PB0.05. **PB0.01. ***PB0.001.
6. Discussion
The results showed that respondents to WTP questions who refused to pay because they ob-jected to the act itself held a negative attitude toward paying for stormwater pollution abate-ment. For example, those who refused to pay because they believed that they were entitled to clean waterways also believed that there was too much wasteful government spending. This is con-sistent with previous work contending that protest beliefs held by individuals refusing to pay were not independent of one another, but are expres-sions of attitudes (Jorgensen et al., 1999). CV practitioners cannot defend censoring one type of protest belief and not another type when both might be representative of the same underlying attitude.
Dichotomous choice WTP was not independent of attitude toward paying for public goods. Rather, in all watershed samples the attitude was a stronger predictor of WTP than was either the price of the intervention or gross annual house-hold income. Respondents’ WTP choices were influenced to a greater extent by whether they supported paying more for pollution abatement than by the financial cost of the intervention. By censoring protest beliefs related to attitude toward paying, practitioners can manipulate their samples to over-represent individuals who support the ap-plication of CV to environmental problems. If a sufficient proportion of people do not view CV and utilitarian approaches to environmental issues as appropriate (Spash, 1997), its application may be limited.
price. A larger proportion of the variability in attitude was explained by variation in household income than by variation in the price of the intervention. Respondents from lower income households held more negative attitudes toward paying, while individuals asked to pay relatively higher prices were (marginally) more likely to express a negative attitude toward paying. This latter finding was relatively weak and may prove to be sample specific. Nevertheless, by deleting protest beliefs from their samples, CV practi-tioners run the risk of biasing their samples to-ward higher income households.
Attitude toward paying was shown to be insen-sitive to methodological variations in the CV sur-veys. Despite variations in stormwater pollution interventions, payment vehicles, payment regimes, and institutional participants, the same attitude was present. To the extent that protest beliefs represent negative attitudes toward paying, they are likely to occur in CV surveys whenever addi-tional household payments are the only means by which individuals can express value for environ-mental public good improvements.
Irrespective of the invariance of attitude toward paying apparent from the preceding analysis, methodological remedies to the frequency of protest beliefs might be difficult to enact in some circumstances. Individuals are generally not in-formed of the costs of the proposed public good change or how much they are already paying for existing levels of service.2
Altering the payment vehicle may also prove difficult when policy con-straints support few alternatives, and when partic-ular social groups favor different payment options.
Future research should seek to ascertain the generality of attitude toward paying for different public goods. One methodological problem for this and all previous studies of the protest issue is that these questions were asked after the CV.
There may be therefore, demand characteristics for social acceptability and cognitive consistency. This did not seem to be a large issue in this study as the means for the protest responses were not extreme for non-payers (Nancarrow et al., 1998). The only way to avoid this problem completely would be to establish the protest characteristics of the problem separately.
Different public goods may evoke protest be-liefs that, while expressions of attitude toward paying, are not the same as those reported here. In other contexts, attitude toward paying may be expressed in beliefs regarding the rights of endan-gered species, and/or that polluters or users of the public good should pay. Protest beliefs associated with one type of good may be completely absent in the case of a second good, despite the fact that both reflect a negative attitude toward paying for the specific goods in question.
In conclusion, WTP as a behavioral intention cannot be interpreted as the value of an environ-mental intervention without establishing what it is that individuals mean by their responses to the valuation question. While WTP might reflect the value of an attitude object, it may also reflect the value of the measurement process itself. This cir-cumstance is not likely to be solved by simply deleting data that is inconsistent with normative economic models. Such a practice actually pro-motes suspicion regarding the validity of the CV method. While protest beliefs are unproblematic from the standpoint of attitude theory, the frame-work requires a change in the practitioner’s inter-pretation of an individual’s refusal to pay for environmental public goods.
Acknowledgements
The authors acknowledge funding support from the Urban Water Research Association of Aus-tralia (UWRAA) and the commonwealth scien-tific and industrial research organization (CSIRO) multidivisional program, urban water systems re-search program. The authors thank Frances Casella, Mary Kelly, Blair Nancarrow, Ronnie Oborn, and a number of anonymous reviewers for their assistance.
References
Anderson, S.E., Gerbing, D.W., 1988. Structural equation modeling in practice: a review and recommended two-step approach. Psychol. Bull. 103, 411 – 423.
Bentler, P.M., 1990. Comparative fit indexes in structural models. Psychol. Bull. 107, 238 – 246.
Bohara, A.K., McKee, M., Berrens, R.P., Jenkins-Smith, H., Silva, C.L., Brookshire, D.S., 1998. Effects of total cost and group-size information on willingness to pay responses: open ended versus. dichotomous choice. J. Environ. Econ. Man-agt. 35, 142 – 163.
Bollen, K.A., 1989. Structural equations with latent variables. Wiley, New York.
Browne, M.W., Cudeck, R., 1993. Alternative ways of assessing model fit. In: Bollen, K.A., Long, J.S. (Eds.), Testing Structural Equation Models. Sage, London.
Byrne, B.M., 1989. A Primer of LISREL: Basic Applications and Programming for Confirmatory Factor Analytic Mod-els. Springer-Verlag, New York.
Byrne, B.M., Shavelson, R.J., Muthen, B., 1989. Testing for equivalence of factor covariance and mean structures: the issue of partial measurement invariance. Psychol. Bull. 105, 456 – 466.
Cameron, T.A., James, M.D., 1987. Efficient estimation meth-ods for use with ‘close-ended’ contingent valuation survey data. Rev. Econ. Stat. 69, 269 – 276.
Carmines, E.G., Zeller, R.A., 1979. Reliability and Validity Assessment. Sage, California.
Cummings, R.G., Brookshire, D.S., Schulze, W.D., 1986. Valu-ing environmental goods: a state of the arts assessment of the contingent valuation method. Rowman and Allanheld, New Jersey.
Goldberger, A.S., 1972. Structural equation methods in the social sciences. Econometrica 40, 979 – 1001.
Halstead, J.M., Luloff, A.E., Stevens, T.H., 1992. Protest bidders in contingent valuation. Northeast. J. Agric. Re-source Econ. 21, 160 – 169.
Heberlein, T.A., 1986. Measuring Resource Values: The Reli-ability and Validity of Dichotomous Contingent Valuation Measures. Paper presented at the American Sociological Association Meeting, New York.
Hoyle, R., 1995. Structural Equation Modeling: Concepts, Issues, and Applications. Sage, California.
Hu, Li Tzu, Bentler, P.M., 1995. Evaluating model fit. In: Hoyle, R.H. (Ed.), Structural Equation Modeling: Concepts, Issues, and Applications. Sage, California, pp. 76 – 99.
Joreskog, K.G., Sorbom, D., 1996a. PRELIS 2: User’s Refer-ence Guide. SSI, IL.
Joreskog, K.G., Sorbom, D., 1996b. LISREL 8: User’s Refer-ence Guide. SSI, IL.
Jorgensen, B.S., 1999. Focus groups in the contingent valuation process: a real contribution or a missed opportunity? J. Econ. Psychol. 20, 485 – 489.
Jorgensen, B.S., Syme, G.J., 1995. Market models, protest bids, and outliers in contingent valuation. J. Water Resource Plan. Managt. 121, 400 – 401.
Jorgensen, B.S., Syme, G.J., Bishop, B.J., Nancarrow, B.E., 1999. Protest responses in contingent valuation. Environ. Resource Econ. 14, 131 – 150.
Jorgensen, B.S., Syme, G.J., Smith, L.M., Bishop, B.J., 1998. The Reliability of Contingent Values. Paper Presented at the Seventh International Symposium of Society and Resource Management. University of Missouri-Columbia, USA. Lindsey, G., 1994. Market models, protest bids, and outliers in
contingent valuation. J. Water Resource Plan. Managt. 120, 121 – 129.
Marcoulides, G.A., 1998. Modern methods for business re-search. Lawrence Erlbaum, New Jersey.
Mitchell, R.C., Carson, R.T., 1989. Using Surveys To Value Public Goods: The Contingent Valuation Method. Re-sources for the Future, Washington DC.
Nancarrow, B.E., Jorgensen, B.S., Syme, G.J., 1995. Stormwa-ter Management in Australia: Community Perceptions, Attitudes, and Knowledge. Urban Water Research Associ-ation of Australia, No. 95.
Nancarrow, B.E., Syme, G.J., Morris, P., Jorgensen, B.S., Casella, F.C., 1998. Stormwater Management in Australia: The Feasibility of Neighborhood Action and Community Information. Urban Water Research Association of Australia.
Satorra, A. Bentler, P.M., 1988. Scaling corrections for chi-square in covariance structure analysis. In: Proceedings of the Business and Economic Statistics Section of the Amer-ican Statistics Association, pp. 308 – 313.
Spash, C.L., 1997. Ethics and environmental attitudes with implications for economic valuation. J. Environ. Managt. 50, 403 – 416.
Soderqvist, T., 1998. Why give up money for the Baltic sea? Environ. Resource Econ. 12, 249 – 254.
Steenkamp, J-B.E.M., Baumgartner, H., 1998. Assessing mea-surement invariance in cross-national consumer research. J. Consumer Res. 25, 78 – 90.
Steiger, J.H., 1990. Structural model evaluation and modifica-tion: an interval estimation approach. Multivar. Behav. Res. 25, 173 – 180.
Stein, A.D., Lederman, R.I., Shea, S., 1993. The behavioral risk factor surveillance system questionnaire: its reliability in a statewide sample. Am. J. Public Health 83, 1768 – 1772. Stevens, T.H., More, T.A., Glass, R.J., 1994. Interpretation and
temporal stability of CV bids for wildlife existence: a panel study. Land Econ. 70, 355 – 363.
Tanaka, J.S., Huba, G.J., 1984. Confirmatory hierarchical factor analyses of psychological distress measures. J. Person. Social Psychol. 46, 621 – 635.
Whitehead, J.C., Blomquist, G.C., Hoban, T.J., Clifford, W.B., 1995. Assessing the validity and reliability of contingent values: A comparison of on-site users, off-site users, and non users. J. Environ. Econ. Managt. 29, 238 – 251.
Withey, S.B., 1954. Reliability of recall of income. Public Opinion Quart. 18, 187 – 204.