L
Journal of Experimental Marine Biology and Ecology, 241 (1999) 309–333
Influence of shoreline configuration on spatial variation of
meroplanktonic larvae, recruitment and diversity of benthic
subtidal communities
1 *
Philippe Archambault , Edwin Bourget
´ ´ ´
GIROQ, Departement de Biologie, Universite Laval, Quebec, Canada G1K 7P4
Received 15 November 1997; received in revised form 18 August 1998; accepted 22 August 1998
Abstract
Recruitment, abundance (percentage cover, density) and diversity (H9) of a benthic subtidal community were examined in relation to large scale (>0.15 km) shoreline configuration in the St. Lawrence Estuary (Canada). Settlement panels were moored inside and outside bays of different sizes (0.15, 1.5, 4 and 7 km aperture) and along a portion of straight (¯12 km) coast. Only the largest bay was sampled in 1993, while all bays and the straight coast were sampled in 1994. In 1993, recruitment occurred only within the bay. No recruits were observed on moored panels from zones external to the bay. Within the bay, percentage cover on panels was greater than in zones external to the bay. In 1994, percentage cover and the density of recruits were also greater within each bay than outside bays. No differences in diversity, percentage cover and density of recruits were observed among zones along the straight coast. Diversity was greater in bays than along the straight coast and was greater inside bays of 1.5 and 7 km aperture than in zones external to the bays. Overall, diversity tended to increase with increasing size of bay, the straight coast exhibiting the smallest values. In contrast, the density of recruits and percentage cover tended to decrease with increasing size of bay; smallest values were from the straight coast. Abundance of recruits was not directly related to potential larval flux; current velocity alone explained 76% of the variation in density of recruits inside and outside of bays. Our study shows a relationship between shoreline configuration, the hydrodynamics, recruitment and benthic community characteristics. The generality of this relationship can be assessed by carrying out similar large-scale studies in other systems. 1999 Elsevier Science B.V. All rights reserved.
Keywords: Shoreline configuration; Recruitment; Diversity; Invertebrate abundance; Topographical hetero-geneity; Benthic community
*Corresponding author. Tel.: 11-418-6567368; fax: 11-418-6565902; e-mail: [email protected]
1
Present address: CEICC (Centre for Research on Ecological Impacts of Coastal Cities) Marine Ecology Lab., A11 University of Sydney, NSW 2006, Australia.
1. Introduction
The patterns of abundance of benthic invertebrate species with larval development are better understood when recruitment studies are coupled with the study of hydrodynamic processes at appropriate spatial scales. Thorson (1950) first suggested that variability in recruitment was the primary regulator of adult abundance for benthic marine organisms. Although many studies have suggested that adult abundance could be influenced by larval supply (Underwood and Denley, 1984; Roughgarden et al., 1987; Underwood and Fairweather, 1989; Minchinton and Scheibling, 1991; Harvey et al., 1995; Miron et al., 1995), few have actually examined this relationship.
A series of events occurring in the plankton and the benthos, including larval transport and subsequent exploration of the substratum, could explain local patterns in larval settlement and recruitment for many benthic invertebrates. Meroplanktonic larvae can be
passively transported horizontally over long distances (.km), because advection
exceeds larval swimming capacity. Close to shore, however, transport processes may be substantially modified by shoreline configuration. Various studies have focused on the effect of small-scale physical or biotic heterogeneity of substratum on settlement (Eckman, 1983; Butman, 1987; Havenhand and Svane, 1991; Bourget et al., 1994a; Miron et al., 1996), but few studies have examined the effects of shoreline configuration
at large scales (.km) on benthic recruitment (see Ebert and Russell, 1988; Shepherd et
al., 1992).
Shoreline configuration can modify local hydrodynamics over large spatial scales (Okubo, 1973; Pingree and Maddock, 1979; Wolanski and Hamner, 1988; Black et al., 1990; Geyer and Signell, 1990; Signell and Geyer, 1991; Laval, 1995; Van der Baaren et al., 1995), creating eddies or fronts which may alter particle dispersion, including zooplankton (Alldredge and Hamner, 1980; Lobel and Robinson, 1986; Wolanski and Hamner, 1988; Signell and Geyer, 1991; Wolanski, 1993). Using a model, Okubo (1973) argued that, in a tidal estuary, shoreline irregularities, such as bays, could also trap inert particles. A long retention time would favour entrapment of zooplankton (Boicourt,
´
1982; Murdoch, 1989; Thiebaut et al., 1994), phytoplankton (Roff et al., 1979) and neutrally-buoyant material (Wolanski and Hamner, 1988; Black et al., 1990) in a given area. In addition to increasing local abundance of organisms, including planktonic larvae in the water column, an increase in larval retention may also enhance larval settlement. Larval retention in estuaries has been previously studied, but largely from a perspective of species remaining at or returning to an estuarine site (see Dame and Allen, 1996).
Recently, Archambault and Bourget (1996) showed that shoreline configuration over
large spatial scales (>1 km) did not significantly influence community characteristics
presence and size of bays directly influenced nearshore epibenthic community charac-teristics. Such large-scale studies do not lend themselves easily to replication within a given system and results therefore must be seen as exploratory. The generality of the results may, however, be assessed by similar studies in other systems (Carpenter, 1990; Hargrove and Pickering, 1992).
2. Methods
2.1. Study sites
The study was done in 1993 and 1994 along the south shore of the Lower St. Lawrence Estuary, Quebec, Canada. This area of estuarine coast was selected for its relatively linear shoreline, broken up by few bays and small differences in physico-chemical gradients (Fradette and Bourget, 1980; Ardisson and Bourget, 1992). Four bays of different size and one section of straight coast were selected for detailed study along 115 km of shore (see Archambault et al., 1998). Bays represented different sources of heterogeneity. The determination of the aperture of each bay was evaluated by considering the general orientation of the St. Lawrence Estuary between the most upstream and downstream bays and by drawing a line, using this general orientation, across the mouth of each bay. The selection of bays was based on a priori criteria: (1) length of the bay should be smaller than 50% of the width of the aperture, (2) bays should not completely drain at low tide, (3) nor receive significant freshwater flow. The bays from smallest to largest were: Grosses-Roches (GR; aperture 0.15 km), Anse des
´
Mechins (MC; 1.5 km), Anse aux Coques (AC; 4 km) and Anse du Petit Mitis (MT; 7 km). The straight coast was a 12-km section of shoreline near Sainte-Flavie (SF), within the limits set by the most downstream and upstream bays. The water volume of each bay increased with the aperture of bays. The approximated water volume at high tide of each
4 3 6 3 7 3
bay was 5.65310 m for GR, 4.3310 m for MC, 1.19310 m for AC, and
7 3
4.56310 m for MT. For the remainder of the text, size of bay will refer to the
aperture of bays. The semi-diurnal tide has a maximum amplitude of 4.1 m at ´
Grosses-Roches and Anse des Mechins, and 4.7 m at Anse aux Coques, Sainte-Flavie and Anse du Petit Mitis (Department of Fisheries and Oceans Canada, 1993 and 1994). Average tidal amplitude in the study area was 3 m.
2.2. 1993 Data collection
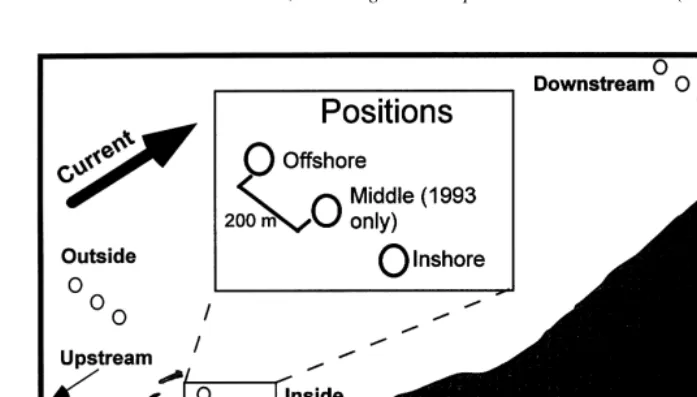
Fig. 1. Designated zones (upstream, inside, downstream and outside) and positions (inshore, middle and offshore) of sampling sites in 1993 and 1994 at Anse du Petit Mitis. The zone ‘upstream’ and the position ‘middle’ were not sampled in 1994.
2.2.1. Physicochemical measurements in 1993
Two currentmeters (Aanderaa, Model RCM 4, InterOcean) were moored, one inshore and one offshore, in each zone (Fig. 1, total of eight over the entire study area). Current
21
velocity (61 cm s ), seawater temperature (60.158C) and salinity (conductivity,60.03
21
mmho s ) were monitored 3 m below the surface at mean low tide in zones upstream,
outside and downstream of the bay (see Fig. 1). Inside the bay, currentmeters were moored 1 m from the bottom. All physical data were recorded every 30 min throughout the experiment from 2–3 June to 22–23 September 1993.
2.2.2. Recruitment experiments in 1993
At each position within each zone, twenty-five smooth grey arborite panels (123
2230.1 cm) were moored vertically on five lines, each supporting five panels, which
in the zone upstream of the bay. After retrieval, panels were placed in 4% formaldehyde in filtered seawater and subsequently all species recruited on panels were identified.
2.2.3. Zooplankton collection in 1993
Zooplankton samples were collected during daylight on seven dates (five at high tide and two at low tide) in the 1993 season (Archambault et al., 1998). The high tide samples were taken on 19 June, 3 and 20 July and 4 and 17 August. Low tide samples were collected 1 day before and 1 day after high tide sampling (3 and 18 August), respectively. The sampling dates corresponded to 1 or 2 days after the new and full moon, coinciding with maximal tidal amplitude. Samples were collected using a Bongo
set-up (two nets of 150mm and 0.25 m radius). An integrated sample of the entire water
column was taken by combining one oblique surface to bottom and one oblique bottom to surface tow in each position. A calibrated flow meter (General Oceanics, Model 2030) was attached to the mouth of each net to measure the quantity of water passing through nets, and another was attached between the two nets for comparison. All sampling was during slack water period at either high or low tide. The longest time taken for sampling the 12 positions on any date was 2 h 15 min. (i.e. 1 h before high tide and 1 h 15 after). Samples were preserved in 4% formaldehyde in filtered seawater.
2.2.4. Recruitment and meroplanktonic larvae in 1993
Recruitment on panels may be influenced not only by larval abundance but also by the larval flux near panels (Harvey et al., 1995). We evaluated the potential influence of larval flux in the vicinity of our panels on larval recruitment. The potential larval flux (PLF) is equal to the mean number of meroplanktonic larvae in the water column (NL),
multiplied by the mean current velocity (MV) during a given period of time (PLF5
NL3MV). Meroplanktonic larval abundance was measured three times during the first
observation period (7 June to 27 July) and a total of five times between 7 June and 12
23
August. Hence, using the mean abundance of meroplanktonic larvae (N.m ) in the
water column (mean between the two nets) at a given position and zone for each period and mean current velocity (MV) for the same position, zone and periods, we estimated the potential larval flux. The meroplanktonic larvae used in the calculation were those of sessile species observed settled on panels. Larval flux values were then used to examine the potential relationship with recruitment at each position and zone.
2.3. 1994 Data collection
2.3.1. Sampling and experimental sites in 1994
Four bays and a section of straight coast were divided into three zones for sampling purposes; inside, downstream and outside. No sampling was undertaken upstream of the bays in 1994. Each zone was subdivided as in 1993, but panels were moored only in the inshore and offshore positions (Fig. 1) 400 m apart, except inside the smallest bay (Grosses-Roches), with 20 m between the two positions. At zones outside and downstream, positions inshore were 400 m from the shore at high tide or from the mouth of the bay. The inside zone, inshore position was 300 m from the shore at Anse des
´
Grosses-Roches. The straight coast (Sainte-Flavie) was divided into three zones 2000 m apart, and each zone included two positions; inshore (400 m from the shore) and offshore (800 m from the shore), with no inside zone along the straight coast. Distance from the coast was determined using a GPS, as in 1993.
2.3.2. Physicochemical data in 1994
A currentmeter (Aanderaa, Model RCM 4 InterOcean) was moored at each position offshore in zones inside and outside each bay (total of eight currentmeters). Two other RCM 4 currentmeters were moored along the straight coast in the center zone at the inshore and offshore positions. Physicochemical data (current velocity, temperature and salinity) were recorded at 15 min intervals during the study. One RCM 4 currentmeter was mounted on tripods 1 m from the bottom in the zone inside each bay and at the inshore position on the straight coast. The other five currentmeters were moored 4–5 m below the surface in zone outside each bay and at the offshore position on the straight coast.
2.3.3. Recruitment experiments in 1994
At each position, one line supporting eight smooth gray arborite panels (1232230.1
cm) was moored 59–60 days (19–20 June to 17–19 August). Panels were distributed between 1.5 m and 2.7 m from the surface at mean low tide. Three lines were lost during the 1994 season two at Grosses-Roches, one in the inshore position (zone inside the bay) and one in the offshore position (zone outside the bay), the last from the offshore
´
position in the downstream zone at Anse des Mechins. The retrieval procedure and treatment were the same as in 1993.
2.3.4. Zooplankton collection in 1994
As an indication of relative abundance among zones, two series of zooplankton samples were collected at slack water as in 1993, the first from 9 to 11 July (2–3 days after a new moon) and the second from 8 to 11 August (new moon period). Three days were needed to sample the 30 positions (four bays and one straight coast). The longest sampling period began 1 h 15 min before and was completed 1 h 20 min after high tide.
2.3.5. Recruitment and meroplanktonic larvae in 1994
The PLF were estimated as in 1993. Given the 1993 current velocity results, we assumed, for the calculation of potential larval fluxes, that the mean current velocity for the zone downstream of each bay was the same as the mean current velocity in the zone outside each bay. The mean number of meroplanktonic larvae was evaluated between the two nets for each position.
2.4. Laboratory procedures in 1993 and 1994
2
On each panel, a 128 cm rectangular area was sampled. The first 4 cm front, 2 cm on both sides and 2 cm at the downstream end of the panel were excluded to avoid edge effects (Mullineaux and Butman, 1990). The rectangular area was divided into 32
square were evaluated using a stereomicroscope. On some panels, we recorded .100% cover because of secondary (biotic) space available. Organisms were identified to
species whenever possible. Some species of small (,2 cm) Ectocarpacean algae were
impossible to differentiate (Cardinal, 1964) and were grouped together as Ectocarpaceae.
Diversity was calculated using Shannon’s index (H9 5 2Sp ln p , where p is thei i
proportional abundance of the ith taxon; Magurran, 1988).
Zooplankton samples were sorted, counted and identified to species level whenever possible. A bulb pipette method was used to partition the sample (Van Guelpen et al., 1982).
2.5. Statistical treatment
2.5.1. 1993
Diversity (H9) and total percentage cover were analysed separately using a two-factor
ANOVAs (zone and position). Variances were heterogeneous and departures from normality were observed with the two variables. However, the ANOVA is robust to heteroscedasticity and small departures from normality when sample sizes are equal or nearly so (Zar, 1984; Milliken and Johnson, 1992; Underwood, 1997). When a source of variation (among zones or positions) for the diversity was significant, intergroup differences were tested using contrast. The level of signification for the contrast was
a 50.05 / df. A Tukey’s test at 0.05 / df was used to identify the differences in percentage
of cover. Recruits were only observed on panels inside the bay, except in the upstream zone (inshore position) on 12 August (seven individuals). Differences among zones were obvious and no statistical test was carried out on recruit density.
One-way ANOVAs were used to test the effect of zone on PLF for two periods of
time. Normality was achieved (Shapiro–Wilk’s test; SAS, 1988; P.0.6 for the two
periods) and homoscedasticy was confirmed graphically (Scherrer, 1984). When a factor was significant, a Tukey’s test at 0.05 / df was used to identify the differences.
2.5.2. 1994
All data sets featured one factor, zone (outside, downstream and inside) and a second factor, bay. Along the straight coast, however the three zones are not readily distinguishable because no inside zone is present. Thus, comparisons of inside zones with the two other zones are possible only where a bay is present. Thus, the standard balanced ANOVAs were modified to take into account the unequal number of factors (along the straight coast). The sums of squares were calculated to take into account the unequal numbers of factors and contrasts were carried out using the proper error terms as follows (see Addelman, 1974; Gates, 1991). Alternative ANOVA tables were constructed, supposing we had only two factors, zone and bay. We decomposed the standard sums of squares for zone, bay, and zone by bay, using orthogonal contrasts. Such decomposition are discussed in statistical texts on linear models (see Hocking, 1985). The introduction of additional factors, such as position in the analysis is relatively straightforward. The sums of squares not involving zone are those given by a standard ANOVA table. When a source of variation was significant, contrasts were carried out at
Shapiro–Wilk’s test (SAS, 1988; P.0.1 for the percentage cover and diversity). Total
number of recruits was log(x11) transformed to meet normality and homoscedasticity
assumptions. Although the transformation did not fully normalize the data, ANOVAs are robust to small variations of normality (Scherrer, 1984; Zar, 1984). Homogeneity of variances was confirmed by graphical examination (Scherrer, 1984).
PLF was analysed separately for each bay. A Kruskal–Wallis test was carried out on PLF for each bay for the treatment zone. Homogeneity of variance was confirmed graphically (Scherrer, 1984). When a source of variation (among zones) was significant, differences between means were tested using multiple comparisons test on the rank, as
proposed by Conover (1980). An a value of 0.05 was used to specify the differences.
3. Results
3.1. Physical environment in 1993
21
Current velocity averaged between 3.5 and 3.8 cm s inside Anse du Petit Mitis over
the 67 days of submersion. The mean velocities at the three other zones at the same site
21
were notably greater (Fig. 2). In the bay, velocity was ,5 cm s approximately 85%
21
of the time and was always ,25 cm s (Fig. 2). By comparison, the velocity was
21
$25 cm s at least 50% of the time in the other zones. Current velocities in zones
21
external to the bay were ,5 cm s less than 10% of the time. No significant
differences in salinity and water temperature were recorded. The maximum salinity over the entire study area was 25.8 with a minimum of 24.7. Temperature varied from 8 to
9.48C among zones during the experimental period.
3.2. Community characteristics in 1993
3.2.1. Diversity
A total of 19 sessile species were collected on panels during the 1993 season. On 27 ` July, four species of algae and two spp. of invertebrates (Balanus crenatus (Brugiere) and Mytilus edulis (L.)) were observed on the panels. After 67 days of submersion (12 August), ten sessile species were collected, four new algal species and one new species of mollusc. A green alga, Enteromorpha sp., seen on 27 July, was not observed on the panels collected on 12 August. The 26 August panels had sixteen sessile species, nine algae and seven invertebrates. The barnacle Balanus crenatus was the most abundant invertebrate species observed on panels, with a proportion of 79% of the density of individuals. No sedentary predators or grazers were observed on any of the panels.
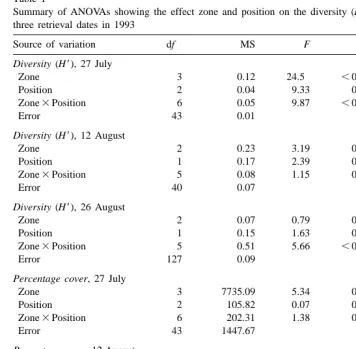
Table 1
Summary of ANOVAs showing the effect zone and position on the diversity (H9) and percentage cover for three retrieval dates in 1993
Source of variation df MS F P
Diversity (H9), 27 July
Zone 3 0.12 24.5 ,0.0001
Position 2 0.04 9.33 0.0004
Zone3Position 6 0.05 9.87 ,0.0001
Error 43 0.01
Diversity (H9), 12 August
Zone 2 0.23 3.19 0.052
Position 1 0.17 2.39 0.13
Zone3Position 5 0.08 1.15 0.353
Error 40 0.07
Diversity (H9), 26 August
Zone 2 0.07 0.79 0.458
Position 1 0.15 1.63 0.205
Zone3Position 5 0.51 5.66 ,0.0001
Error 127 0.09
Percentage cover, 27 July
Zone 3 7735.09 5.34 0.003
Position 2 105.82 0.07 0.93
Zone3Position 6 202.31 1.38 0.243
Error 43 1447.67
Percentage cover, 12 August
Zone 2 2510.49 1.86 0.169
Position 1 174.25 0.13 0.722
Zone3Position 5 1565.15 1.16 0.347
Error 40 1351.83
Percentage cover, 26 August
Zone 3 26 496.11 43.05 ,0.0001
Position 2 4142.08 6.74 0.011
Zone3Position 6 1283.42 2.09 0.072
Error 127 615.55
3.2.2. Abundance ( percentage cover)
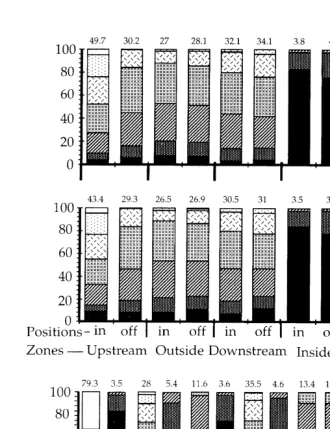
Results of the ANOVAs on the percentage cover showed the effect of the zone on two retrieval dates (Table 1). There was a significant difference in total percentage cover among zones after 52 (27 July) and 81 (26 August) days of submersion (Fig. 3A and C). Percent cover was significantly greater inside the bay than at least two zones external to the bay. There were no significant differences among the four zones after 67 days of submersion (Fig. 3B).
3.2.3. Abundance (density of recruits)
22
Fig. 3. Mean (6S.E.) percent cover (A, B and C) and mean density of epibenthic recruits (N. 128 cm ;6S.E.; D, E and F) on panels moored in different zones and retrieved on 27 July, 12 and 26 August 1993. Bars having dissimilar letters above them differed significantly from each other. Nearly all recruits were observed inside the bay, and no statistical analyses were done.
(52 days of submersion; 27 July). After 67 and 81 days of submersion (12 and 26 August) the maximal number of recruits in these zones external to the bays was seven barnacles. The number of recruits increased on panels in the bay with increasing period
2
of submersion, reaching between 450 to 800 recruits per 128 cm (mean5636 recruits
2
per 128 cm ) at the end of August.
3.2.4. Meroplanktonic larvae
We tested the hypothesis that recruitment per panel in 1993 would be related to the PLF in each zone. Results of the ANOVAs showed a significant difference in potential
larval flux among zones for the period of time between 7 June and 27 July (F566.5,
P,0.0001) and 7 June to 12 August (F541.4, P,0.0001). The smallest PLF for the
contrary to expectation, given that the only zone where recruits were observed was inside the bay in 1993.
3.3. Physical environment in 1994
Mean current velocities in zones inside each bay were much smaller than in zones outside bays (Fig. 2C). No significant differences in mean current velocities were observed among zones along the straight coast. Currents inside the bays of
Grosses-21
´
Roches, Anse des Mechins, Anse aux Coques and Anse du Petit Mitis were ,5 cm s ,
84, 54, 76 and 63% of the time, respectively (Fig. 2C). The zone outside
Grosses-21
Roches had a current velocity $25 cm s 83% of the time (51% of the time between
21 21
25 and 100 cm s and 32% of the time $100 cm s ). Zones outside Anse des
21
´
Mechins and Anse du Petit Mitis had current velocities $25 cm s 61% of the time.
The smallest salinity measured was in the zone inside the smallest bay, Grosses-Roches (24.6). The greatest value was in the zone outside the largest bay, Anse du Petit Mitis (26.3). Water temperature followed the opposite pattern, with the smallest value in the
zone outside Anse du Petit Mitis (8.68C) and the greatest inside the bay of
Grosses-Roches (11.28C).
3.4. Community characteristics in 1994
3.4.1. Diversity
A total of seventeen benthic sessile species (eleven spp. of algae and six spp. of invertebrates) were observed on panels. The greatest numbers of species (fourteen) were in zones inside and outside Anse aux Coques, and the smallest number was in the zone inside the bay at Grosses-Roches (seven species). We did not find a spatial gradient in the number of species along the region studied (see also Fradette and Bourget, 1980; Ardisson and Bourget, 1992). The mussel Mytilus edulis was the most abundant invertebrate species observed on panels.
Diversity (H9) was significantly different for all sources of variation (Table 2) except
the interaction bay with position. Mean diversity was significantly greater in zones inside ´
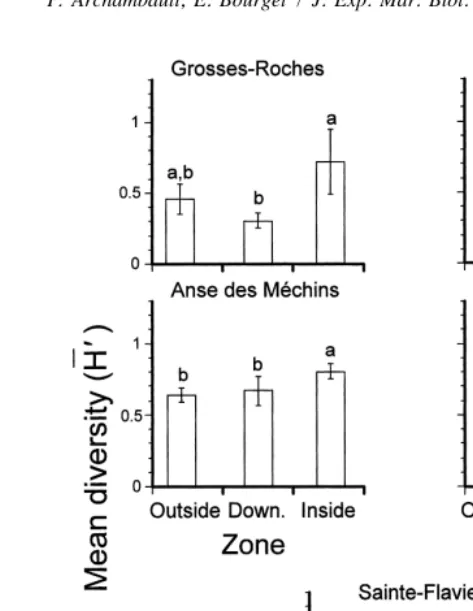
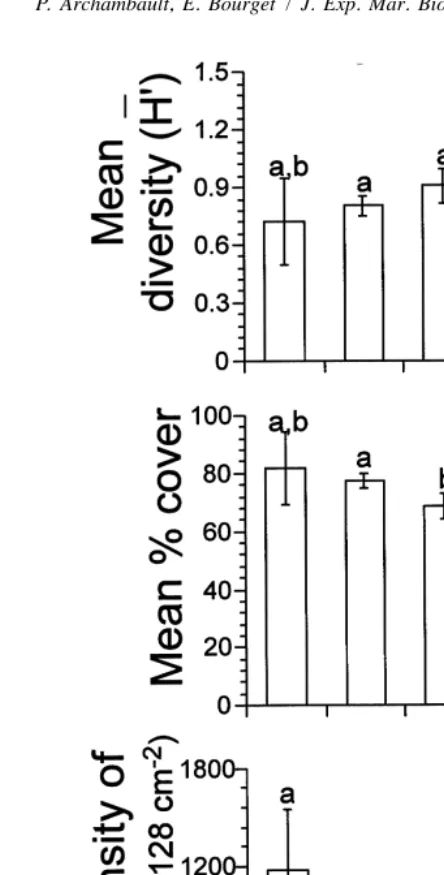
the bays of Anse du Petit Mitis and Anse des Mechins compared to other zones (Fig. 4). The smallest diversity was recorded along the straight coast (Sainte-Flavie). We observed no difference in mean diversity among zones at Grosses-Roches nor along the straight coast. Mean diversity inside bays increased with size of bay (Fig. 6A), but this tendency was significant only between the largest bay and the others.
3.4.2. Abundance (% cover)
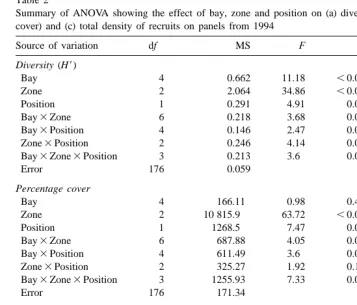
Table 2
Summary of ANOVA showing the effect of bay, zone and position on (a) diversity, (b) total abundance (% cover) and (c) total density of recruits on panels from 1994
Source of variation df MS F P
Diversity (H9)
Bay 4 0.662 11.18 ,0.0001
Zone 2 2.064 34.86 ,0.0001
Position 1 0.291 4.91 0.028
Bay3Zone 6 0.218 3.68 0.002
Bay3Position 4 0.146 2.47 0.05
Zone3Position 2 0.246 4.14 0.02
Bay3Zone3Position 3 0.213 3.6 0.015
Error 176 0.059
Percentage cover
Bay 4 166.11 0.98 0.42
Zone 2 10 815.9 63.72 ,0.0001
Position 1 1268.5 7.47 0.007
Bay3Zone 6 687.88 4.05 0.0008
Bay3Position 4 611.49 3.6 0.008
Zone3Position 2 325.27 1.92 0.15
Bay3Zone3Position 3 1255.93 7.33 0.0001
Error 176 171.34
22
Total density of recruits (N. 128 cm )
Bay 4 6.47 53.13 ,0.0001
Zone 2 6.62 54.4 ,0.0001
Position 1 7.76 63.76 ,0.0001
Bay3Zone 6 0.19 1.53 0.17
Bay3Position 4 1.13 9.27 ,0.0001
Zone3Position 2 1.31 10.8 ,0.0001
Bay3Zone3Position 3 0.74 6.12 0.0006
Error 176 0.12
coast (SF; Fig. 6B), but differences were not significant. Mean percentage cover along the straight coast was significantly smaller than zones inside bays (Fig. 6B).
3.4.3. Abundance (density of recruits)
22
Total density of recruits (N.128 cm ) was significantly influenced by all sources of
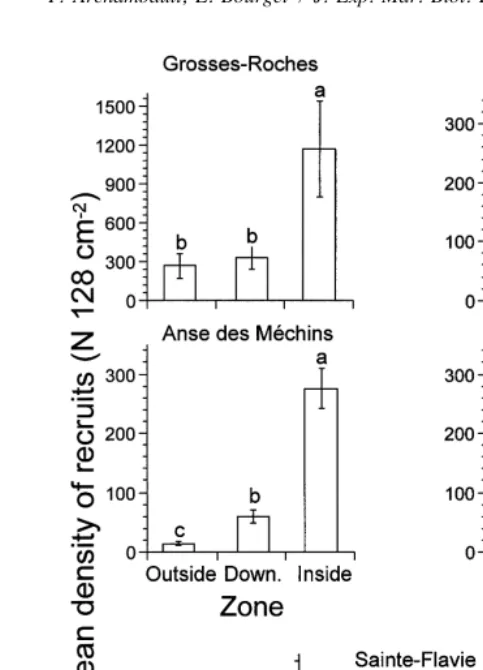
variation examined (Table 2) except the interaction bay with zone. Mean density of recruits in zones within bays was significantly greater than in zones external to bays (outside and downstream); it was also greater than in the three zones along the straight coast (Fig. 7). The density of recruits in the zone inside Anse du Petit Mitis was not significantly different from zones along the straight coast. There was a significant decrease in mean density of recruits with increasing size of bay (Fig. 6C).
3.4.4. Meroplanktonic larvae
Fig. 4. Mean diversity (H96SE) of epibenthic community on panels moored in 1994 in each zone (outside, down.5downstream and inside) within bays and along the straight coast (Upst.5upstream and Down.5 downstream). Bars having dissimilar letters above them differ significantly from each other.
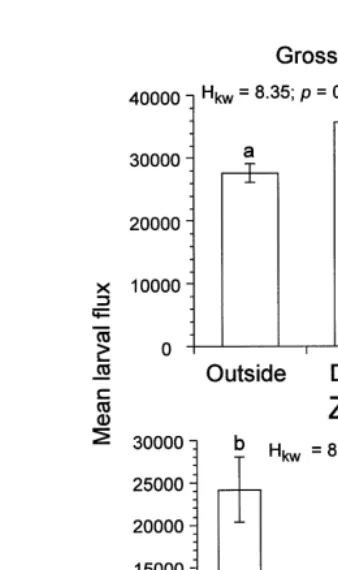
coast, potential larval fluxes were not significantly different among zones (Anse des ´
Mechins, Hkw50.35, P50.84; Anse aux Coques, Hkw50.62, P50.74; Anse du Petit
Mitis, Hkw55.12, P50.08 and Sainte-Flavie, Hkw53.35, P50.19). The comparison
of zones inside each bay, showed a tendency of decreasing potential larval fluxes with size of bay (Fig. 8B).
3.4.5. Recruitment in relation to mean current velocity
Potential larval flux (mean current velocity3mean abundance of meroplanktonic
larvae; Section 3.4.4) alone cannot explain the small recruitment observed in zones external to bays. Density of recruits (dependent variable) was regressed against the mean current velocity (independent variable; Fig. 9). The density of recruits was square root transformed and the mean current velocity was 1 /X transformed to meet assumptions of normality and homogeneity of variances. The homogeneity of variances was tested by graphical examination (Scherrer, 1984). The transformation did not completely
Fig. 5. Mean percentage cover (6S.E.) on panels moored in 1994 in each zone (outside, down.5downstream and inside) within bays and along the straight coast (Upst.5upstream and Down.5downstream). Bars having dissimilar letters above them differ significantly from each other.
departure was observed (kurtosis53.8 and skewness5 20.7). Following these
ob-servations, we assumed near normal distribution and indeed normality could be achieved
21
when a single data point was removed (point at 79 cm s , Fig. 9). The resulting model
(including all data) explained 76% of the variation in the density of recruits. When the
21
79 cm s value was removed, the resulting model explained 86% of the variation in
density of recruits.
4. Discussion
Fig. 6. Effect of size of bay (GR5Grosses-Roches, MC5Anse des Mechins, AC5Anse aux Coques and MT5Anse du Petit Mitis) and the straight coast (SF5Sainte-Flavie) on (A) mean diversity (H9;6S.E.), (B)
22
% cover (6SE) and (C) density of recruits (N. 128 cm ;6S.E.) on panels of 1994. Bars having dissimilar letters above them differ significantly from each other. Size of bay increases from left to right.
alter the distribution of holoplankton (Alldredge and Hamner, 1980) and probably
meroplankton. At small spatial scales (, m), recruitment of benthic sessile
22
Fig. 7. Mean density of recruits (N. 128 cm ; 6S.E.) for 1994 in each zone within bays (Down.5 downstream) and along the straight coast (Upst.5upstream and Down.5downstream). Bars having dissimilar letters above them differ significantly from each other. Note that the ordinate axis of the bay Grosses-Roches differs from the others bays.
turn, is related to larval density and current velocity. In this study, we examine whether shoreline configuration influences benthic community characteristics (diversity, per-centage cover and recruitment) through local modifications of hydrodynamics, larval abundances and potential larval fluxes.
4.1. Diversity and percentage cover
A few terrestrial (Simpson, 1964; Cook, 1969; Smith et al., 1994; Wickham et al., ´
Fig. 8. Mean laval flux for 1994 at (A) Grosses Roches and (B) inside each bay (GR5Grosses-Roches, MC5Anse des Mechins, AC5Anse aux Coques and MT5Anse du Petit Mitis).
Our results show that diversity (H9) and percentage cover were significantly greater
inside than in zones external to bays for three out of four periods examined (first and last periods of submersion in 1993; the only period in 1994). Our results contrast with those of Archambault and Bourget (1996) and Blanchard (1997), who could not find a relationship between large-scale configuration of shoreline and diversity in the intertidal zone of the St. Lawrence Estuary. In our study, we observed a tendency of increasing benthic diversity with increasing size of bay. Large-scale configuration of shoreline also negatively influenced percentage cover but not significantly. These results suggest that processes by which large-scale configuration of shoreline influence diversity were much more pronounced in subtidal than in intertidal habitats. Earlier studies (Archambault and Bourget, 1996; Blanchard, 1997) hypothesized physical factors such as annual ice-scouring masked mechanisms by which large-scale configuration of intertidal regions could influence diversity. Bourget et al. (1994a) suggested directly and Lindergarth et al. (1995) indirectly, that topographical heterogeneity could modify subtidal diversity and abundance of benthic communities.
21 22
Fig. 9. Relationship between velocity (cm s ) and density of recruits (N. 128 cm ) including the data from 1993 and 1994.
review). Large bays (areas) were expected to contain more species than small bays because they likely included more biotopes. Although size of sample and habitat were the same on each panel, the possibility of finding rare species was probably increased in the large bays.
4.2. Recruitment
(upstream, outside and downstream) the recruitment pattern showed no relationship with PLF and other mechanisms must be sought.
Recruitment patterns reflect survivorship over a defined period after competition, predation, growth and other post-settlement processes (Keough and Downes, 1982; Underwood and Denley, 1984) have thinned out populations of settlers. In our study, competitive interactions may have occurred inside bays given the high numbers of recruits but intra- and inter-specific competition were probably not important factors
2
influencing densities outside bays (#7 barnacles per 128 cm in 1993 and a mean of
2
83.6 barnacle spat ,1 cm and / or mussels ,5 mm per 128 cm in 1994). For
comparison, Crisp and Southward (1958) observed densities of Semibalanus balanoides
22
as large as 4.1 adults cm on the coast of the English Channel and Carroll (1996)
22
observed densities as large as 50 recruits cm for three species of barnacle (S.
balanoides, S. cariosus and Balanus glandula) in southcentral Alaska. Connell (1961)
observed reduced mortality (,30%) due to competition in S. balanoides populations
22
during the first growing season, with densities of 10 individuals cm . Bourget and
Lacroix (1973) observed a density of barnacle between 1.65 and 2.19 barnacles (Balanus
22
crenatus) cm in the natural population in the area of Anse du Petit Mitis. In our study area, predation is not likely to be an important factor influencing early community development. No sedentary predators were observed on panels in 1993 and 1994 and no mobile predators (e.g. fishes) were ever observed by divers in the vicinity of panels. Indeed, in northern regions they are very few mobile predators (Himmelman, 1991; Bourget et al., 1994b). Thus, factors other than biological interactions probably explain pattern of recruitment outside bays.
Seventy-six percent of the variation in density of recruits could be explained by changes in mean current velocity in each zone (Fig. 9). Current velocity has been shown to influence larval settlement in the laboratory, where it can modify the ability of larvae to settle (Crisp, 1955) or to dislodge settled organisms (Walton Smith, 1946). To our knowledge, no data on Balanus crenatus or Mytilus edulis are available to examine in more detail the relationship between current velocity, settlement and dislodgement.
Density of recruits increased with decreasing size of bay. Maximal density of recruits was observed inside the smallest bay (0.15 km, Fig. 6). Lindergarth et al. (1995)
0 5
investigated spatial scales between 10 and 10 m and concluded that spatial variability in abundance of two infaunal bivalves was best explained by scales of 1 km and 100 m. The mechanisms which result in the spatial patterns are diverse and complex. Large-scale hydrodynamic processes (retention, presence of gyres or eddies, flushing rates) may explain a large portion of this pattern.
Empirical studies have shown that bays may favour entrapment of zooplankton ´
This study shows, for the first time, a possible relationship between configuration of shoreline, hydrodynamics, recruitment and community characteristics. It remains to examine the generality of this relationship in different systems (Carpenter, 1990; Hargrove and Pickering, 1992).
Acknowledgements
´
We thank F. Guichard, M. Cusson, D. Courtemanche, E. Pilote and M. Levesque for ´
field assistance. We also thank Dr. M. Frechette (Institut Maurice-Lamontagne) for
´ ´ ´
providing laboratory space and Gaetan Daigle (Departement de mathematiques et statistique) for aid with statistical treatments. Special thanks are due to Diane Blanchard and Daniel Larocque for their help with panel analyses, Dr. Gilles Miron and two anonymous reviewers who critically read the manuscript and C. Lovejoy for linguistic improvements. This research was supported by NSERC grants (Natural Sciences and Engineering Research Council of Canada) to E. Bourget. P. Archambault was supported by an FCAR scholarship during the course of this study. This is a contribution to the
´
program of GIROQ (Groupe interuniversitaire de recherches oceanographiques du ´
Quebec).
References
Addelman, S., 1974. Computing the analysis of variance table for experiments involving qualitative factors and zero amounts of quantitative factors. Am. Stat. 28, 21–22.
Alldredge, A.L., Hamner, W.M., 1980. Recurring aggregation of zooplankton by a tidal current. Estuar. Coastal Mar. Sci. 10, 31–37.
Archambault, P., Bourget, E., 1996. Scales of coastal heterogeneity and benthic intertidal species richness, diversity and abundance. Mar. Ecol. Prog. Ser. 136, 111–121.
Archambault, P., Roff, J.C., Bourget, E., Bang, B., Ingram, G.R., 1998. Nearshore abundance of zooplankton in relation to coastal topographical heterogeneity and mechanisms involved. J. Plank. Res. 20, 671–690. Ardisson, P.-L., Bourget, E., 1992. Large-scale ecological patterns: discontinuous distribution of marine
benthic epifauna. Mar. Ecol. Prog. Ser. 83, 15–34.
Bang, B., Ingram, R.G., Laval, B.E., Archambault, P., Bourget, E. Nearshore tidal dynamics around a promontory-bay system: implication for planktonic larval distribution. J. Geophys. Res., submitted for publication.
Black, K.P., Gay, S.L., Andrews, J.C., 1990. Residence times of neutrally-buoyant matter such as larvae, sewage or nutrients on coral reefs. Coral Reefs 9, 105–114.
´ ´ ´ ´ ´ ´ ˆ ` ´
Blanchard, D., 1997. Influence des echelles d’heterogeneite cotiere sur la structure de la communaute
´ ´
benthique littorale de l’estuaire du Saint-Laurent. Master Thesis, Universite Laval, Quebec.
Boicourt, W.C., 1982. Estuarine larval retention mechanisms on two scales. In: V. Kennedy (Ed.), Estuarine Comparasons, Academic Press, New York, pp. 445–457.
´ ´
Bourget, E., Lacroix, G., 1973. Aspects saisonniers de la fixation de l’epifaune benthique de l’etage infralittoral de l’estuaire du Saint-Laurent. J. Fish. Res. Board Can. 30, 867–880.
Bourget, E., DeGuise, J., Daigle, G., 1994. Scales of substratum heterogeneity, structural complexity, and the early establishment of a marine epibenthic community. J. Exp. Mar. Biol. Ecol. 181, 31–51.
Butman, C.A., 1987. Larval settlement of soft-sediment invertebrates: the spatial scales of pattern explained by active habitat selection and the emerging role of hydrodynamical processes. Oceanogr. Mar. Biol. Ann. Rev. 25, 113–165.
´ ´
Cardinal, A., 1964. Etude sur les ectocarpacees de la Manche. Beihefte Zur Nova Hedwigia, Vol. 15, 86 pp. Carpenter, S.R., 1990. Large-scale perturbations: opportunities for innovation. Ecology 71, 2038–2043. Carroll, M.L., 1996. Barnacle population dynamics and recruitment regulation in southcentral Alaska. J. Exp.
Mar. Biol. Ecol. 199, 285–302.
Connell, J.H., 1961. Effects of competition, predation by Thais lapillus, and other factors on natural populations of the barnacle Balanus balanoides. Ecol. Monogr. 31, 61–104.
Connell, J.H., 1985. The consequences of variation in initial settlement vs. post-settlement mortality in a rocky intertidal communities. J. Exp. Mar. Biol. Ecol. 93, 11–45.
Conover, W.J., 1980. Practical nonparametric statistics. Wiley, New York.
Cook, R.E., 1969. Variation in species density of North American birds. Syst. Zool. 18, 63–84.
Crisp, D.J., 1955. The behaviour of barnacle cyprids in relation to water movement over a surface. J. Exp. Biol. 32, 569–590.
Crisp, D.J., Southward, A.J., 1958. The distribution of intertidal organisms along the coasts of the English Channel. J. Mar. Biol. Ass. U.K. 37, 157–208.
Dame, R.F., Allen, D.M., 1996. Between estuaries and the sea. J. Exp. Mar. Biol. Ecol. 200, 169–185. Ebert, T.A., Russell, M.P., 1988. Latitudinal variation in size structure of the west coast purple sea urchin: a
correlation with headlands. Limnol. Oceanogr. 33, 286–294.
Eckman, J.E., 1983. Hydrodynamic processes affecting benthic recruitment. Limnol. Oceanogr. 28, 241–257. Eckman, J.E., 1987. The role of hydrodynamics in recruitment, growth, and survival of Argopecten irradians (L.) and Anomia simplex (D’Orbigny) within eelgrass meadows. J. Exp. Mar. Biol. Ecol. 106, 165–191. Fradette, P., Bourget, E., 1980. Ecology of benthic epifauna of the estuary and gulf of St. Lawrence: factors
influencing their distribution and abundance on buoys. Can. J. Fish. Aquat. Sci. 37, 979–999.
Gaines, S., Brown, S., Roughgarden, J., 1985. Spatial variation in larval concentrations as a cause of spatial variation in settlement for the barnacle Balanus glandula. Oecologia 67, 267–272.
Gates, C.E., 1991. A user’s guide to misanalyzing planned experiments. Hortsc. 26, 1262–1265.
Geyer, W.R., Signell, P.R., 1990. Measurements of tidal flow around a headland with a shipboard acoustic doppler current profiler. J. Geophys. Res. 95, 3169–3197.
Grosberg, R.K., 1981. Competitive ability influences habitat choice in marine invertebrates. Nature 290, 700–702.
Hargrove, W.W., Pickering, J., 1992. Pseudoreplication: a sine qua non for regional ecology. Landsc. Ecol. 6, 251–258.
Harvey, M., Bourget, E., Legault, C., Ingram, R.G., 1995. Short-term variations in settlement and early spat ¨
mortality Iceland scallop, Chlamys islandica (O.F. Muller). J. Exp. Mar. Biol. Ecol. 194, 167–187. Havenhand, J.N., Svane, I., 1991. Roles of hydrodynamics and larval behavior in determining spatial
aggregation in the tunicate Ciona intestinalis. Mar. Ecol. Prog. Ser. 68, 271–276.
Himmelman, J.H., 1991. Diving observations of subtidal communities in the northern gulf of St Lawrence. In: J.C. Therriault (Ed.), The gulf of St Lawrence: small or big estuary?. Can. Spec. Publ. Fish. Aquat. Sci. 113, 319–332.
Hocking, R.R., 1985. The analysis of linear models. Brooks / Cole, Monterey.
´ ´
Jobbagy, E.G., Paruelo, J.M., Leon, R.J.C., 1996. Vegetation heterogeneity and diversity in flat and mountain landscapes of Patagonia (Argentina). J. Veg. Sci. 7, 599–608.
Keough, M.J., Downes, B.J., 1982. Recruitment of marine invertebrates: the role of active larval choices and early mortality. Oecologia 54, 348–352.
Laval, B.E., 1995. Tidal flow modification by a small bay in the lower St. Lawrence Estuary. Master Thesis, ´
McGill University, Montreal.
Lindergarth, M., Andre, C., Jonsson, P.R., 1995. Analysis of the spatial variability in abundance and age structure of two infaunal bivalves, Cerastoderma edule and C. lamarcki, using hierarchical sampling programs. Mar. Ecol. Prog. Ser. 116, 85–97.
Lobel, P.S., Robinson, A.R., 1986. Transport and entrapment of fish larvae by ocean mesoscale eddies and currents in Hawaiian waters. Deep Sea Res. 33, 483–500.
Milliken, G.A., Johnson, D.E., 1992. Analysis of Messy Data, Vol. 1. Designed Experiments. Van Nostrand Reinhold, New York.
Minchinton, T.E., Scheibling, R.E., 1991. The influence of larval supply and settlement on the population structure of barnacles. Ecology 72, 1867–1879.
Miron, G., Boudreau, B., Bourget, E., 1995. Use of larval supply in benthic ecology: testing correlations between larval supply and larval settlement. Mar. Ecol. Prog. Ser. 124, 301–305.
Miron, G., Bourget, E., Archambault, P., 1996. Scale of observation and distribution of adult conspecifics: their influence in assessing passive and active settlement mechanisms in the barnacle Balanus crenatus
`
(Brugiere). J. Exp. Mar. Biol. Ecol. 201, 137–158.
Mullineaux, L.S., Butman, C.A., 1990. Recruitement of encrusting benthic invertebrates in boundary-layer flows: a deep-water experiment on Cross Seamount. Limnol. Oceanogr. 35, 409–423.
Murdoch, R.C., 1989. The effects of headland eddy on surface macro-zooplankton assemblages north of Otago Peninsula, New Zealand. Estuar. Coastal Mar. Sci. 29, 361–383.
Okubo, A., 1973. Effect of shoreline irregularities on streamwise dispersion in estuaries and other embayments. Neth. J. Sea Res. 6, 213–224.
Pawlik, J.R., Butman, C.A., 1993. Settlement of a marine tube worm as a function of current velocity: interacting effects of hydrodynamics and behavior. Limnol. Oceanogr. 38, 1730–1740.
Pingree, R.D., Maddock, L., 1979. The tidal physics of headland flows and offshore tidal bank formation. Mar. Geol. 32, 269–289.
Ricklefs, R.E., Schluter, D., 1993. Species diversity in ecological communities: historical and geographical perspectives. The University of Chicago Press, Chicago.
Roff, J.C., Pett, R.J., Rogers, G.F., Budgell, W.P., 1979. A study of plankton ecology in Chesterfield Inlet, Northwest Territories: an arctic estuary. In: V.S. Kennedy (Ed.), Estuarine Perpectives, Academic, New York, pp. 185–197.
Roughgarden, J., Gaines, S.D., Pacala, S.W., 1987. Supply side ecology: the role of physical transport processes. In: J.H.R. Gee, P.S. Giller (Eds.), Organization of Communities, Blackwell, Oxford, pp. 491–518.
SAS, 1988. SAS user’s guide: Statistics. SAS Institute, Cary, 6.03 edition. ¨
Scherrer, B., 1984. Biostatistique. Gaetan Morin, Chicoutimi.
Shepherd, S.A., Lowe, D., Partington, D., 1992. Studies on southern Australian abalone (genus Haliotis) XIII: larval dispersal and recruitment. J. Exp. Mar. Biol. Ecol. 164, 247–260.
Signell, R.P., Geyer, W.R., 1991. Transient eddy formation around headlands. J. Geophys. Res. 96, 2561–2575. Simpson, G.G., 1964. Species density of North American recent mammals. Syst. Zool. 13, 57–73. Smith, F.D.M., May, R.R., Harvey, P.H., 1994. Geographical ranges of Australian mammals. J. Anim. Ecol.
63, 441–450. ´
Thiebaut, E., Dauvin, J.-C., Lagadeuc, Y., 1994. Horizontal distribution and retention of Owenia fusiformis larvae (Annelida: Polychaeta) in the bay of Seine. J. Mar. Biol. Ass. UK 74, 129–142.
Thorson, G., 1950. Reproductive and larval ecology of marine bottom invertebrates. Biol. Rev. 25, 1–45. Underwood, A.J., Denley, E.J., 1984. Paradigms, explanations, and generalizations in models of the structure
of intertidal communities on rocky shores. In: J.D.R. Strong, D. Simberloff, L.G. Abele, A.B. Thistle (Eds.), Ecological Communities Conceptual Issues and the Evidence, Princeton University Press, Princeton, pp. 151–180.
Underwood, A.J., Fairweather, P.G., 1989. Supply-side ecology and benthic marine assemblages. Trends Ecol. Evol. 4, 16–20.
Underwood, A.J., 1997. Experiments in ecology: their logical design and interpretation using analysis of variance. Cambridge University Press, Cambridge.
Van der Baaren, A., Wang, J., Ingram, R.G., 1995. A report on numerical similations of tidal flow past a headland and within a small shallow bay: l’Anse du Petit Mitis. Bedford Institute of Oceanography internal report, Bedford.
Van Guelpen, L., Markle, D.F., Duggan, D.J., 1982. An evaluation of accuracy, precision and speed of several zooplankton subsampling techniques. J. Cons. Int. Explor. Mer 40, 226–236.
Wickham, J.D., Wade, T.G., Jones, K.B., Riitters, K.H., O’Neill, R.V., 1995. Diversity of ecological communities of the United States. Vegetatio 119, 91–100.
Wolanski, E., 1993. Facts and numerical artefacts in modelling the dispersal of crown-of-thorns starfish larvae in the Great Barrier Reef. Aust. J. Mar. Freshwater Res. 44, 427–436.
Wolanski, E., Hamner, W.M., 1988. Topographically controlled fronts in the ocean and their biological influence. Science 241, 177–181.