Equilibrium Relationship Between Taxable
and Tax-Exempt Interest Rates
William T. Chittenden* and Scott E. Hein
This study investigates the long-run equilibrium relationship between yields on taxable and tax-exempt securities of comparable maturity. The first relationship requires that taxable and tax-exempt security yields are unrelated on a before-tax basis. Our evidence is consistent with this hypothesis. The second relationship requires that taxable and tax-exempt security yields, on a tax-adjusted basis, be related with one another. Using selective tax rate series, evidence consistent with this hypothesis is provided. Finally, it is argued that after-tax, taxable yields should be adjusting to equilibrium in the face of tax rate changes. However, our evidence indicates that tax-exempt yields adjust in the face of tax rate changes. © 1999 Elsevier Science Inc.
Keywords:Interest rates; Taxes; Cointegration
JEL classification:C22, G1, H2
I. Introduction
There exists a relatively large empirical literature which has examined the relationship between the relative yields on taxable and tax-exempt securities in the United States. To a great extent, these papers have attempted to differentiate between the Miller (1977) Debt and Taxes model and a market segmentation approach emphasizing the role of unique economic agents, such as commercial banks. The framework Miller (1977) used gives no special consideration to various economic agents, as relative taxable and tax-exempt yields shift only as a result of corporate tax rate changes, holding default considerations constant. On the other hand, the market segmentation view stresses key economic players
Department of Finance, College of Business Administration, Northern Illinois University, DeKalb, Illinois; Department of Finance, College of Business Administration, Texas Tech University, Lubbock, Texas.
Address correspondence to: Dr. W. T. Chittenden, Department of Finance, College of Business Adminis-tration, Northern Illinois University, DeKalb, IL 60115.
in the market for tax-exempt debt, and emphasizes maturity concerns. In particular, commercial banks are held to operate almost exclusively at the short end of the maturity spectrum of the municipal security market, causing the yield curve to be invariably upward sloping, at least prior to the 1986 Tax Reform Act.
Not surprisingly, the empirical evidence regarding these alternative theories is mixed. Campbell (1980) and Trzcinka (1982, 1986) found evidence in the behavior of relative yields which they considered to be consistent with Miller’s theory, while Kidwell and Koch (1983), Buser and Hess (1986) Peek and Wilcox (1986), and Hein et al. (1995) found evidence they considered to be inconsistent with Miller. For the most part, these studies examined the forces which cause relative (tax-exempt to taxable) yields to shift. To date, studies of Miller equilibrium and market segmentation have been primarily investigations of the relative term structures in the tax-exempt securities market vis-a`-vis the taxable securities market, and the shape of the respective yield curves. The present paper takes a different approach. In this paper, we examine the time series behavior of yields on two securities, with the same maturity, but different federal income tax treatment. The Miller (1977) framework is used to draw strong time series implications for the behavior of these yields over time.
Three separate, testable hypotheses are developed relating taxable and tax-exempt security yields. The first hypothesis is that nominal taxable yields and tax-exempt yields, with the same maturity, arenotcointegrated with one another. More specifically, changes in effective tax rates are presumed to be large enough, and important enough, over time to destroy any systematic long-run association between these two yields. The second hypothesis is that on a tax-adjusted1 basis, taxable and tax-exempt yields, of a given maturity, are cointegrated. In other words, the tax-adjusted yields on these respective securities with the same maturity, but different federal income tax treatment, cannot wander off independent of one another. If, for example, something were to unexpectedly cause the after-tax yield on Treasury securities to rise abnormally, this would be expected to set in motion arbitrage forces which would work to either increase tax-exempt yields, or work to decrease subsequent after-tax yields on Treasury securities, or both. The last hypothesis concerns how the long-run equilibrium developed in the second hypothesis will be maintained. Miller (1977) treated tax-exempt yields as exogenous. This might suggest that after-tax, taxable yields would adjust to maintain equilibrium in the face of tax rate changes. In other words, the Treasury security yield could be expected to decline, offsetting the unexplained rise in after-tax Treasury yields. Alternatively, of course, one could expect the tax-exempt yield to rise to bring this yield in line with the Treasury security yield. This represents the third hypothesis to be considered.
As a final consideration, we investigate the issue of which tax rate is most relevant in shaping these relative yields. The Miller (1977) framework emphasizes the role of corporate income taxes. Changes in personal income tax rates, in this setting, have no direct impact on the relative yields. This proposition is very different from what appears to be the conventional wisdom on Wall Street. In particular, Wall Street seems to believe that changes in personal income tax codes are more relevant than changes in corporate tax
1We define “tax-adjusted” here to generally refer to the situation in which both the tax-exempt and taxable
codes in determining relative yields on like taxable and tax-exempt securities. Also, Peek and Wilcox (1986) and Hein et al. (1995) provided evidence supporting the relative importance of personal income tax rate changes.
Moreover, the conventional wisdom of Wall Street appears to believe that changes in personal income tax codes will result in changes in tax-exempt yields, rather than changes in taxable yields, as Miller (1977) suggested. For example, numerous discussions of the proposed personal income tax rate increases of 1992 and 1993 have suggested that tax-exempt yields woulddecline in response to such tax increases.2 This prediction is quite different from that suggested from the Miller (1977) analysis. As the Miller framework takes the tax-exempt yield as given, this would suggest that taxable yields would be expected torise, if the relevant tax rate were increased.
The empirical evidence provided in this paper should be of interest to the academic community concerned with contrasting the Miller (1977) framework with the market segmentation framework, as our testable propositions were developed from the former analysis. In addition, the evidence should be of more general interest to the finance profession from the perspective of addressing the importance of tax rate changes and their influence on relative fixed income yields. In particular, our evidence indicates that both corporate and personal income tax rate changes have a significant impact on the relative yields for tax-exempt and taxable securities. Income tax rate reductions, for example, were generally found to be associated with reductions in tax-exempt yields relative to taxable yields. Such an association appears to be in line with the expectations expressed by Wall Street participants, but is contrary to models which take tax-exempt yields as given and not influenced by tax rate changes.
II. The Theory and Hypothesis Development
This section explicitly develops three hypotheses relating taxable and tax-exempt security yields over time. Securities in the taxable and tax-exempt markets are assumed to be identical in all regards except for their tax treatment. Income from taxable securities is assumed to be taxed, while income from tax-exempt securities is assumed not to be taxed.3
2Discussions inThe Wall Street Journaland The Washington Post, for example, attribute increases in
municipal bond prices (and decreases in their yields) to President Clinton’s proposal to increase marginal tax rates in 1992 and again in 1993: “Tax-exempt bonds are going to be one of the primary vehicles for avoiding the impact of these higher rates,” according to Gail Fosler, Chief Economist at the Conference Board [Herman (1993), p. R6]. Due to this increased demand, municipal security yields will change in the face of changing tax rates. Further, the day before the 1992 presidential election, it was stated that “tax-free bonds and notes began rising . . . in anticipation of a victory by . . . Bill Clinton. . . . Investors snapped up tax-exempt issues, driving prices higher” and yields lower, even though Treasury securities’ prices remained unchanged [Vogel (1992), p. C1]. Bill Veronda, vice president at Invesco Funds Group, further stated that “tax rates will be significantly higher, so municipals should show a fairly strong 1993” due to the increased demand in tax-exempt securities caused by the proposed tax hikes [Tourtellotte (1992), p. H9]. Even more academic discussions, such as Fabozzi (1996 p. 181.), argue similarly: “The higher the marginal tax rate, the greater the value of the tax exemption feature. As the marginal tax rate declines, the price of a tax-exempt security will decline.”
3The impact of state income taxes is ignored on the grounds that it is of a second-order magnitude. Not all
Non-Cointegration on a Before-Tax Basis
Changes in effective tax rates are assumed large, and frequent in their occurrence, yielding non-stationary properties to the time series of tax rates. In particular, it is assumed that the effective tax rate,tt, has a unit root,
ln~12tt!2ln ~12tt21!5 «t, (1)
where ln is the natural log, and«tis a random disturbance term with a constant mean and variance.4 Equation (1) simply states that the best predictor of tomorrow’s tax rate is today’s tax rate. It is our belief that tax rate changes are essentially unpredictable.
In addition to assuming that the effective tax rate has a unit root, we assume that arbitrage between taxable and tax-exempt yields,Rtand rt, respectively, prevents these twoafter-taxyields from departing from one another by more than a certain amount. For example, the Miller (1977) equilibrium, can be represented as:
Rt5rte
mt/~12t
t!, (2)
or
lnRt5lnrt2ln~12tt!1mt, (3)
indicating that the grossed-up yield on the tax-exempt security cannot deviate from the yield on the taxable security by more thanmt, an arbitrary amount beyond which arbitrage forces come into play to bring the two yields back in line with one another.5We assume thatmtis a stationary random variable with a constant mean and variance.
Under the assumption that the yield on tax-exempt securities is constant (rt5rt21), for example, equations (1) and (3) can be used to show:
lnRt5lnRt211ln~12tt21!2ln~12tt!1mt2mt21. (4) Equation (4) indicates that the taxable yield will have a unit root, even though the tax-exempt yield is assumed constant. In other words, the two yields (Rtandrt) arenot cointegrated as the taxable yield (Rt) is I(1), integrated of the first order, while the tax-exempt yield (rt) is assumed constant. We believe this model captures an important consideration. Specifically, ignoring changes in tax rates will be misleading and trouble-some. For example, it will appear that taxable yields are changing for no apparent reason, unless changes in tax rates are explicitly recognized.
Thus, it is hypothesized that, in the absence of explicit recognition of changes in tax rates, taxable and tax-exempt security yields will not bear a long-run equilibrium rela-tionship with one another. This hypothesis will be examined by testing the non-cointegration hypothesis for tax-exempt and taxable yields with similar maturities.
4This unit root assumption is empirically confirmed later in the paper for a number of different marginal tax
rate series.
5The termm
Cointegration on a Tax-Adjusted Basis
The preceding discussion points to the significant role that changes in effective tax rates play in equilibrating taxable and tax-exempt markets. Market yields are presumed to be equilibrated on a tax-adjusted basis. Ignoring the impact of tax rate changes causes the two markets to appear unrelated. On the other hand, explicitly recognizing tax rate changes will show that the two markets are directly intertwined with one another. Equation (2) can be rewritten to show that on a tax-adjusted basis the yields in the two markets will only deviate by an amount equal tomt,6
lnRt2lnrt2ln~12tt!5mt, (5)
where we define the tax-adjusted, tax-exempt yield to be lnrt 2 ln (1 2 tt). This adjustment is equivalent to grossing up tax-exempt yields to make them comparable to taxable yields. Assuming thatmtis a white noise random disturbance with a constant mean and variance, equation (5) suggests that the two yieldswill notwander off aimlessly on a tax-adjusted basis. Effective tax rate increases, for example, will result in higher taxable yields, so that the right-hand side of equation (5) is not affected. The difference between the two yields, on a tax-adjusted basis, will not be affected by changes in effective tax rates.
It is hypothesized that, with the explicit recognition of changes in effective tax rates (tt), taxable and tax-exempt yields will bear a long-run relationship to one another on a
tax-adjustedbasis. In other words, taxable and grossed-up tax-exempt interest rates should be cointegrated with each other, even if tax rates are non-stationary.7
Maintaining Long-Run Equilibrium
The first two hypotheses developed above deal with the importance of changes in effective tax rates. These hypotheses, together, suggest that tax rate changes are important and should not be ignored. However, the question as to how tax rate changes impact the respective markets remains an open issue. Should changes in effective tax rates cause
6Throughout this analysis, it is assumed that all securities are par bonds. This assumption further requires
the use of new-issue rates in the empirical analysis, which are presumably par bonds.
7The same result can be derived in level form, rather than log form. All variable definitions are identical to
those above. Given:
tt2tt215 «t, (19)
Miller (1977) equilibrium can be represented as:
Rt5rt/~12tt!1mt. (29)
Under the assumption that the tax-exempt yield is constant (rt5rt21), it can be shown that:
Rt5Rt212~rt/«t!1mt2mt21, (39)
which indicates that the taxable yield will have a unit root, even though the tax-exempt yield is assumed constant. This suggests that the taxable and tax-exempt yields are not cointegrated on a before-tax basis. If the difference in the tax treatments of the yields is accounted for, equation (2) can be rewritten to show:
Rt2rt/~12tt!5mt. (49)
taxable yields to change? Or should tax rate changes cause tax-exempt yields to change? Or do both yields adjust when tax rates change?
The Miller (1977) framework offers one perspective. In particular, the Miller frame-work suggests that changes in effective tax rates are important in altering before-tax yields on taxable securities (Rt). Miller (1977) showed that even in the face of taxes, there is no reason to prefer debt to equity. An important part of his argument is that the tax shelter provided by debt is priced in the market. In other words, the before-tax yield on taxable securities reflects the fact that interest on debt can be expensed for income tax purposes. Changes in tax rates will result in changes in taxable yields. In this framework, taxable yields must change to maintain equilibrium in response to exogenous shifts in either tax-rates or tax-exempt yields.
The Miller (1977) framework offers a very different perspective from what can be taken as the conventional wisdom of many on Wall Street. This view suggests that the endogenous variable is the tax-exempt yield (rt). The Wall Street view suggests that the tax-exempt yield is determined by the exogenous variables,Rtandt, the taxable yield and marginal tax rate, respectively. For a given Rt, the traditional wisdom on Wall Street suggests that increases in the effective tax rate will result in decreases in tax-exempt yields,rt, as market participants come to better appreciate the tax exemption features of municipal debt.
While both Miller and the Wall Street view have a different ordering of exogenous and endogenous variables, there is a common element to both views. Both suggest that there should be a long-run equilibrium relationship, on a tax-adjusted basis, between taxable and tax-exempt yields. Under both models, the marginal investor is indifferent between the taxable yield on an after-tax basis and the tax-exempt yield. As such, both models suggest that the ratio of tax-exempt to taxable yields will decrease with increases in effective tax rates. Earlier empirical analysis of the relationship between taxable and tax-exempt yields [Campbell (1980); Trzcinka (1982, 1986); Kidwell and Koch (1983); Buser and Hess (1986)] has emphasized the behavior of the yield ratio, e.g., the tax-exempt yield to taxable yield ratio.
Unfortunately, examining yield ratios will not distinguish between the two views, as it does not tell us how a new yield ratio is achieved. Obviously, a yield ratio can rise because of an increase in the numerator or a decrease in the denominator. Although both hypotheses predict the same ratio shifts, they have opposite predictions as to which yield is adjusting. In the Miller (1977) setting, a change in the effective tax rate will cause the taxable yield to adjust. The Wall Street view, on the other hand, suggests that the tax-exempt yield will adjust to changes in the effective tax rate. As these two models have opposite predictions about which yield causes the other to change, we propose to distinguish these two views by determining which model best describes the temporal cause-and-effect nature of the two yields. As detailed by Engle and Granger (1987), an error correction representation can be useful in examining the relative exogeneity of different variables. The error correction representation will be used to examine which rate is adjusting to maintain equilibrium.
The Effective Marginal Tax Rate
rate represents the effective tax rate. The Miller (1977) setting suggests that the corporate tax rate represents the effective rate for determining relative yields on taxable and tax-exempt securities. Changes in personal income tax rates should have no bearing on these relative yields according to the Miller framework.
Alternatively, there is much work to suggest that changes in personal income tax rates have a direct bearing on the relative yields of taxable and tax-exempt securities. Peek and Wilcox (1989) and Hein et al. (1995) provided evidence that changes in personal income tax rates matter in the shaping of these relative yields.
In an effort to further shed light on the appropriate measure of taxes for purposes of determining effective tax rates, we will examine corporate and individual income tax rates.
III. Data
This study, following earlier studies [Campbell (1980); Trzcinka (1982, 1986); Kidwell and Koch (1983); Buser and Hess (1986)], used the prime grade municipal security yields for the tax-exempt yields and the yields on, alternately, Treasury and AAA grade corporate securities for the equivalent taxable yields. Treasury securities are generally perceived as having less default risk than municipal securities. Corporate securities were also used as measures of taxable yields to mitigate default risk differences between the tax-exempt and taxable yields. The yields used are first of the month new-issue yields for 1, 5, 10, and 20 year maturity securities, covering the period January 1950 to December 1992 for the municipal and Treasury yields, and the period September 1970 to December 1992 for the corporate yields. Yields on tax-exempt and taxable instruments were matched by maturities.
the corporation (tCORP); 2) the natural log of the highest marginal federal income tax rate for an individual (tINDIV), and 3) the natural log of the marginal federal income tax rate for the average income recipient as measured by Peek and Wilcox (1986) (tPW).8Each of the three different marginal tax rates series are separately examined.
IV. Empirical Results
This section summarizes the empirical results pertaining to the three explicit hypotheses developed above. The first two hypotheses require tests of cointegration. Before cointe-gration can be considered, however, the stationarity of the data must be examined. Cointegration requires that all data be integrated of the same order. The first part of this section provides evidence on unit root tests on the various variables considered. Having confirmed that all yield series appear I(1), the following section provides evidence on the non-cointegration hypothesis. This discussion is followed by a description of error correction model estimates.
Stationarity Tests
Several unit root tests were performed to determine the stationarity of the various time series. We first used the traditional Augmented Dickey-Fuller (ADF) test. We also employed the Phillips-Perron test, as it is more robust to serial correlation and heteroske-dasticity than the ADF test [Baillie and Bollerslev (1989)]9. For both the ADF and Phillips-Perron tests, the null hypothesis tested is that the series contains a unit root. Some have criticized the ADF and Phillips-Perron tests for lacking power to reject the null hypothesis.10Therefore, we also employed the Kwiatkowski, Phillips, Schmidt and Shin (KPSS) test, where stationarity is the null hypothesis. For all tests, the Schwert (1987) rule was used to select the number of autocovariance terms for each test. With the number of monthly observations in our sample, the Schwert (1987) rule suggests including eighteen lags.
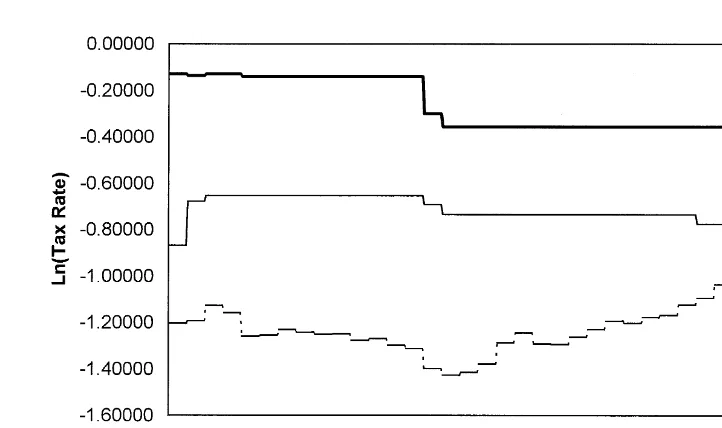
Table 1 confirms the suggestion from Figure 1, and the a priori belief in the development of the hypotheses, that the different tax rate series are non-stationary. The evidence from the ADF and Phillips-Perron tests in the upper panel of Table 1 failed to reject the unit root hypothesis for the log level of tax rates, regardless of the measure of taxes.11, 12In addition, the evidence from the KPSS test rejected the stationarity
hypoth-8There are various other marginal tax rate series that have been estimated. In addition to Peek and Wilcox
(1986), Joines (1981) Barro and Sahasakul (1983, 1986), and Hakkio et al. (1996) have estimated the average personal marginal tax rate. Graham (1996) has computed a corporate marginal tax rate series. We utilize only the above mentioned tax rate series in the current context and leave it for future research to explore the use of alternative tax rate series.
9For a detailed description of the Phillips and Perron (1988) test, see Hamilton (1994). 10For example, see DeGennaro et al. (1994).
11For the ADF tests, the reportedtratios forrin the regressionDy
t5a1ryt211¥biDt2i1ntare compared to the critical values given in Fuller (1976). For the Phillips-Perron tests, we report bothZ(r), the modified estimate ofr, andZ(t), the adjustedtstatistic. The Newey and West (1987) estimates of the variance were used to adjust thetstatistic such that it has the same asymptotic distribution as the ADFtstatistic. The null hypothesis for both the ADF and Phillips-Perron tests is that a series is non-stationary.
12All results presented here are similar to those obtained when examined in level form, as described in
esis.13Marginal corporate tax rates and individual income tax rates, regardless of whether they were the maximum level or the marginal rate for average incomes, all appear to be non-stationary with a unit root. On the other hand, the evidence in the lower panel from the ADF and Phillips-Perron tests rejected the unit root hypothesis for the first difference of the log level of tax rates, while the KPSS test failed to reject the unit root hypothesis, again regardless of the tax rate series. Thus, the evidence is consistent with the tax rate series as an I(1) process, for all measures.
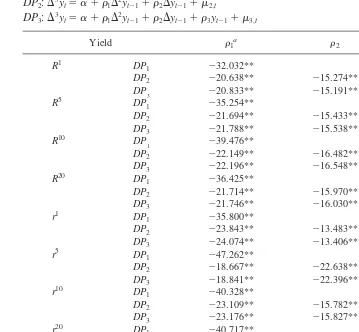
Table 2 confirms these conclusions by providing further evidence on the time series properties of the same tax rate series using the Dickey and Pantula (1987) test. Sequen-tially, tests for three, then two, and finally one unit root were performed [Mougoue (1992)]. The evidence in Table 2 rejected the hypothesis that the tax rate series is I(3) or I(2). On the other hand, the Dickey and Pantula (1987) test failed to reject the hypothesis that the series is I(1). Thus, all of the statistical evidence suggests that tax rates are I(1), regardless of the source of the tax rate measure.
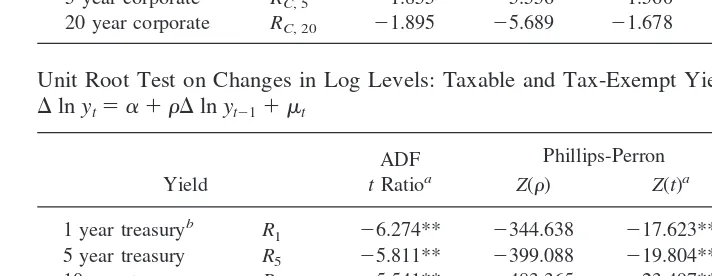
Table 3 provides the unit root test statistics for the ten different interest rate series used (six taxable series and four tax-exempt series). The upper panel reports the unit root test statistics for the log level of the yields, while the lower panel reports the statistics for the first difference in the log level of the yields. The Schwert rule was again used to determine the appropriate lag length. As with the different tax rate measures, the ADF and Phillips-Perron evidence in Table 3 failed to reject the unit root hypothesis for the log level of the variables, but rejected the unit root hypothesis for the first difference log variable. The KPSS test results confirm these results. This evidence was consistent with
13We report KPSS test statistics using both one autocovariance term,h
m, 1, and twelve autocovariance terms,
hm, 12. The null hypothesis for the KPSS test is that a series is stationary.
Table 1. Unit Root Test on Log Levels: Tax Rates lnyt5a 1 rlnyt211mt
Individual tINDIV 0.599 1.202 0.818 20.17** 3.205**
Peek-Wilcox tP.W. 21.878 23.854 21.181 3.04** 0.489*
Corporate tCORP 20.105 21.568 20.541 14.93** 2.426**
Unit Root Test on Change in Log Levels: Tax Rates
Dlnyt5a 1 rDlnyt211mt
Individual tINDIV 24.728** 2520.461 222.875** 0.311 0.334
Peek-Wilcox tP.W. 23.811** 2581.031 222.847** 0.189 0.181
Corporate tCORP 25.495** 2519.879 222.688** 0.395 0.395
a** 1% critical value5 23.44.
* 5% critical value5 22.87.
b** 1% critical value50.739.
each interest rate series being I(1).14Table 4 provides confirmatory evidence. This table provides the test statistics for the Dickey and Pantula (1987) test procedure. Again, the I(1) hypothesis could not be rejected, but the I(2) and I(3) hypotheses were rejected, at traditional levels, for all of the different interest rate series considered. Thus, the evidence is consistent with all tax rate and yield series being I(1).
Cointegration Tests on Before-Tax Yields
Given that all of the interest rate series are I(1), it is possible that taxable and tax-exempt interest rates are cointegrated. The first hypothesis considered is that pre-tax yields on taxable and tax-exempt securities with the same maturity are not cointegrated. As developed above, changes in effective tax rates are hypothesized to destroy any long-run equilibrium between these yields when the tax rate series considered has a unit root.
Table 5 reports the Johansen (1988) likelihood ratio cointegrating statistics for each pairwise combination of taxable and tax-exempt security yields matched by maturity. None of the statistics allowed rejection of the non-cointegration hypothesis at the 5% significance levels. Thus, there is no strong evidence of a long-run equilibrium relation-ship between pre-tax, taxable yields and tax-exempt yields of the same maturity. This evidence is consistent with the expectation that tax rate changes have been large enough and meaningful enough to destroy any long-run association between taxable and tax-exempt yields of a given maturity, although some of the likelihood ratio statistics are close to being significant. However, there is no strong evidence that taxable and tax-exempt yields have a common factor shaping their time series behavior. This conclusion is robust to cointegration test procedures, as Engle and Granger (1987) tests yielded similar conclusions, although these results are not presented here due to space considerations.
14The various interest rates remained I(1) when after-tax yields on taxable securities (lnR
t1ln(12t)) or when grossed-up municipal security yields (lnrt2ln(12t)) were considered. This evidence suggests that the various non-adjusted yield measures and the various tax rates arenotcointegrated with one another. Further tests are reported below.
Table 2. Dickey-Pantula Test Unit Root Test: Log of Tax Rates DP1:D3yt5a 1 r1D2yt211m1,t
DP2:D3yt5a 1 r1D2yt211r2Dyt211m2,t
DP3:D3yt5a 1 r1D2yt211r2Dyt211r3yt211m3,t
Tax Rate r1a r2 r3
tINDIV DP
1 239.154**
DP2 222.380** 216.186**
DP3 222.177** 216.125** 0.774
tCORP DP
1 239.154**
DP2 222.554** 216.000**
DP3 222.545** 215.770** 20.908
tP.W. DP
1 239.154**
DP2 222.568** 215.568**
DP3 222.478** 215.731** 20.471
a** 1%Dickey-Fuller critical value5 23.44.
Cointegration Tests on After-Tax Yields
The general expectation based on most models of relative yield determination suggests a long-run equilibrium relationship between tax-exempt and taxable security yields on a tax-adjusted basis. Arbitrage should prevent the yields from wandering too far from one another. Both Miller (1977) and the Wall Street view suggest these yields should not differ greatly on a tax-adjusted basis. To examine this general hypothesis, effective tax rates must be explicitly considered. In the subsequent analysis, the marginal corporate tax rate is first used as the measure of effective tax rates. Then, the highest marginal individual income tax rate and the Peek and Wilcox (1986) tax rate series are considered. Miller (1977) would suggest that the appropriate tax rate is the corporate tax rate, while segmentation arguments would emphasize individual income tax rates, especially for longer-term securities.
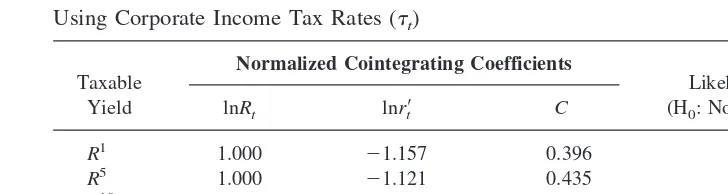
Table 6 summarizes the cointegration evidence using the marginal corporate tax rate to measure tax-adjusted yields. In this and all following tables, the prime notation, 9, indicates the yield is measured on a tax-adjusted basis, e.g., ln(r9t)5ln(rt)2ln(12tt),
Table 3. Unit Root Test on Log Levels: Taxable and Tax-Exempt Yields lnyt5a 1 rlnyt211mt
10 year treasury R10 21.789 23.747 22.140 22.56** 3.572**
20 year treasury R20 21.612 22.980 21.875 23.13** 3.035**
1 year municipal r1 21.911 27.982 22.466 20.05** 3.301**
5 year municipal r5 21.871 25.021 22.244 21.99** 3.526**
10 year municipal r10 21.820 24.257 22.189 22.42** 3.571**
20 year municipal r20 21.745 23.507 21.928 22.75** 2.401**
5 year corporate RC, 5 21.855 25.556 21.560 2.79** 0.477*
20 year corporate RC, 20 21.895 25.689 21.678 3.88** 0.643*
Unit Root Test on Changes in Log Levels: Taxable and Tax-Exempt Yields
Dlnyt5a 1 rDlnyt211mt
1 26.274** 2344.638 217.623** 0.211 0.201
5 year treasury R5 25.811** 2399.088 219.804** 0.299 0.306
10 year treasury R10 25.541** 2483.365 223.497** 0.258 0.301
20 year treasury R20 25.030** 2453.343 221.042** 0.285 0.290
1 year municipal r1 26.365** 2353.177 218.063** 0.165 0.160
5 year municipal r5 25.919** 2471.364 222.231** 0.190 0.196
10 year municipal r10 25.484** 2487.409 223.300** 0.197 0.225
20 year municipal r20 25.137** 2548.941 224.406** 0.194 0.212
5 year corporate RC, 5 23.521** 2208.472 214.130** 0.163 0.179
20 year corporate RC, 20 23.721** 2261.756 216.167** 0.145 0.152
a** 1% critical value5 23.44.
* 5% critical value5 22.87.
wheretis the appropriate tax rate andrtis a representative tax-exempt yield. The table provides the estimates for the various pairwise cointegration regressions relating tax-Table 4. Dickey-Pantula Test Unit Root Test: Tax-Exempt and Taxable Yields
DP1:D3yt5a 1 r1D2yt211m1,t
a** 1% Dickey-Fuller critical value53.44.
* 5% Dickey-Fuller critical value5 22.87.
Table 5. Johansen Cointegration Test Statistics On Unadjusted Yields
Bivariate Yield Series
Likelihood Ratio Statisticsa (H0: No Cointegrating Equation)
r1,R1 8.56
exempt yields and yields on taxable securities.15For the most part, the estimates of the cointegrating vectors are fairly close to (1, 21), indicating that the two yields move roughly in proportion to one another in the long run. Likelihood ratio statistics testing the non-cointegration hypothesis, as developed by Johansen (1988), are also reported. The evidence shows that the non-cointegration hypothesis was rejected, at the 5% level, for combinations of Treasury security yields and municipal yields with maturities of one year. For these instruments, this evidence is in sharp contrast to that found in Table 5. For these short-term securities, there was evidence to reject the non-cointegration hypothesis of tax-adjusted yields, at traditional levels, but not on an unadjusted basis. The evidence for the one-year maturity was consistent with the hypothesis that tax-exempt and taxable yields are cointegrated on a tax-adjusted basis. The adjusted yields, using corporate tax rates, do not wander off aimlessly, but rather have a common factor that acts as an attractor.16
Table 7 reports cointegration results using the highest marginal tax rate for individual income recipients, in place of the highest corporate marginal tax rate series used in Table 6. The table again provides estimates of the cointegrating regressions relating yields on a tax-adjusted basis for similar maturity securities. The slope parameters in Table 7 vary much more than in Table 6, and differ from unity by greater amounts, suggesting that the one-to-one association was generally not met. Moreover, in no case could the non-cointegration hypothesis be rejected at traditional levels of significance. Thus, the evi-dence, unlike that found using corporate tax rates, suggests that taxable yields and tax-exempt yields, grossed-up by the highest marginal tax rate to put them on a before-tax basis, bear no long-run relationship to one another. The highest marginal tax rate for individuals does not appear meaningful in the pricing of the respective securities, regard-less of maturity. This finding hints that individual income tax rates may be regard-less important than corporate tax rates in the relative pricing of taxable and tax-exempt securities. However, to this point, only the highest marginal tax rate has been considered. Next we
15We also estimated cointegrating regressions relating after-tax yields on taxable securities (lnR
t1ln(12
tt)) and unadjusted tax-exempt yields, using the various tax rate measures fort. The conclusions were essentially identical to those reported in Tables 6–8.
16For longer-term (five years or greater to maturity) securities, there is also marginal evidence (10% critical
value) in Table 6 to reject the non-cointegration hypothesis.
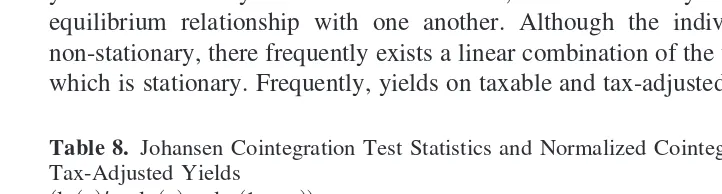
Table 6. Johansen Cointegration Test Statistics and Normalized Cointegrating Coefficients on Tax-Adjusted Yields
~ln~rt!95ln~rt!2ln~12tt!!
Using Corporate Income Tax Rates (tt)
Taxable Yield
Normalized Cointegrating Coefficients
Likelihood Ratio Statisticsa (H0: No Cointegrating Equation)
lnRt lnr9t C
a** 1% critical value, 24.60.
will consider the marginal tax rate of possibly a more representative taxpayer, rather than high-income individuals.
Table 8 considers the relationship between adjusted tax-exempt yields and yields on taxable securities, this time using the Peek and Wilcox (1986) measure of individual marginal tax rates. The slope parameter estimates appear much closer to unity than was found in Table 7. Moreover, the non-cointegration hypothesis was rejected for all pairwise yield combinations of Treasury and municipal securities other than one-year maturity. In sharp contrast to the evidence using the highest individual marginal tax rate, the evidence in Table 8 generally rejected the non-cointegration hypothesis. This evidence suggests that the Peek and Wilcox (1986) measure of effective tax rates appears to be important in determining the long-run equilibrium pricing in the respective markets, especially for longer terms to maturity.
In summary, there is much evidence to suggest that, on a tax-adjusted basis, tax-exempt yields and taxable yields in the United States, when matched by maturity, bear a long-run equilibrium relationship with one another. Although the individual yield series are non-stationary, there frequently exists a linear combination of the two tax-adjusted yields which is stationary. Frequently, yields on taxable and tax-adjusted, tax-exempt securities Table 7. Johansen Cointegration Test Statistics and Normalized Cointegrating Coefficients on Tax-Adjusted Yields
~ln~rt!95ln~rt!2ln~12tt!!
Using Highest Individual Income Tax Rates (tt)
Taxable Yield
Normalized Cointegrating Coefficients
Likelihood Ratio Statisticsa (H0: No Cointegrating Equation)
lnRt lnr9t C
R1 1.000 27686.150 17452.110 16.07
R5 1.000 7.788 220.958 15.27
R10 1.000 5.544 215.973 13.58
R20 1.000 3.098 210.300 12.99
RC, 5 1.000 20.117 21.856 8.87
RC, 20 1.000 0.052 22.346 9.56
a** 1% critical value, 24.60.
* 5% critical value, 19.96.
Table 8. Johansen Cointegration Test Statistics and Normalized Cointegrating Coefficients on Tax-Adjusted Yields
~ln~rt!95ln~rt!2ln~12tt!!
Using the Peek-Wilcox Marginal Tax Rate Series for Individuals (tt)
Taxable Yield
Normalized Cointegrating Coefficients
Likelihood Ratio Statisticsa (H0: No Cointegrating Equation)
lnRt lnrt9 C
a** 1% critical value, 24.60.
appear to have a common factor shaping their time series behavior. The corporate tax rate series appears most important in shaping the very short-end of the maturity spectrum, while the Peek and Wilcox (1986) individual marginal income tax rate appears appropriate for the longer-end of the maturity spectrum. The evidence suggests there may be different effective tax rates for different maturity spectrums. Such evidence is consistent with the market segmentation views of the municipal debt market [see Kidwell and Koch (1983); Buser and Hess (1986); Hein et al. (1995)], but is generally inconsistent with the Miller (1977) or Fama (1977) argument that the corporate tax rate is appropriate regardless of maturity.
Evidence on Maintaining Long-Run Equilibrium: Error Correction Estimates
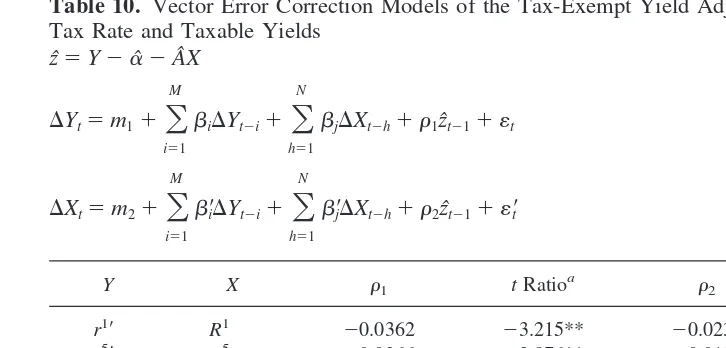
An alternative method for examining the long-run equilibrium relationship between taxable and tax-adjusted, tax-exempt yields is error correction modeling. An advantage of the error correction model is that it allows one to determine how variables are adjusting to maintain long-run equilibrium. Engle and Granger (1987) showed that if a long-run equilibrium exists between two non-stationary variables, then at least one of those variables must be adjusting to maintain that equilibrium. To examine which yield is adjusting, error correction models are estimated for similar maturity taxable yields and grossed-up tax-exempt yields. If there is a long-run equilibrium relationship between two variables, such thatY5aˆ 1Aˆ X1zˆ, then the relationship can be expressed in an error correction framework. The long-run equilibrium equation is estimated with the tax-adjusted, tax-exempt yield as the dependent variable, Y, and the taxable yield as the independent variable, X. With the estimates of disequilibrium, zˆ, in hand, the error correction models can be expressed as:
DYt5m11
O
wheremjis the intercept,zˆt21; (the error correction term) is the previous period’s residual from the regressionY5 aˆ 1Aˆ X1 zˆ, and«tis the white noise residual. Lagged values of DYandDXare included to capture the dynamics of the adjustment process.17
The parameter estimates for the coefficientsr1andr2are of most interest. If eitherr1
or r2 are different from zero, there is evidence of temporal causation in at least one direction and the variables are said to be error correcting. Ifzˆt21is positive, for example, this indicates that either Y is too high, or X is too low, relative to equilibrium. A significantly negative estimate of r1 indicates Y is adjusting (downward) to maintain long-run equilibrium, while a significantly positive estimate of r2 indicates that X is
17Twelve lags were used in estimating the maximum likelihood technique. The Engle and Granger (1987)
adjusting (upward) to maintain equilibrium.18Tables 9 through 11 provide the estimation results for the error correction systems employing the maximum likelihood technique, separately using each of the three different tax rates to adjust the tax-exempt yield. In each table, the adjusted tax-exempt yield is the dependent variable,Y, whileX, the dependent variable, is the taxable yield.19
In Table 9, the tax-exempt yield was adjusted by the corporate tax rate. For all yield pairs, except the 20-year corporate and municipal yield pair, ther1coefficient estimate was negative and significantly different from zero. This indicates the tax-adjusted, tax-exempt yield is generally changing to maintain long-run equilibrium. This is consis-tent with the Wall Street View. A tax rate increase, for example, is associated with a decrease in yields on tax-exempt instruments.
However, the taxable yield in Table 9 was never found to be adjusting significantly to maintain equilibrium. In the one case, wherer2was different from zero, the taxable yield moved in the opposite direction to maintain equilibrium, as indicated by the sign of ther2
coefficient. In order for the taxable yield to adjust toward equilibrium,r2must be positive. These results are consistent with the Wall Street View, but are not consistent with the Miller (1977) framework, which suggests that taxable yields should be adjusting.
Table 10 reports the vector error correction estimates using the highest individual tax rate to adjust the tax-exempt yield. Due to the failure to reject the non-cointegration hypothesis in Table 7, it is surprising that ther1 estimates were generally found to be significantly less than zero. These significant coefficients indicate adjustment of tax-adjusted, tax-exempt yields to maintain equilibrium. Again, in only one case wasr2found
18In Tables 9–11, we would expect thetratio to be negative forr
1if the tax-exempt yield is adjusting to
maintain equilibrium, while we would expect thetratio forr2to be positive if the taxable yield is adjusting to
maintain equilibrium.
19The selection of which variable is the independent or dependent variable is unimportant, as thetratios
remain the same if the selection is reversed.
Table 10. Vector Error Correction Models of the Tax-Exempt Yield Adjusted by the Individual Tax Rate and Taxable Yields
9Indicates that the yield has been adjusted for taxes.
a** 1% student-tcritical value52.58.
to be different from zero. Once again, the sign of this coefficient suggests adjustment in the opposite direction of long-run equilibrium.
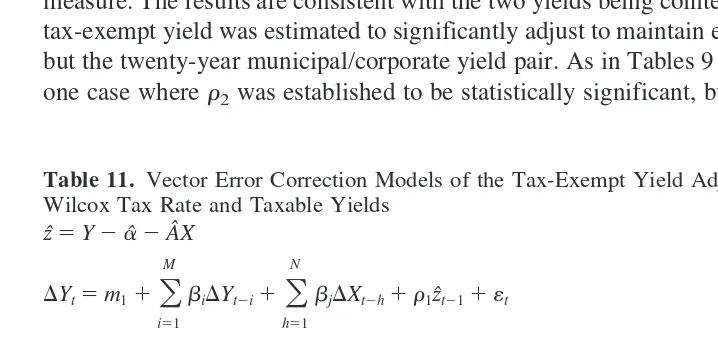
In Table 11, the tax-exempt yield was adjusted by the Peek and Wilcox (1986) tax rate measure. The results are consistent with the two yields being cointegrated. The grossed up tax-exempt yield was estimated to significantly adjust to maintain equilibrium for all pairs but the twenty-year municipal/corporate yield pair. As in Tables 9 and 10, there was only one case wherer2was established to be statistically significant, but again this parameter Table 9. Vector Error Correction Models of the Tax-Exempt Yield Adjusted by the Corporate Tax Rate and Taxable Yields
9Indicates that the yield has been adjusted for taxes.
a**1% student-tcritical value52.58.
* 5% student-tcritical value51.96.
Table 11. Vector Error Correction Models of the Tax-Exempt Yield Adjusted by the Peek-Wilcox Tax Rate and Taxable Yields
zˆ5Y2aˆ2Aˆ X
9Indicates that the yield has been adjusted for taxes.
a** 1% student-tcritical value52.58.
estimate indicates changes in the incorrect direction to maintain the long-run relationship between taxable and tax-exempt interest rates.
The majority of the error correction evidence is consistent with the Wall Street view. In most cases, the tax-adjusted, tax-exempt yield was found to adjust to maintain the long-run relationship between taxable and tax-exempt yields. This evidence is consistent with the view that taxable yields remain stable in the face of tax rate changes, but tax-exempt yields are forced to adjust to maintain equilibrium. On the other hand, the taxable yield was never found to be adjusting to maintain long-run equilibrium.
VI. Conclusion
This paper has provided empirical evidence on the long-run equilibrium relationship between yields on taxable (either Treasury or corporate) and tax-exempt (municipal) securities in the United States with comparable maturities. Three hypotheses pertaining to the long-run equilibrium were developed and tested. It was first hypothesized that taxable and tax-exempt interest rates are not cointegrated with each other. When the effective tax rate contains a unit root, it can be shown that taxable and tax-exempt yields should not be cointegrated if investors are concerned about after-tax returns.
Secondly, it was argued that, on a tax-adjusted basis, arbitrage should keep these yields from drifting far apart. As such, when these yields are put on a tax equivalent basis, they should have a common factor. Finally, we hypothesized the long-run equilibrium is maintained by the adjustment of the taxable yield, rather than the adjustment of the tax-exempt yield. This last hypothesis is developed from the Miller (1977) equilibrium, which indicates that the yield on taxable debt should reflect the tax shield provided by debt, so that changes in tax rates should affect taxable yields, and tax-exempt yields are considered exogenous.
Three different tax rate series and twelve different interest rates series were used to examine these hypotheses. We first confirmed, using a variety of empirical tests, that tax rates and the various yields considered are integrated of the first order. Based on this finding, bivariate cointegration was used to examine the first two hypotheses. We found that when taxes were ignored, taxable and tax-exempt yields, with similar maturities, were not cointegrated. However, when the corporate tax rate was used to calculate tax-adjusted yields, taxable and tax-exempt yields were found to be cointegrated for one-year matu-rities. When the Peek and Wilcox (1986) individual tax rate series was used to adjust tax-exempt yields to make them comparable to taxable yields, the taxable and tax-exempt yields of five, ten, and twenty-year maturities were found to be cointegrated. Thus, there is strong evidence that on a tax-adjusted basis, taxable and tax-exempt yields are cointegrated, while there is little evidence to indicate that the raw taxable and tax-exempt yields are cointegrated.
overwhelm-ing majority of the evidence presented is consistent with the Wall Street view, as outlined in recentThe Wall Street Journal discussions of the impact of tax rate changes on the respective yields. Tax rate changes appear to have a bearing on the behavior of tax-exempt yields, and taxable yields seem to provide the anchor to the system.
The investment implications of these findings are many. First, the evidence is consis-tent with the general belief that taxes matter in the pricing of financial assets. Our evidence is consistent with the assumption that tax rate changes have been frequent and large enough that their influence cannot be ignored empirically. However, the evidence suggests that there may be more than one tax structure (e.g., corporate versus individual) that is relevant, as evidence was found that the corporate tax code was important at the short-end of maturity spectrum, while the individual tax code (other than the maximum statutory rate) was important in pricing longer-term securities. In this vein, the evidence presented is generally consistent with the market segmentation theories of the municipal debt market. The evidence in this paper also suggests that during periods of tax rate changes, the municipal debt market is likely to be the market where the action is, as tax-exempt yields seem to do the adjusting to maintain long-run equilibrium, and taxable yields changes are driven by other outside forces.
The authors wish to thank Paul Evans, Jeb Briley, Tim Koch, Jeff Mercer, Ken Moon, Ray Spudeck, Jonathan Stewart and participants at the Texas Tech finance workshop for comments on an earlier draft of the paper. We also acknowledge the help of Tim Koch and Joe Peek in acquiring data used in this study.
References
Baillie, R. T., and Bollerslev, T. March 1989. Common stochastic trends in a system of exchange rates.Journal of Finance44(1):167–181.
Barro, R. J., and Sahasakul, C. October 1983. Measuring the average marginal tax rate from the individual income tax.Journal of Business56(4):419–452.
Barro, R. J., and Sahasakul, C. October 1986. Average marginal tax rates from social security and the individual income tax.Journal of Business59(4):555–566.
Buser, S. A., and Hess, P. J. December 1986. Empirical determinants of the relative yields on taxable and tax-exempt securities.Journal of Financial Economics17(2):335–355.
Campbell, T. S. February 1980. On the extent of segmentation in the municipal securities market. Journal of Money, Credit, and Banking12(1):71–83.
DeGennaro, R. P., Kunkel, R. A. and Lee, J. November 1994. Modeling international long-term interest rates.Financial Review29(4):577–597.
Dickey, D. A., and Pantula, S. October 1987. Determining the order of differencing in autoregres-sive processes.Journal of Business and Economic Statistics5(4):455–461.
Engle, R. F., and Granger, C. W. J. March 1987. Co-integration and error correction: representation, estimation and testing.Econometrica55(2):251–276.
Fabozzi, F. J. 1996.Bond Markets, Analysis and Strategies(2nd edition). Englewood Cliffs, NJ: Prentice Hall.
Fama, E. F. 1977. A pricing model for the municipal bond market. Unpublished manuscript. University of Chicago.
Graham, J. R. October 1996. Proxies for the corporate marginal tax rate.Journal of Financial Economics42(2):187–221.
Hakkio, C. S., Rush, M., and Schmidt, T. J. August 1996. The marginal income tax rate schedule from 1930 to 1990.Journal of Monetary Economics38(1):117–138.
Hamilton, J. D. 1994.Time Series Analysis. Princeton, NJ: Princeton University Press.
Hein, S. E., Koch, T. W., and MacDonald, S. S. August 1995. The changing role of commercial banks in the municipal securities market.Journal of Money, Credit, and Banking27(3):894–906. Herman, T. Jan. 4, 1993. Bill Clinton leads in yet another election: The municipal bond salesman
of the year.The Wall Street Journal, R6.
Johansen, S. June/September 1988. Statistical analysis of cointegration vectors. Journal of Eco-nomic Dynamics and Control12(2,3):231–254.
Joines, D. H. April 1981. Estimates of effective marginal tax rates on factor incomes.Journal of Business54(2):191–226.
Kidwell, D. S., and Koch, T. W. February 1983. Market segmentation and the term structure of municipal yields.Journal of Money, Credit, and Banking15(1):40–55.
Miller, M. H. May 1977. Debt and taxes.Journal of Finance32(2):261–275.
Mougoue, M. Fall 1992. The term structure of interest rates as a cointegrated system: Empirical evidence from the Eurocurrency market.Journal of Financial Research15(3):285–296. Newey, W. K., and West, K. D. May 1987. A simple positive semi-definite heteroskedasticity and
autocorrelation consistent covariance matrix.Econometrica15(3):703–708.
Peek, J., and Wilcox, J. A. 1986. Tax rates and interest rates on tax-exempt securities.New England Economic Review: 29–41.
Phillips, P. C.B., and Perron, P. June 1988. Testing for a unit root in time series regression. Biometrika75(2):335–346.
Schwert, G. W. July 1987. Effects of model specification on tests for unit root tests in macroeco-nomic data.Journal of Monetary Economics20(1):73–103.
Tourtellotte, B. Nov. 15, 1992. Clintonomics may boost municipal bond market.The Washington Post, H9.
Trzcinka, C. September 1982. The pricing of tax-exempt bonds and the Miller hypothesis.Journal of Finance37(4):907–923.
Trzcinka, C. November 1986. Risk, segmentation, and the municipal term structure. Financial Review: 21(4):501–525.