CHAPTER III
RESEARCH METHOD
The previous chapter has explained the literature related to this research, including reading fiction, reading comprehension, reading comprehension assessment, teaching writing narrative text, writing assessment, and the relationship between reading fiction and writing achievement. Then, this chapter explores some significant parts of the research method. It includes research design, population, setting, and sample, research instruments, data analysis method, data interpretation, and research procedures. It provides a guideline to conduct the research.
3.1 The Research Method
The research is conducted by using a quantitative method in a correlational study. Gay (1987) claims, “A correlation study describes in quantitative terms the degree to which variables are related”. Correlational study is appropriate way to
answer the research question whether there is a correlation between students’ reading comprehension of Indonesian fiction and their writing ability of English narrative texts. Thus, all correlational studies use quantitative method.
“Correlational research involves collecting data in order to determine
whether, and to what degree, a relationship exists between two or more quantitative variables. Degree of relationship is expressed as a correlation coefficient” (Gay, 1987). Two variables will be highly correlated if the correlation
obtained near 00, two variables are not related. Gay (1987) continues, “Correlational studies provide an estimate of just how related two variables are”.
In other word, it cannot infer the cause-effect relationship between two variables. The research method cannot be separated with a research design, it will be discussed then.
3.2 The Research Design
The design of the research is ex-post facto. As Hatch & Farhady (1982) say, “Ex-post facto designs are often used when the researcher does not have control over the selection and manipulation of the independent variable….correlation designs are the most commonly used subset of ex-post facto designs”. Then, Kral (1996) adds:
…We may use the ex-post facto strategy when we wish to investigate the influence of variables like home environment, sex, motivation, intelligent, and parental reading habits. These are characteristics that a subject possesses before the study begins. As researchers, we have no direct control of these variables and can only try to determine their incidence on observed consequence. Although this method lacks control, it is useful in our field because it can supply relevant information for educational decision-making.
There are two quantitative variables includes in this research. They are reading comprehension of Indonesian fiction as variable X and Writing ability of English narrative texts as variable Y. As Gay (1987) explicitly states, “Relationship studies typically investigate a number of variables believed to be related to a major, complex variable such as achievement”. To make it easy to
Figure 3.1 The Research Design
Variable X Variable Y
The design of the research shows the direct relationship between two variables. The design will be applied to population, setting, and sample of research as explained then.
3.3 The Population, Setting, and Sample of Research
3.3.1 Population and Setting
“A population is the largest class to which we can generalize the results of
an investigation based on a subclass. The population of interest (or target population) will vary in type and magnitude depending on the aims and circumstances of each different study or investigation” (Woods et al., 1985).
Arikunto (1993) argues that a population is the entire subjects of the research. When a researcher wants to investigate all the elements, which is the area of the research, the research is as population research. “The description of the population
should indicate its size and major characteristics, such as age, grade level, ability level, and socioeconomic status” (Gay, 1987). The population and setting of the
high school. Moreover, they are form different socioeconomic status includes form low to high status.
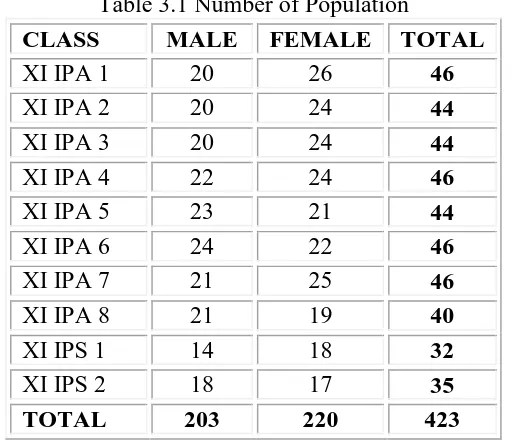
the researcher, the group to which she or he would like the result of the study to be generalizable”. Therefore, they were deserved to be researched in this study. To make it clear, the number of population is shown in the following table:
Table 3.1 Number of Population researcher chose some samples through appropriate sampling techniques as the representative of the population. As Fraenkle and Wallen (1993) state that sample is “the group on which information is obtained, preferably selected in such a way that the sample represents the larger group from which they were selected”. It is
explored then.
3.3.2 Sampling and Sample
Random sampling is used to take the sample. “Random sampling is the best single way to obtain a representative sample” (Gay, 1987). It is used by
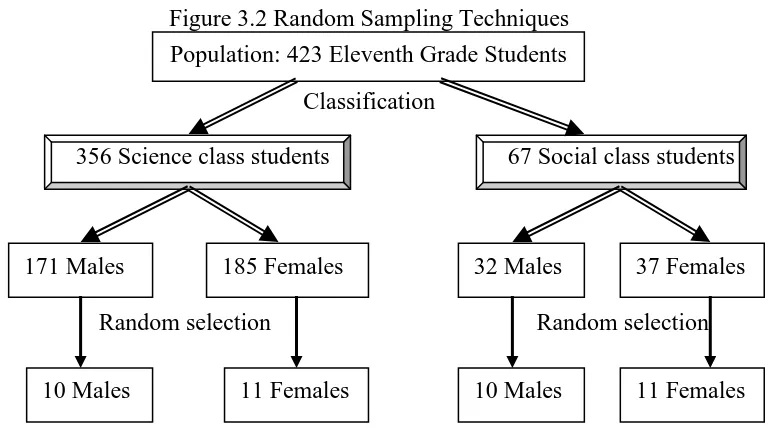
major and gender. The sample of this research included 42 students of all classes. 21 students were the representative of science class that consist of eleven girls and ten boys and the other half were the representative of social class that also consist of eleven girls and ten boys. To make it easier to comprehend, it is shown in the following figure:
Figure 3.2 Random Sampling Techniques
Classification
356 Science class students 67 Social class students
Random selection Random selection
It is in line with Gay’s (1987) opinion that a minimum of 30 subjects is
generally recommended for a correlational studies.
The sample, then, is given some instruments to get a data as described below.
3.4 The Research Instrument
The research instrument is the method used in gaining the data. The instrument or data collection method in this research is test. Test is defined as a means of measuring the knowledge, skill of an individual or group (Gay, 1987).
Population: 423 Eleventh Grade Students
171 Males 185 Females 32 Males 37 Females
There are two kinds of tests used in this study: a reading comprehension test and a writing narrative test.
Reading comprehension test has a function to know the comprehension of the students in reading Indonesian fiction. The test had two parts; they are the story written in Indonesian story under the title “Kisah Seorang Kakak dan Adik” and questions are in English. The story consists of 1286 words. The story was chosen since it was considered more appropriate to the almost entire population and sample. It also included into the inspiration story that gives indirect lesson to the readers. Then, the students had to answer the 20 open-ended questions in English in 60 minutes (see Appendix 3).
Meanwhile, writing test was to get the data about writing ability of English narrative text. The test was about asking students to writes an essay in narrative, since story is commonly in the form of narrative. The students were free to decide their own titles of essay. They had to write it in 75 minutes (see Appendix 4).
3.4.1 Validity and Reliability of the Instruments
“Validity refers to the appropriateness, meaningfulness, and usefulness of
the inferences a researcher makes” based on the data (Fraenkle and Wallen, 1990).
Moreover, Weir (1990) defines validity as “what intended to measure”. It is in line
with Gay’s (1987) opinion that validity means “the degree to which a test
measures what it is supposed to measure”. Mean while, reliability refers to “the
appropriate with Gay’s (1987) opinion that reliability means “the degree to which
a test consistently measures whatever it measures”.
The validity and reliability of the instruments were focused on searching quality research through some ways. First, all instruments were consulted to the writer’s advisors to get content validity, as Gay (1987) clearly states, “Content
validity is determined by expert judgment”.
Second, the instruments were also tried out first to know its validity and its reliability to some students in other school which has the same characteristics with the population. The result of trying out indicated that all questions in reading comprehension test and writing test could be comprehended by the students. No questions asked by the students about them. After that, the range of students’
scores are quite wide. “If the students have a wide range of ability, test reliability
will increase” (Hatch and Farhady, 1982).
Fourth, direction for scoring was used in evaluating of the result of the test (See Appendix 1). As Gay (1987) states, “Specification of condition of
administration, directions for scoring, and guideline of interpretation are important characteristics of standardize test”.
Fifth, the results of test were evaluated by two evaluators and by the researcher himself on difference time to get reliability of the test. As Silverman (2005) explicitly states, “Reliability refers to the degree of consistency with which
Sixth, reading comprehension test had many items of questions to make more reliable. There were 20 questions of reading comprehension test of Indonesian fiction. As Hughes (1991) confirms, “the more items that you have on
test, the more reliable test will be”.
Seventh, reading comprehension test of Indonesian fiction and writing test had provided clear and explicit instruction to get the reliability of the instruments. It is in line with Hughes’ (1991) argument that one of the ways to get reliability
instrument is providing clear and explicit instructions both written and oral instructions”.
Eighth, it is provided a detailed scoring key of the test to get reliable data (Hughes, 1991). Both reading comprehension test and writing test had scoring system to make data more objective. A detailed scoring system of reading comprehension test can be seen in Appendix 5 and a detailed scoring key of reading comprehension test can be seen in Appendix 6. Meanwhile, a detailed scoring system of writing test is shown in appendix 1 and there is no scoring key of writing test since students were asked to write a narrative text in the free title.
Last, tester and scorers did not recognize the students to avoid the subjective scoring. Since tester is the researcher himself who does not teach at the school or setting of the research. Hughes (1991) states, “Scorers inevitably have
expectations of candidates that they know, except in purely objective testing, this will affect the way tat they score”. “Test objectivity means that an individual’s
Therefore, it can be inferred that the instruments that are used in this research are valid and reliable. Especially for result of trying out, it can be performed as follows.
3.4.2 Try out Result
Trying out has function to validate the instruments of the research. It was done to some students in another setting that was SMA Kartika Siliwangi Bandung. The school is also included the favorite private school in Bandung. It was chosen because it has the same characteristics with the population and setting of the research. There were also has social and science class that consist of male and female students. XI IPS 2 and XI IPA 1 class are taken randomly be tested as trying out the instruments. There were 38 students of XI IPS 2 class but 31 students presented at the time (see Appendix 7), and there were 29 students of XI IPA 1 but 26 students presented at the time (see Appendix 8). The result of trying out can be explained one by one as follows:
3.4.2.1. The Try out Result of Reading Comprehension Test
The try out result indicates that the students can comprehend all of the text of Indonesian fiction and the questions in reading comprehension test. No questions asked by the students about them. The answers of the students are almost different among them since the questions are in the simple open-ended answer. Time limit of the test was enough for the students. After that, the range of students’ scores are quite wide from 40 to 98. “If the students have a wide range
there is no changing of this instrument at all. The result of reading test try out and its descriptive statistic can be seen in Appendix 9. The score validity of the result try out of reading Indonesian fiction test is shown in appendix 10.
3.4.2.2. The Try out Result of Writing Narrative Test
The try out result shows that the students can comprehend the instruction in writing test, since there is only an instruction to write free title of narrative text. No questions asked by the students about them. Time limit of the test was 60 minutes, it is not enough for the students. Therefore, the time for writing test should be added become 75 minutes. After that, the range of students’ scores are
quite wide from 46 to 83. “If the Ss have a wide range of ability, test reliability will increase” (Hatch and Farhady, 1982). The result of writing test try out and its
descriptive statistic can be seen in Appendix 11 and 12.
Then, those instruments produce the relevant data and it was analyzed carefully as the following way.
3.5 The Data Analysis
The data is analyzed by using statistical analyses the Pearson Product Moment in order to measure the strength of the relationship. Gay (1987) explains, “The most commonly used technique is the product moment correlation
coefficient, usually refer to Person r, which is appropriate when both variables o b correlated are expressed as ratio data or interval data”. This technique included
The formula for the correlation coefficient using the raw data based on Hatch & Farhady (1982), Sudijono (1995), Emra (1998), is presented as follows:
Explanation:
a. The number of subjects, N
b. The sum of each subjects X score times the Y score, summation XY c. The sum of the X scores, summation X
d. The sum of the Y scores, summation Y
e. The sum of the squared X scores, summation X squared f. The sum of the squared Y scores, summation Y squared
The value of the observed r is consulted to the value of the critical r (r table). In other words, the result of correlation coefficients between X and Y is consulted to Pearson Product moment table on the level of significant 5%.
Furthermore, all data are also analyzed by using descriptive statistic such as mean, median, mode, range, standard deviation, and variance in order to describe data more detail.
After the data is analyzed, the researcher can draw the interpretation as follows requirements.
3.6 The Data Interpretation
The data can be interpreted after the value of the observed r is consulted to the value of the critical r (r table). In other words, the result of correlation coefficients between X and Y is consulted to Pearson Product moment table on the level of significant 5%. If the observed r is bigger than the critical r at he significant level of 5%, it means that there is positive correlation between two variables. Vice versa, if the observed r is lower than the critical r at he significant level of 5%, it means the there is no correlation between two variables. It is explained by Gay (1987):
Interpretation of a correlation coefficient depends upon how it is to be used. In other words, how large it needs to be in order to be useful depends upon the purpose for which it was computed. In a study designed to explore or to test hypothesized relationship, a correlation coefficient is interpreted in terms of its statistical significant.
Then, the interpretation also tests the hypothesis by using the following criteria:
a. Ho is rejected and Hi is accepted if the observed r is bigger than the critical r at the significant level of 5%, it means that there is positive correlation between variable X and Y.
Gay (1987) proposes more explanation in interpreting the data as the following criteria:
a. If the coefficient is near +1.00, the variables are positively related b. If the coefficient is near .00, the variables are not related
c. If the coefficient is near -1.00, the variables are inversely related
More detail interpretation is stated by Emra (1998) in the following Figure:
Figure 3.3 The Interpretation of Correlation Coefficient
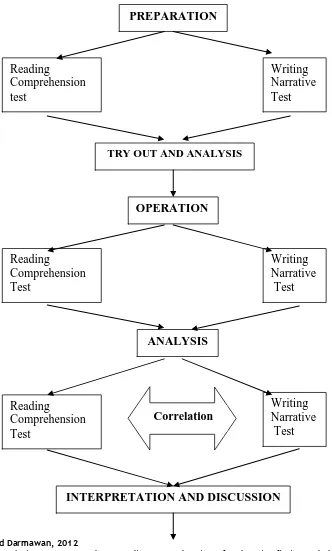
3.7 The Research Procedures
There are some procedures of the research that were followed: A. Preparation
a. Preparing the reading test; b. Trying the reading test out;
c. Preparing the English writing test; d. Trying the English writing test out; e. Analyzing the result of trying out. B. Operation
a. Conducting reading test to the subjects; b. Conducting writing test to the subject; C. Analysis
a. Analyzing the reading test achievement; b. Analyzing the writing test achievement;
c. Correlating the reading marks and the writing marks; d. Interpreting the result of relationship and discussing it; e. Concluding and giving suggestions or recommendations.
Based on the explanation above, it can be concluded that this chapter describes some important parts of research method. It includes research method, research design, setting, population and sample, data collection method, data analysis, data interpretation, and research procedures. Then, the result of the study will be explored detail in the next chapter. (Chapter IV Research Finding).