Assessment of completeness and positional accuracy of linear features in Volunteered
Geographic Information (VGI)
M. Eshghi a, *, A. A. Alesheikh b
a MSc. GIS Student, Department of GIS, Faculty of Geodesy and Geomatics Engineering, K.N.Toosi University of Technology, Tehran, Iran – [email protected], [email protected]
b Professor, Department of GIS, Faculty of Geodesy and Geomatics Engineering, K.N.Toosi University of Technology, Tehran, Iran – [email protected]
KEY WORDS: Volunteered Geographical Information (VGI), Data Quality, Quality Assessment, Positional Accuracy,
completeness
ABSTRACT:
Recent advances in spatial data collection technologies and online services dramatically increase the contribution of ordinary people to produce, share, and use geographic information. Collecting spatial data as well as disseminating them on the internet by citizens has led to a huge source of spatial data termed as Volunteered Geographic Information (VGI) by Mike Goodchild. Although, VGI has produced previously unavailable data assets, and enriched existing ones. But its quality can be highly variable and challengeable. This presents several challenges to potential end users who are concerned about the validation and the quality assurance of the data which are collected. Almost, all the existing researches are based on how to find accurate VGI data from existing VGI data which consist of a) comparing the VGI data with the accurate official data, or b) in cases that there is no access to correct data; therefore, looking for an alternative way to determine the quality of VGI data is essential, and so forth. In this paper it has been attempt to develop a useful method to reach this goal. In this process, the positional accuracy of linear feature of Iran, Tehran OSM data have been analyzed.
* Corresponding author
1. INTRODUCTION
In the past, geographic technologies and geo-data had been a closed shop affair with near-monopolies dominating the geo-domain, making it an expensive and exclusive business. New techniques are being used, and new terms have been invented as well as entered the lexicon such as: mash-ups, crowdsourcing, Neogeography, and geostack through the internet. The concept of citizens as sensors is becoming broadly utilized as collection-enabling technologies are widely adopted in consumer devices. As a consequence, the term crowdsourcing is generic, and describes an array of different activities carried out by people in an active (e.g. filling out a survey) or passive (e.g. information mined from Twitter) sense. Types of crowdsourcing range from highly organized methods of harnessing the collective power of the crowd, for example Amazon’s Mechanical Turk (Kittur, et al., 2008) and other monetary reward based schemes (Horton and Chilton, 2010), to volunteered geographic information (VGI) (Haklay and Weber, 2008) such as field open up with increased availability of geographic data through the likes of Google and Microsoft, including geo-data that is genuinely free and open through projects like OpenStreetMap (O’Reilly Web 2.0, 2009).
Data collected by volunteers is no longer confined to the desktop, as mobile technology and smartphone capabilities allow for real-time acquisition of geolocated data. Mobiles also enable real-time sharing of the information, and analysis of the captured data. These location-based tasking activities have been extensively utilized in ecology – e.g. iSpot1 – which uses participant experts, and ratings system to identify wildlife through location-tagged photography. The use of passive crowdsourcing in location-based tasks has been seen in Rackham, 2008). Quality is a major concern as it determines the limits of use for any dataset, and it is key in putting GIS products into an understandable form. (Paradis & Beard, 1994). As identified by Van Oort (Van Oort , 2006), spatial data quality has been an increasing concern due to two reasons, (1) the emergence of Geographical Information Systems (GIS) in the 1960s, and (2) from the 1970s onwards, a strong increase of available spatial data from satellites. He also states that the number of users from Nonspatial disciplines have grown due to the large-scale adoption of GIS. This is certainly the case for Volunteered Geographical Information (VGI) and Neogeography applications. The quality of geographic data can be assessed against both subjective and quantitative quality elements. Based on the ISO standards for the quality principles of Geographic information, Coote and Rackham (Coote and Rackham, 2008) outline how both these quality elements can be assessed: Subjective elements as Purpose, Usage, and Lineage; Quantitative elements as Positional accuracy, temporal accuracy, thematic accuracy, and Completeness as well as Logical consistency.
In the next chapters, it is done as follows. In the chapter 2 which is named material and method, first a historical background of what have been done so far is shortly discussed. Then, a method for analysing and improving positional accuracy for analysing Tehran OSM data is used. In the chapter
3, the method have been implemented, the results are examined. Lastly, the chapter 4 is assigned to conclusion.
2. MATERIAL AND METHODS
In this paper, we focused on Positional accuracy, and attempted to check this out while VGI data have been entering, or uploading by users. So as to reach this goal, first, it is needed to check out what have been done so far. Several research studies have analysed the quality of OSM dataset. One of the popular and classical approaches used to assess the overall quality of VGI dataset is to compare VGI to an authoritative dataset of the same area which are the source data and acts as testing data. These comparisons used different measurments, such as the length of the features or the difference between the attributes values. These analyses have been done in different countries such as England (Haklay et al., 2010), France (Girre and Touya, 2010), and Germany (Ludwig et al., 2011). In this paper, it is done for the case study of Iran, Tehran in which it is tried to improve the algorithm which is used so.
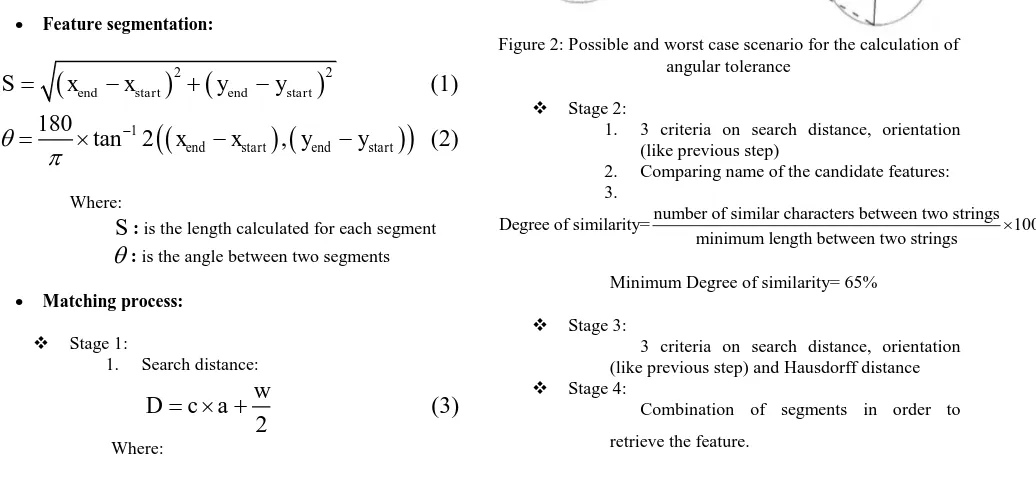
2.1 A five steps so as to matching data
Separating data having analogous data in official data-sets and those that have not any.
Figure 1: Separating matched and not matched features
In this case the reference data are the ones which are produced by the organizations and the VGI maps is the OSM data, both
S
: is the length calculated for each segment
: is the angle between two segments Matching process: multipath rejection or bad signal reception when mapping urban canyons, cases where dual carriageway motorways are represented as a single line in one dataset, reduced satellite imagery accuracy in rural areas, and digitization errors in VGI.
a
: is the assumed GPS accuracy,considered as 10 and 15 meters for urban and rural areas respectively.
w
: is an assumption of the reference road width based on the road type and can be adjusted to other reference datasets characteristics.Figure 2: Possible and worst case scenario for the calculation of angular tolerance
Stage 2:
1. 3 criteria on search distance, orientation (like previous step)
2. Comparing name of the candidate features: 3.
number of similar characters between two strings
Degree of similarity= 100
minimum length between two strings
Minimum Degree of similarity= 65%
Stage 3:
3 criteria on search distance, orientation (like previous step) and Hausdorff distance
Stage 4:
Combination of segments in order to
retrieve the feature.
Stage 5:
1. 3 criteria on search distance, orientation and length
2. Implement on VGI Data
Stage 6:
Calculating the completeness of Data
After distinguishing the matched and unmatched data we need to access the geometric precision for matched data.
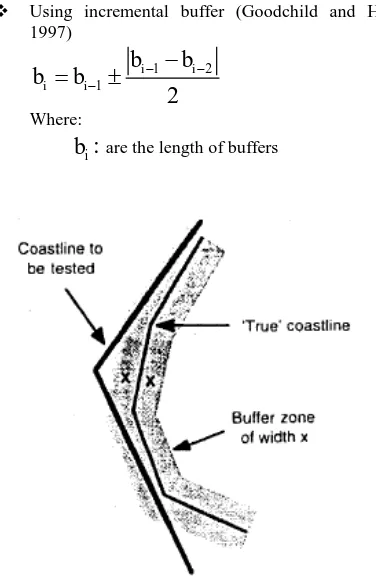
2.2 Calculating Geometric Precision
Using incremental buffer (Goodchild and Hunter, 1997)
1 2 1
2
i i i i
b
b
b
b
(5)
Where:
i
b :
are the length of buffersFigure 3: incremental buffer
3. IMPLEMENTING AND RESULTS
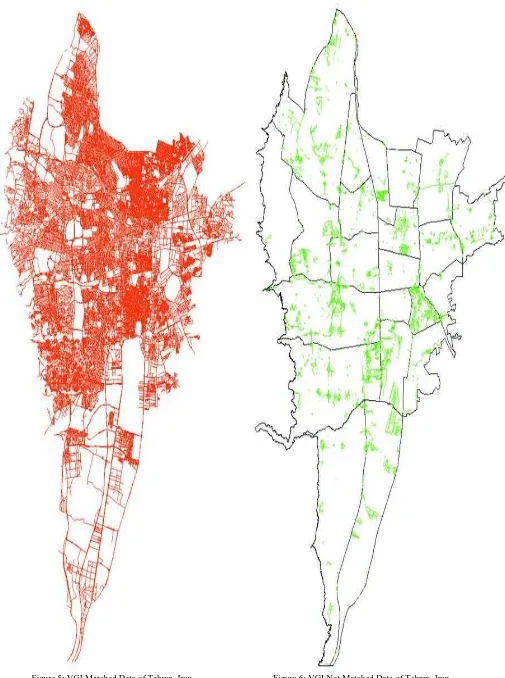
First the algorithm applied to the source and VGI data (in this case OSM data). Then, the matched and unmatched data are distinguished and the accuracy of VGI data has computed. The result are shown in figures 4, 5, 6, and 7, and tables 8 and 9 for the accuracy.
Figure 4: Reference Data of Tehran, Iran
Figure 5: VGI Matched Data of Tehran, Iran Figure 6: VGI Not Matched Data of Tehran, Iran
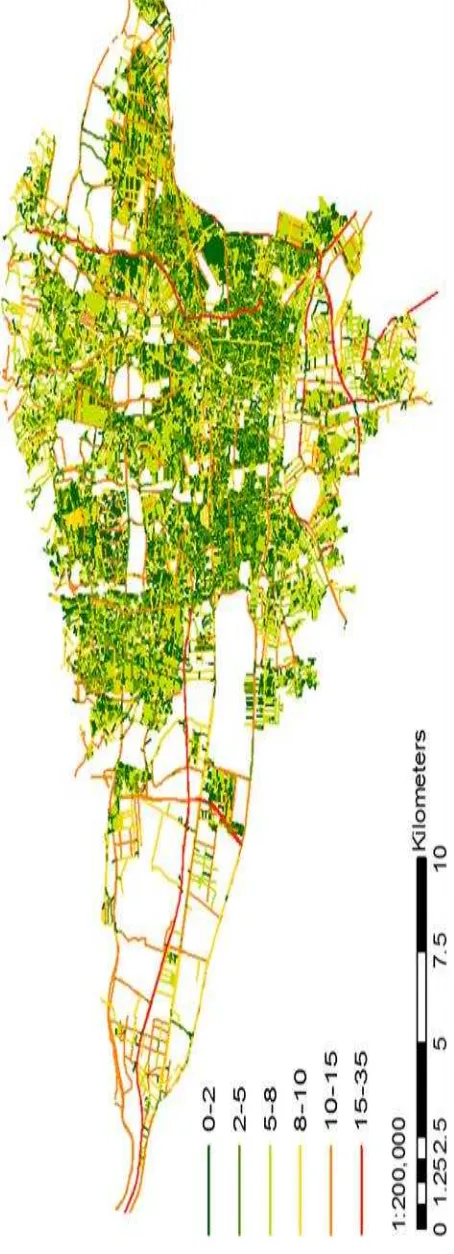
Figure 7: Geometric Precision Map for Matched VGI Data of Tehran, Iran
Data Net length Matched data Unmatched data Length Percent Length Percent
VGI 8389648 6865611 81.83% 152403
7 18.16%
Table 8: The Results Matching of Matched VGI Data of Tehran, Iran
Categories Length of features
< 2 1326665.2
2 < and <5 1606612.48
5 < and <8 1876284.89
8 < and <10 1289423.67
10 < and <15 1155880.99
Others 205517.83
Table 9: The Results of Geometric Accuracy
4. CONCLUSION
Different advantages of Volunteered Geographic Information (VGI) such as ease of accessibility, the capability of quick updating, and correcting potential mistakes by its users, have resulted in fast growth and increasing use of this new type of spatial data. However, since the majority of contributors to VGI are non-experts in geography or GIScience, there is no control over the production of data, and thus the quality of VGI data is always prone to suspicion. As a result, since the creation of VGI, its quality has been its greatest limit and the subject of various research. In this paper, we have tried to assess the quality of linear VGI features in Tehran, Iran, by comparing them with reference data.
The proposed method consists of three main phases: Matching between VGI and reference data, assessing data completeness, assessing positional accuracy. The fact that with minor changes in the data matching phase, it could be applied to different areas and datasets. Moreover, considering data completeness, leads to a more comprehensive analysis in comparison to previous research about VGI data quality in Iran.
First, using a five-step algorithm, VGI and reference corresponding (matching) features are identified. The first four steps of this algorithm are applied on the VGI dataset and the fifth step is applied on the reference dataset. In the first three steps, using a combination of geometric and thematic constraints applied on segments (the distance between two consecutive vertex of a line), matching segments are identified. In the fourth stage, the initial features are reconstructed from segments, in order to identify potential errors resulting from previous stages. In the fifth step, by imposing constraints on the reference data, any feature that has not been studied so far, is checked. By data matching phase being finished, all reference and VGI features are classified into two categories: with match and without match so that in the next phases, quality analysis is applied on them. Based on the results of this phase, approximately 82% of VGI data have a match in the reference dataset.
In the second phase, geometric accuracy of matched data is calculated. The result show that the precision of data less than 5 which is suitable is 256 percent of the matched data.
REFERENCES
Antoniou, V.; Morley, J. and Haklay, M., 2010b. Web 2.0 Geotagged Photos: Assessing the spatial dimension of the phenomenon. Geomatica, 64(1):333-340.
Brassel, K., Bucher, F., Stephan, E.M and Vckovski, A., 1995. Completeness. In: Guptill, S.C. and Morrison, J.L. (eds.), Elements of spatial data quality. International Cartographic Association, Tokyo: Elsevier Science, pp. 81-108.
Coote Andrew, and Les Rackham. 2008. Neogeographic Data Quality is it an issue? Paper presented at 2008 AGI conference. Stratford upon Avon, September 23, 2008.
Goodchild, M. F., & Hunter, G. J., 1997. A simple positional accuracy measure for linear features. International Journal of Geographical Information Science, 11(3), 299-306.
Girres, J.-F., Touya, G., 2010. Quality Assessment of the French OpenStreetMap Dataset. Transactions in GIS, 14(4), pp. 435–59.
Haklay M Weber P (2008). Openstreetmap: User-generated street maps. Pervasive Computing, IEEE, 7(4): 12-18.
Haklay, M., 2010a. How good is OpenStreetMap information? A comparative study of OpenStreetMap and Ordnance Survey datasets for London and the rest of England, In Environment and Planning, 37(4):682-703.
Horton JJ Chilton LB (2010). The labor economics of paid crowdsourcing. In Proceedings of the 11th ACM conference on Electronic commerce, p 209-218.
Haklay, M., Basiouka, S., Antoniou, V., Ather, A., 2010. How Many Volunteers Does it Take to Map an Area Well? The Validity of Linus’ Law to Volunteered Geographic Information. The Cartographic Journal, 47(4), pp. 315–22.
Koukoletsos, T, 2012. A Framework for Quality Evaluation of VGI linear datasets. PhD thesis, University College London, UK.
Kittur A Chi E H Suh B (2008). Crowdsourcing user studies with Mechanical Turk. In Proceedings of the SIGCHI conference on human factors in computing systems. P 453456.
Ludwig, I., Voss, A., Krause-Traudes, M., 2011. A Comparison of the Street Networks of Navteq and OSM in Germany. Advancing Geoinformation Science for a Changing World. Springer Berlin Heidelberg, pp. 65–84.
Paradis J, Beard M K 1994 Visualisation of spatial data quality for the decision-maker: a data quality filter. Journal of the Urban and Regional Information Systems Association 6: 25–34
Tim O'Reilly and John Battelle ,Oct. 2009: answer the question of "What's next for Web 2.0?" in Web Squared: Web 2.0 Five Years On. http://www.oreilly.com/pub/a/web2/archive/what-is-web 20.html, 2009
Van Oort, PAJ, 2006, Spatial data quality: from description to application, PhD Thesis, Wageningen University, NL, 132 p.
Zielstra, D.; Hochmair, H.; Neis, P., 2013. Assessing the Effect of Data Imports on the Completeness of OpenStreetMap – A United States Case Study, Transactions in GIS, 17.3: 315-334.