HOW MUCH CARBON IS STORED IN DESERTS? AN APPROACH FOR THE CHILEAN
ATACAMA DESERT USING LANDSAT-8 PRODUCTS
H.J. Hernández a, *, T. Acuña a, P. Reyes b, M. Torres b, E. Figueroa c
a
Geomatics and Landscape Ecology Lab, Forestry and Nature Conservation Faculty, Santa Rosa 11315, Santiago, Chile - [email protected], [email protected]
b
Centro de Economía de los Recursos Naturales, Facultad de Economía de la Universidad de Chile - [email protected], [email protected]
c
Departamento de Economía, Facultad de Economía de la Universidad de Chile - [email protected]
Commission VIII, WG VIII/8
KEY WORDS: SAVI, EVI, above-ground biomass, random forest
ABSTRACT:
The Atacama Desert in northern Chile is known as the driest place on Earth, with an average rainfall of about 15 mm per year. Despite these conditions, it contains a rich variety of flora with hundreds of species characterised by their extraordinary ability to adapt to this extreme environment. These biotic components have a direct link to important ecosystem services, especially those related to carbon storage and sequestration. No quantitative assessment is currently available for these services and the role of the desert in this matter remains unclear. We propose an approach to estimate above-ground biomass (AGB) using Landsat-8 data, which we tested in the Taparacá region, located in the northern section of the desert. To calibrate and validate the models, we used field data from 86 plots and several spectral indexes (NDVI, EVI and SAVI) obtained from the provisional Landsat-8 Surface-reflectance products. We applied randomised branch sampling and allometry principles (non-destructive methods) to collect biomass samples for all plant biological types: wetlands, steppes, shrubs and trees. All samples were dried in an oven until they reached constant weight and the final values were used to extrapolate dry matter content (AGB) to each plot in terms of kg m-2. We used all available scenes from September 2014 to August 2015 to calculate the maximum, minimum and average value for each index in each pixel within this period. For modeling, we used the method based on classification and regression trees called random forest (RF), available in the statistical software R-Project. The explained variance obtained by the RF algorithm was around 80-85%, and it improved when a wetland vector layer was used as the predictive factor in the model to reach the range 85-90%. The mean error was 1.45 kg m-2 of dry matter. The best model was obtained using the maximum and mean values of SAVI and EVI indexes. We were able to estimate total biomass storage of around 8 million tons (~ 4 million tons of C) for the whole region.
* Corresponding author
1. INTRODUCTION
The Atacama Desert in northern Chile has been described as the driest place on earth (Lettau, 1978). Despite these conditions, it contains nearly 550 species of vascular plants representing 225 genera and 80 families (Anderson et al., 1990). The most diverse families are the Asteraceae, Nolanaceae, Cactaceae, Boraginaceae, and Apiaceae (Aronson, 1990; Benoit-C, 1989). These species of flora are characterised by their extraordinary ability to adapt to this extreme environment. These biotic components have a direct link to important ecosystem services, particularly those related to carbon storage and sequestration. Deserts can provide benefits that can meet the local inhabitants’ demands (De Groot et al., 2012). These benefits include water, food supply, medicine from plants, carbon storage and sequestration and some raw materials. However, there are few studies about these services and how can they be quantified (Bidak et al, 2015). No quantitative assessment is currently available for these services and the role of the Atacama desert in this matter remains unclear. Taking into consideration the described satiation, we propose an approach to estimate above- ground biomass (AGB) using Landsat-8 data in the northern values below 5 mm are not uncommon. Most of this amount is due to drizzle from coastal stratus and very unusual rainfall soil and tree formations (“queñoa” and “tamarugo”). A total of The International Archives of the Photogrammetry, Remote Sensing and Spatial Information Sciences, Volume XLI-B8, 2016
XXIII ISPRS Congress, 12–19 July 2016, Prague, Czech Republic
This contribution has been peer-reviewed.
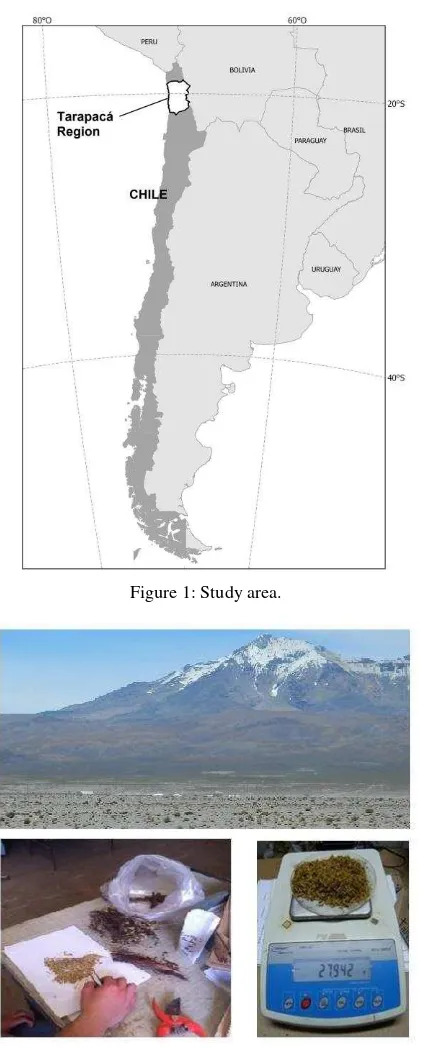
86 samples were registered using concentric circular plots. Trees, shrubs and herbs were counted and measured in rings with 10 m, 5 m and 1 m radii for each plot, respectively. Individual biomass values were obtained by using allometry principles and randomised branch sampling (non-destructive methods) to collect biomass samples for all plant biological types using individuals of mean size: wetlands, steppes, shrubs and trees (Gregoire et al., 1995). All samples were dried in an oven until they reached constant weight and the final values were used to extrapolate AGB to each plot in terms of kg m-2 (Figure 2). Biomass values in terms of kg m-1 were obtained by extrapolating biomass branch samples to full individuals and from individuals to plots.
Figure 1: Study area.
Figure 2: Biomass sample processing.
2.3 Landsat Data and Pre-processing
We considered all available scenes, path 001-002 and row 073-075 (WRS), from September 2014 to August 2015 of provisional Landsat-8 Surface-reflectance products and downloaded NDVI, EVI and SAVI spectral indexes (USGS, 2015). Additionally, we used MOD13 NDVI and EVI products (MODIS-TERRA), 250 m resolution, for the same period of time.
For all indexes we calculated the maximum, minimum and average value for each index in each pixel within this period. Using coordinates from each plot, we extracted all indexed values from both sensors.
2.4 Ancillary data
We also gathered some available ancillary data that provided additional explanation power for the biomass (Table 1). All variables were re-sampled to 30 m resolution.
Variable Source
Precipitation (mm) Worldclim Temperature (oC) Worldclim
Elevation ASTER GDEM
Slope ASTER GDEM
Vegetation types Luebert & Pliscoff (2006)
Table 1. Ancillary data.
3. METHODS
3.1 Modelling approach
We used the method based on classification and regression trees called random forest (RF), available in the statistical software R-Project. This algorithm, proposed by Breiman (2001), constructs a classification or regression tree using a process called bagging. RF calculates the relevance of predictor variables by assigning a score that depends on the changes in the error when the values of this variable are permuted (%IncMSE) and the increase in error when each variable is removed (IncNodePurity). If the effect is larger, the variable is assigned greater importance (Reif et al., 2006).
Considering this approach, AGB of each plot was modelled using all spectral indexes (Landsat and MODIS) and ancillary data (Table 1) as predictors.
4. RESULTS
Figure 3 shows a graph of the variance of AGB per vegetation type. It is noted that, on average, deserts and salt flats have minimum biomass values (~ 0). By contrast, the wetland formation “Bofedal-Pajonal” type (BOPA) has the highest value (0.65 kg m-2), followed by Queñoal, a tree-dominated vegetation type that presents the greatest variance between samples.
Figure 4 shows the importance of each variable obtained by running the initial RF algorithm. Letter “L” is used to indicate The International Archives of the Photogrammetry, Remote Sensing and Spatial Information Sciences, Volume XLI-B8, 2016
XXIII ISPRS Congress, 12–19 July 2016, Prague, Czech Republic
This contribution has been peer-reviewed.
Landsat products, while “Mo” is reserved for MODIS ones. “Max”, “Min” and “Mean” are used to indicate maximum, minimum and mean values in the period.
Figure 3: Boxplots of AGB in each vegetation type or land cover. Bofedal, BOPA and Salar are different kind of wetlands;
Desierto means bear soil. Matorral, DETO, QUPA and Tolar are types of shrubland. Pajonal is a type of grassland; Queñoal
and Tamarugo are vegetation dominated by trees.
Figure 4. RF IncNodePurity indicates the amount the error increase following the removal of each variable.
Figure 5. Histogram of the selected RF model residuals.
In a second RF model we only used the first five variables according to the IncNodePrurity index:
Vegas : Binary raster identifying wetlands LMaxSavi : Landsat-8 SAVI maximum for the period. LMaxEvi : Landsat-8 EVI maximum for the period. LMeanSavi : Landsat-8 SAVI average for the period.
And the final selected RF model is:
AGB=1+Vegas+LMaxSavi+LMaxEvi+LMeanEvi+LMeanSavi+ϵ
This model explains 87.09% of the variance of the data and exhibited a RMSE of 1.4529 kg m-2 (bias 0.0191). Figure 5 shows how the residuals (difference between observed and predicted) are concentrated in the centre of the histogram, indicating a non-biased model fit.
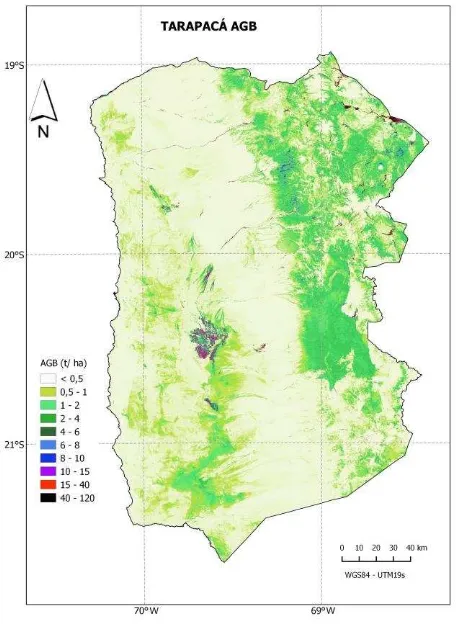
By using the final RF model we produced a predictive AGB for the complete Tarapacá Region (Figure 6). This product was used to estimate a total AGB accumulation of nearly 5.5 million tons.
Finally, by using the TESSA approach (Toolkit for Ecosystem Service Site-Based Assessment - http://tessa.tools/) we were able to estimate underground biomass using AGB values as predictors for each vegetation class. Final estimations are presented in Table 2.
Component Region Total (ton)
AGB 5,511,960 (67.7%)
BGB 2,634,131 (32.3%)
TOTAL 8,146,091 (100%)
Table 2.AGB and BGB estimation for Tarapacá Region.
Figure 6. Predicted ABG for the whole Tarapacá Region. The International Archives of the Photogrammetry, Remote Sensing and Spatial Information Sciences, Volume XLI-B8, 2016
XXIII ISPRS Congress, 12–19 July 2016, Prague, Czech Republic
This contribution has been peer-reviewed.
5. CONCLUSIONS
We developed a method to quantify the accumulated AGB in a section of Atacama Desert, in the Tarapacá Region. The absence of reference data made it necessary to collect new field data. The results indicate that the greatest accumulation of biomass is, as expected, in the upper area of the region. In particular, it draws attention to the elevated accumulation in the highland marshes (wetlands) and surrounding vegetation. These systems have an important role in storing and filtering water in high altitude environments, mainly by the type of rhizomatous vegetation that coexists with the aquatic grasslands that form layers of organic matter in constant aerobic decomposition, forming a mattress of layers that enable water purification. Overall, it may be said that this region, with its 4,222,580 ha, has accumulated a total biomass of around 8 million tons, i.e., about four million tons of C. These results can be incorporated into further assessments of ecological services of the desert.
REFERENCES
Anderson, E. F., M. Bonilla-F., A. E. Hoffmann-J., and N. P. Taylor. 1990. Succulent plant conservation studies and training
in Chile. World Wildlife Fund-U.S., Washington, D.C.
Aronson, J. 1990. Desert plants of use and charm from northern Chile. Desert Plants 10(2): 79-86.
Benoit-C., I.L., editor. 1989. Red Book on Chilean terrestrial flora (Part One). Corporación Nacional Forestal (CONAF), Santiago, Chile.
Bidak, L.M., Samal, S.A., Halmy, M.W. & Heneidy, S.Z. 2015. Goods and services provided by native plants in desert ecosystems: examples from the northwestern coastal desert of Egypt. Global Ecology and Conservation 3, 433-447
De Groot, R., Brander, L., Van der Ploeg, S., Costanza, R., Bernard, F., Braat, L., Christie, M., et al., 2012. Global estimates of the value of ecosystems and their services in monetary units. Ecosyst. Serv. 1, 50–61.
Garreaud, R., Rutllant, J., 1996. Análisis meteorológico de los aluviones de Antofagasta y Santiago de Chile en el periodo 1991–1993. Atmósfera. 9, 251–271.
Gregoire T, H Valentine, G Furnival. 1995. Sampling methods to estimate foliage and other characteristics of individual trees.
Ecology 76(4): 1181-1194.
Hogan, C., & Fund, W. (2014). Atacama Desert. Retrieved from: http://www.eoearth.org/view/article/150268 (March 1st 2016).
Lettau, H., 1978. Explaining the World's Driest Climate. Univ. of Wis. Pres, Madison.
USGS, 2015. Product Guide. Provisional Landsat 8 Surface Reflectance Product. Version 1.8
Vargas, G., Rutllant, J., Ortlieb, L., 2006. ENSO climate teleconnections andmechanisms for Holocene debris flows along the hyperarid coast ofwestern South America (17–24 S).
Earth Planet. Sci. Lett. 249, 467–483.
Breiman, L. 2001. Random forests. Machine Learning 45: 5-32.
Reif, D., Motsinger, A., McKinney, B., Crowe, J. and Moore, J. 2006. Feature selection using a random forests classifier for the integrated analysis of multiple data types. IEEE Symposium on Computational Intelligence and Bioinformatics and Computational Biology 1-8.
Luebert, F. & Pliscoff, P. 2006. Sinopsis bioclimática y
vegetacional de Chile. Editorial Universitaria, Santiago
The International Archives of the Photogrammetry, Remote Sensing and Spatial Information Sciences, Volume XLI-B8, 2016 XXIII ISPRS Congress, 12–19 July 2016, Prague, Czech Republic
This contribution has been peer-reviewed.