Glycation amplifies lipoprotein(a)-induced alterations in the
generation of fibrinolytic regulators from human vascular
endothelial cells
Jianying Zhang, Song Ren, Garry X. Shen *
Departments of Internal Medicine and Physiology,The Uni6ersity of Manitoba,BS440 730William A6e,Winnipeg,Manitoba,Canada R3E3J7
Received 26 January 1999; received in revised form 23 August 1999; accepted 3 September 1999
Abstract
Increased lipoprotein(a) [Lp(a)] in plasma is an independent risk factor for premature cardiovascular diseases. The levels of glycated Lp(a) are elevated in diabetic patients. The present study demonstrated that glycation enhanced Lp(a)-induced production of plasminogen activator inhibitor-1 (PAI-1), and further decreased the generation of tissue-type plasminogen activator (t-PA) from human umbilical vein endothelial cells (HUVEC) and human coronary artery EC. The levels of PAI-1 mRNA and its antigen in the media of HUVEC were significantly increased following treatments with 5mg/ml of glycated Lp(a) compared to equal amounts of native Lp(a). The secretion and de novo synthesis of t-PA, but not its mRNA level, in EC were reduced by glycated Lp(a) compared to native Lp(a). Treatment with aminoguanidine, an inhibitor for the formation of advanced glycation end products (AGEs), during glycation normalized the generation of PAI-1 and t-PA induced by glycated Lp(a). Butylated hydroxytoluene, a potent antioxidant, inhibited native and glycated Lp(a)-induced changes in PAI-1 and t-PA generation in EC. The results indicate that glycation amplifies Lp(a)-induced changes in the generation of PAI-1 and t-PA from venous and arterial EC. This may attenuate fibrinolytic activity in blood circulation and potentially contributes to the increased incidence of cardiovascular complications in diabetic patients with hyperlipoprotein(a). EC-mediated oxidative modification and the formation of AGEs may be implicated in glycated Lp(a)-induced alterations in the generation of fibrinolytic regulators from vascular EC. © 2000 Elsevier Science Ireland Ltd. All rights reserved.
Keywords:Glycated lipoprotein(a); Vascular endothelial cells; Plasminogen activator inhibitor-1; Tissue-type plasminogen activator; Antioxidants; Aminoguanidine
www.elsevier.com/locate/atherosclerosis
1. Introduction
Numerous epidemiological studies suggest that in-creased plasma lipoprotein(a) [Lp(a)] is a strong and independent risk factor for premature cardiovascular diseases [1,2]. Lp(a) particles have been detected in the atherosclerotic vascular wall [3,4]. The risk of develop-ing cardiovascular disease is greatly increased in dia-betic individuals [5]. Circulating Lp(a) levels were increased in Type 2 diabetic patients and positively correlated with blood concentrations of hemoglobulin A1c, an index of glucose control [6]. The impact of
Lp(a) on the development of cardiovascular complica-tions in diabetes had not been known.
The Lp(a) particle is composed of low density lipo-protein (LDL) and apolipolipo-protein(a) [apo(a)]. Apo(a) has more than 30 sizes of isoforms or phenotypes. The sizes of apo(a) depend on the number of kringle repeats in the polypeptide. The kringle of apo(a) are to a great extent a homologue of the kringle IV of plasminogen. Lp(a) competes with plasminogen in binding to fibrin and plasminogen receptors on the surfaces of mono-cytes and vascular endothelial cells (EC), which may attenuate the generation of plasmin and reduces fibrinolytic activity in blood circulation [7,8]. The ca-pacity for the generation of fibrinolytic activity re-sponding to vascular stress is reduced in diabetic patients [9]. In Type 2 diabetes, plasma levels of
plasmi-* Corresponding author. Tel.:+1-204-787-1158; fax:+ 1-204-789-3934.
E-mail address:[email protected] (G.X. Shen)
nogen activator inhibitor-1 (PAI-1) were significantly elevated [10] and that was correlated with body mass index, plasma insulin and triglycerides [11]. Increased levels of PAI-1 were found in Type 1 diabetic patients with a high risk for developing atherosclerotic compli-cations [12]. PAI-1 is the major physiological inhibitor for plasminogen activators. The dominant plasminogen activator in blood circulation is tissue-type plasminogen activator (t-PA), which modulates the formation of plasmin.
Vascular EC synthesize both PAI-1 and t-PA. The generation of fibrinolytic regulators in EC is modulated by a variety of biological agonists, including proinsulin [13], glucose [14,15] and several types of plasma lipo-proteins [16 – 22]. Very low density lipoprotein from hypertriglyceridemia, native and oxidized LDL stimu-lated the release of PAI-1 from EC or hepatocytes [16 – 23]. Treatments with Lp(a), LDL or high density lipoprotein reduced the secretion of t-PA from EC [24]. Lp(a) also elevated the production of PAI-1 in EC [25]. Previous studies in our laboratory demonstrated that oxidization enhanced the production of PAI-1 in EC induced by Lp(a) [26]. Glycation promotes the peroxi-dation of LDL [27]. Our recent studies indicate that glycated LDL stimulated PAI-1 but reduced t-PA gen-eration from the human umbilical vein EC (HUVEC) [28]. The present study examined the effect of glycated Lp(a) on the generation of fibrinolytic regulators in HUVEC and human coronary arterial EC (HCAEC). The involvement of EC-mediated oxidative modifica-tion and advanced glycamodifica-tion end products (AGEs) in glycated Lp(a)-induced generation of fibrinolytic regu-lators was investigated.
2. Methods
2.1. Isolation of lipoproteins
DensityB1.21 fraction was separated from fresh hu-man plasma by density ultracentrifugation in the pres-ence of 1 mM EDTA [29]. The lipoprotein-rich fraction was applied on a lysine Sepharose-CL 4B affinity column. Lp(a) bound to the column was eluted with 20 mM 6-amino hexanoic acid in 0.1 M phosphate buffer (pH 7.4) containing 1 mM benzamidine and 0.01% EDTA [30]. Lp(a)-free LDL (1.019 – 1.063) was isolated from unbound lipoproteins by ultracentrifugation. Lipoproteins were dialyzed against 0.15 M NaCl, 0.01% EDTA and 0.01% NaN3(pH 7.4) at 4°C, then stored in sealed tubes overlaid with nitrogen at 4°C in the dark. Phenotypes of Lp(a) used in this study were S3, S2, S4/S2, S1/S4 and B/S2 determined using a combination of SDS-PAGE and Western blotting analysis as previ-ously described [31]. The levels of endotoxin in lipo-proteins were monitored by Limulus amebocyte lysate
test using a commercially available kit (E-TOXATE, Sigma, St. Louis, MO). The lowest limit for detecting endotoxin using this system is 0.05 ng/ml. No de-tectable amount of endotoxin was found in lipoprotein preparations.
2.2. Modification of lipoproteins
Lp(a) and Lp(a)-free LDL were glycated by 25, 50 or 200 mM glucose for 1 – 3 weeks in the presence of equimolar sodium cyanoborohydride in 0.1 M phos-phate buffer (pH 7.4) containing 0.01% EDTA and 0.01% sodium azide in sealed tubes under N2 at 37°C. At the end of glycation, lipoproteins were dialyzed to remove free glucose. Native lipoproteins used in this study were proceeded in parallel without exposure to glucose. Glycated and native lipoproteins were analyzed on 1% non-denatured agarose gel electrophoresis (Corning, Oneonta, NY) at 90 V for 50 mins in 75 mM barbital buffer (pH 8.6) to assess the electrophoretic mobility of lipoproteins. The extent of glycation of lipoproteins was estimated by measuring the abundance of glucitollysine using reverse phase HPLC as described previously [28]. Integrity of apo(a) in glycated Lp(a) was examined using the aforementioned Western blot-ting analysis [31]. As outlined earlier, no fragmentation of apo(a) in glycated Lp(a) was found in comparison to its unmodified form [6], and lipid peroxidation of lipo-proteins was evaluated by measuring thiobarbituric acid reaction substances (TBARS) [26]. No significant increase in TBARS was detected in native and glycated Lp(a) and LDL.
2.3. Cell culture and stimulation
HUVEC were obtained by collagenase digestion and verified as previously outlined [26]. HUVEC were grown in M-199 medium supplemented with 10% fetal bovine serum, 30 mg/ml of EC growth stimulator, 100 mg/ml of heparin, 0.1 mM nonessential amino acids, 200 U/ml of penicillin and 200mg/ml of streptomycin in a humidified incubator under 95% air and 5% CO2 at 37°C. Confluent HUVEC were stimulated in heparin-free M-199 medium for the evaluation of t-PA and PAI-1. Seed HCAEC and Endothelial Growth Medium-MV Bulletkits were purchased from Clonetics (San Diego, CA). HCAEC were grown and stimulated in the same medium and used within passage eight. Cytotoxicity of lipoproteins was determined by incubat-ing cells with 5×10⁶ dpm/well of 3H-leucine (54 Ci/ mM, ICN Radiochemical, Irvine, CA) in leucine-free medium for 2 h after treatments with lipoproteins [32]. The incorporation of 3
H-leucine in EC was not signifi-cantly altered by treatment with up to 10 mg/ml of Lp(a), 100mg/ml of LDL or their glycated forms for5
2.4. Measurement of PAI-1 and t-PA antigen
The medium was collected from cultured cells at the end of incubations. Cells were harvested in phosphate buffered saline (PBS, pH 7.4) containing 0.1% SDS and 0.5% Triton X-100. Total amounts of PAI-1 and t-PA antigen in free or complex form in the medium from replicated cultures were estimated by using IMUBIND PAI-1 or t-PA ELISA kits with monoclonal antibodies against human PAI-1 or t-PA (American Diagnostica Inc., Greenwich, CT). The levels of PAI-1 and t-PA antigen were measured on a microplate reader at an absorbency of 490 nm and values were corrected with total cellular proteins from each well [28].
2.5. Northern blotting analysis
The total cellular RNA cultured in 150 mm dishes was extracted from cells at the end of incubation by guanidine isothiocyanate-cesium chloride method [33]. RNA was denatured and subject to electrophoresis on a 1% agarose-formaldehyde gel, then transferred to Zeta-Probe GT blotting membranes (BioRad, Hercules, CA). Plasmids containing cDNA fragments of encoded hu-man PAI-1, t-PA or b-actin were labelled with [a32
P]-dCTP (\111 TBq/mM, Dupont NEN) using random primer labelling kits. Blots were prehybridized in 0.25 M Na2HPO4 (pH 7.2) and 7% SDS for 10 mins, then hybridized with denatured radioactive probe for 16 h at 42°C [28]. After hybridization, blots were washed, then subjected to autoradiography. The levels of PAI-1 and t-PA mRNA were quantified from autoradiogram by density scanning, and subsequently corrected with the levels of b-actin mRNA in corresponding lanes.
2.6. Metabolic labelling and immunoprecipitation
Confluent cells in 60 mm dishes were treated with 100 mCi/ml of Trans35
S-label (85% methionine/15% cystine, 38 TBq/mM, ICN) in methionine- and cystine-free me-dia supplemented with 2 mM glutamine and 10% serum, with and without lipoproteins [28]. Cellular lysates were diluted with buffer containing 50 mM Tris, 0.5 M NaCl, 0.1% NP-40, 1 mM EDTA, 2.5% gelatine and 0.5% bovine serum albumin (NET buffer). Media and cellular lysates were incubated with 30 mg/ml of rabbit IgG at 25°C for 1 h, then treated with 40ml of a 50% slurry of protein A Sepharose for 30 mins. Beads bound with non-specific IgG were removed by centrifu-gation. Resultant supernatant was incubated at 25°C for 2 h with goat anti-human uterine t-PA IgG (Amer-ican Diagnostica Inc.). The immune complexes of t-PA were collected using protein A Sepharose and recovered from beads using 125 mM Tris buffer (pH 6.8) contain-ing 20% glycerol and 4.6% SDS. The mixture was analyzed on 12% SDS-PAGE. Radioactive t-PA on
dried gels was visualized using autoradiography, and quantified by density scanning.
2.7. Measurement of protein concentrations in lipoproteins and cells
Protein concentrations in lipoproteins were deter-mined using a modified Lowry method [34]. For mea-suring the total cellular proteins, cells were lysated in PBS containing 0.5% Triton X-100 and 0.1% SDS.
2.8. Statistical analysis
Values were presented as mean9SD from quadrupli-cate or tripliquadrupli-cate cultures. Student’st-test was used for the comparison of probability of values between two groups. Comparisons among multiple groups were achieved using one-way ANOVA followed by Duncan’s test analysis. The level of significance was defined as
PB0.05. Statistical analyses were performed using Number Cruncher Statistical System software.
3. Results
3.1. Effects of glycated Lp(a) on PAI-1 and t-PA secretion
The levels of PAI-1 and t-PA antigen were deter-mined in post-cultural medium of HUVEC treated with up to 1 – 10 mg protein/ml of native or glycated Lp(a) (modified by 50 mM glucose). Incubation with above 5 mg/ml of native or glycated Lp(a) for 48 h significantly increased PAI-1 release from HUVEC compared to controls. Glycated Lp(a)]5 mg/ml increased PAI-1 release compared to identical concentrations of native Lp(a) (PB0.05, Fig. 1, upper). In contrast, the secre-tion of t-PA from HUVEC treated with various amounts of native or glycated Lp(a) for 24 h was dose-dependently decreased. The reductions in t-PA generation reached significant levels following treat-ments with]2.5 mg/ml of native or glycated Lp(a) (Fig. 1, bottom). Glycated Lp(a)-induced inhibition of t-PA release was significantly greater than native Lp(a). The levels of t-PA antigen in the media of HUVEC treated with 5 mg/ml of native Lp(a) were reduced by 36.6% in comparison to no addition controls. Glycated Lp(a) at the same concentration decreased t-PA antigen level in the medium by 52.3% compared to controls or by 25% compared to native Lp(a) (PB0.001).
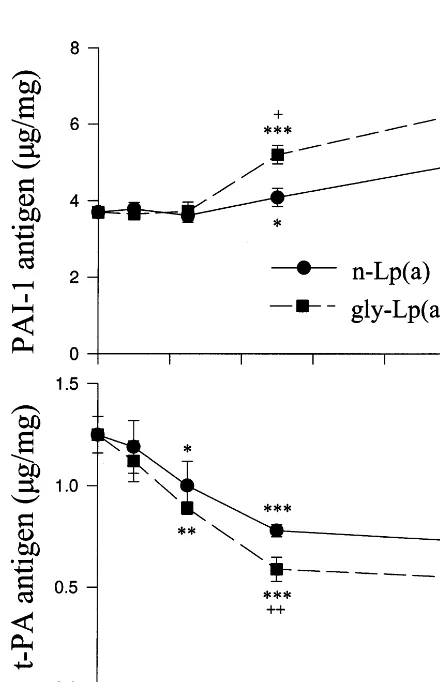
enhanced PAI-1 secretion from EC compared to native Lp(a) (PB0.01 or 0.001, Fig. 2, upper). Incorporation of 3H-leucine was significantly reduced in cells treated with native or glycated Lp(a) for either 56 or 72 h but not ]48 h. The results generated from cultures with
]56 h of Lp(a)-treatments were not included in the present study. Accumulation of t-PA in media was time-dependent in cultures treated with Lp(a) or medium without addition. Significant decreases in t-PA generation were detected in EC treated with 5mg/ml of native Lp(a) for ]24 h compared to appropriate con-trols. The inhibitory effect of Lp(a) on t-PA generation in EC was aggravated by treatment with glycation of Lp(a). The levels of t-PA in the medium of HUVEC treated with glycated Lp(a) for 24 or 48 h were signifi-cantly lower than that in native Lp(a)-treated cells (PB0.05 or 0.01, Fig. 2, bottom).
Fig. 2. Time-dependence of glycated Lp(a) on the generation of PAI-1 and t-PA antigen from cultured HUVEC. Cells were treated with medium without addition (control), with 5mg/ml of native Lp(a) [n-Lp(a)] or glycated Lp(a) [gly-Lp(a), modified by 50 mM glucose] for 8 – 48 h. The levels of PAI-1 (upper) and t-PA (bottom) antigen in the media were analysed by ELISA. Values were expressed asmg/mg of cellular proteins (mean9SD) from quadruplicate cultures, *,**,***:PB0.05, 0.01 or 0.001 versus controls following matching period of incubation; +,+ +:PB0.05 or 0.01 versus n-Lp(a).
Fig. 1. Dose-response of native and glycated Lp(a) on the generation of PAI-1 and t-PA antigen from HUVEC. Cells were incubated with 1 – 10 mg/ml of native Lp(a) [n-Lp(a)] or glycated Lp(a) [gly-Lp(a), modified by 50 mM glucose] for 48 h (PAI-1, upper) or 24 h (t-PA, bottom). The levels of PAI-1 and t-PA antigen in the medium were determined by ELISA as described in Section 2. Values were ex-pressed asmg/mg of cellular proteins (mean9SD) from quadruplicate cultures. *,**,***: PB0.05, 0.01 or 0.001 versus cultures without addition;+,+ +:PB0.05 or 0.01 versus n-Lp(a).
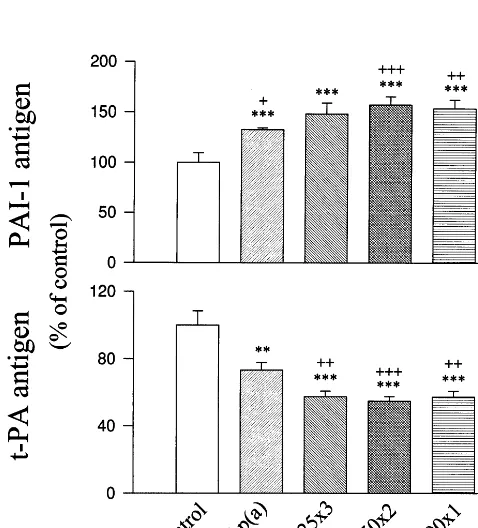
The influence of glucose concentration and exposure time on glycated Lp(a)-induced PAI-1 and t-PA genera-tion from EC was examined. Treatments with glycated Lp(a) were modified by 25 mM glucose for 3 weeks, 50 mM glucose for 2 weeks, or 200 mM glucose for 1 week which altered the generation of PAI-1 and t-PA to similar extents (Fig. 3). The extents of glycation evalu-ated by glucitollysine/lysine ratio in those lipoproteins were comparable: 1.12 for glycated Lp(a) modified by 25 mM glucose for 3 weeks; 1.09 for that modified by 50 mM glucose for 2 weeks; 1.14 for that by 200 mM glucose for 1 week, compared to 0.19 for native Lp(a) (average of two separate preparations with varia-tionsB15%). Glycated Lp(a) (10mg/ml) modified by 25 mM glucose for 1 week (glucitollysine/lysine ratio 0.34) did not significantly affect PAI-1 or t-PA release from EC compared to controls. The same amount of gly-cated Lp(a) modified by 50 mM glucose for 1 week (glucitollysine/lysine ration 0.62) moderately altered PAI-1 (+18.992.1%) and t-PA release (−23.29
n=4,PB0.05). Our findings suggest that the effects of glycated Lp(a) on PAI-1 and t-PA generation are dose-dependent to glucose used in glycation. Lp(a) modified by 25 or 50 mM glucose for longer periods (2 – 3 weeks) may alter the generation of fibrinolytic regulators from EC to a similar extent as that modified by 200 mM glucose for a shorter period.
The effects of native and glycated Lp(a) on the generation of PAI-1 and t-PA were also examined in HCAEC. Due to required growth condition and the cost of specific medium/ supplements, limited experi-ments were performed in HCAEC. The basal level of PAI-1 released from HCAEC was 2.7-fold of that for HUVEC. The level of t-PA released from HCAEC was 18% lower than that from HUVEC without addition (Fig. 4). Treatment with10 mg/ml of native Lp(a) in-duced comparable increases in PAI-1 generation from HCAEC (+40%) and HUVEC (+33%). PAI-1 release was significantly increased by 50 mM glucose-modified glycated Lp(a) in HCAEC (+109%) and HUVEC (+68%) (Fig. 4, upper). Inhibition of t-PA generation from HCAEC by native and glycated Lp(a) (−18 and
Fig. 4. Comparison of PAI-1 and t-PA generation from HCAEC and HUVEC responding to native and glycated Lp(a). HCAEC and HUVEC were treated with 10 mg/ml of native Lp(a) [n-Lp(a)] or glycated Lp(a) [gly-Lp(a) modified by 50 mM glucose] for 48 h (PAI-1) or 24 h (t-PA). PAI-1 and t-PA antigens in the medium were analysed by ELISA. Values were presented in mean9SD from quadruplicate cultures. *: PB0.001 versus no addition controls; +,
+ +, + + +:PB0.05, 0.01 or 0.001 versus n-Lp(a); x,xx,xxx: PB 0.05, 0.01 or 0.001 versus HUVEC.
Fig. 3. Influence of glucose concentration and exposure time on glycated Lp(a)-induced PAI-1 and t-PA generation from HUVEC. Lp(a) was glycated by 25 mM for 3 weeks (25×3), 50 mM for 2 weeks (50×2) or 200 mM glucose for 1 week (200×1). Cells were treated with medium without addition (control), 10mg/ml of native Lp(a) [n-Lp(a)] or glycated Lp(a) [gly-Lp(a)] modified by glucose in various conditions for 48 h. PAI-1 and t-PA antigens in the medium were analysed by ELISA. Values were expressed in percentage of controls (mean9SD) from quadruplicate cultures. **,***: PB0.01 or 0.001 versus controls; +, + +, + + +: PB0.05, 0.01 or 0.001 versus n-Lp(a).
−32%) was considerably less than that from HUVEC (−42 and −56%) (Fig. 4, bottom).
3.2. Effect of glycated Lp(a) on PAI-1 mRNA
3.3. Effect of glycated Lp(a)on mRNA le6el and synthesis of t-PA
No obvious change in the density of t-PA mRNA was detected in HUVEC treated with 5mg/ml of native or glycated Lp(a) for 24 h compared to controls (Fig. 6). In order to determine which step in the process of t-PA generation in EC was affected by Lp(a) or its glycated form, HUVEC were metabolically labelled with 35S-methionine-cystine (70%/30%) in the presence of 5 mg/ml of native or glycated Lp(a) for 48 h. Radioactivity of t-PA was mainly detected in extracel-lular fluid but not in cell-associated pool. Synthesis of t-PA in EC treated with native Lp(a) was 79.193.4% (mean9SD from triplicated cultures) of control group (PB0.01). In EC with 5 mg/ml of glycated Lp(a) (modified by 50 mM glucose), the synthesis of t-PA was 62.395.6% of controls (PB0.001), and that was sig-nificantly lower than the sample in EC that was treated with the same amount of native Lp(a) (PB0.05).
3.4. Comparison of the effects of glycated Lp(a) and LDL on PAI-1 and t-PA generation
Lp(a) and Lp(a)-free LDL isolated from a healthy donor, which apo(a) phenotype is B/S2 (double-band phenotype with B type as the major isoform and S2 as
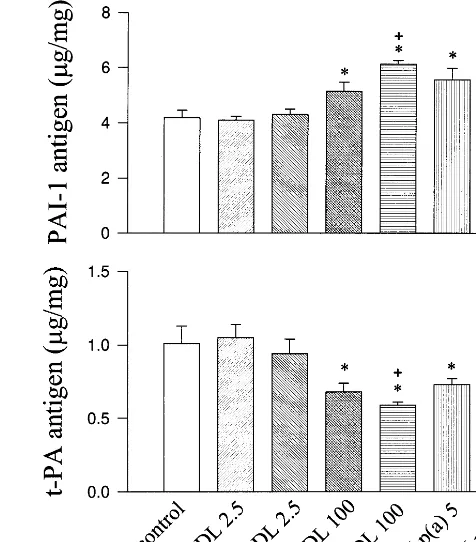
Fig. 7. Comparison of the effects between glycated Lp(a) and LDL on PAI-1 and t-PA secretion from HUVEC. Cells were treated with medium without addition (control), 2.5 mg/ml of native LDL (n-LDL), 2.5 mg/ml of glycated LDL (gly-LDL, modified by 50 mM glucose), 100 mg/ml of n-LDL, 100mg/ml of gly-LDL, 5 mg/ml of native Lp(a) [n-Lp(a)] or 5 mg/ml of gly- Lp(a) [gly-Lp(a)] for 48 h (PAI-1) or for 24 h (t-PA). The levels of PAI-1 and t-PA antigen in medium were determined using ELISA. Values were presented in mean9SD from quadruplicate cultures. *: PB0.001 versus con-trols;+:PB0.05 versus n-LDL;c:PB0.05 versus n-Lp(a).
Fig. 5. Northern blotting analysis of PAI-1 mRNA in cultured HUVEC. Cells were treated with 5 mg/ml of native Lp(a) [n-Lp(a)] or glycated Lp(a) [gly-Lp(a)] for 48 h. Total cellular RNA (20mg/lane) was analyzed on agarose-formaldehyde gel electrophoresis, then transferred to nitrocellulose membrane. Blots were hybridized with human PAI-1 cDNA probe (upper) then rehybridized with b-actin cDNA probe (bottom).
the minor), were applied in the experiments described in Fig. 7. Since the size of apo(a) B is approximately equal to apoB-100, the protein content in Lp(a) of this indi-vidual is close to 2-fold of that in equimolar amount of LDL. LDL and Lp(a) from the individual was glycated with 50 mM glucose for 2 weeks. Ratios of gluci-tollysine/lysine in glycated Lp(a) and LDL were 0.97 and 1.04, respectively. Native and glycated Lp(a) at 5 mg/ml significantly affected the generation of PAI-1 and t-PA from EC. Treatment with 2.5 mg/ml of native or glycated LDL modified by the same condition, which contains similar amount of apoB-100 as in 5 mg/ml of Lp(a) B isoform, did not significantly alter PAI-1 or t-PA generation. Native LDL at the level of 100 mg/ml significantly increased PAI-1 generation and reduced t-PA release compared to controls (PB0.001). Gly-cated LDL (100 mg/ml) induced significantly greater increase in PAI-1 production and further decreased t-PA generation from EC compared to equimolar amount of native LDL (PB0.05) (Fig. 7). Those find-ings indicate that Lp(a) in either native or glycated form is more potent than LDL in the generation of PAI-1 and t-PA from EC.
3.5. Influence of antioxidants and AGEs inhibitor on glycated Lp(a)-induced PAI-1 and t-PA in EC
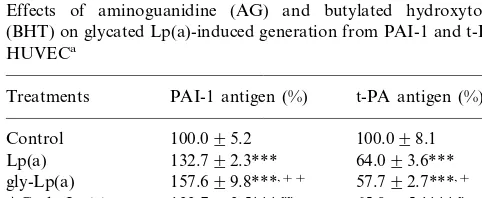
To determine the role of EC-mediated oxidative modification in native and glycated Lp(a)-induced changes in PAI-1 and t-PA production, HUVEC were treated with 80mM butylated hydroxytoluene (BHT), a potent antioxidant, with and without the presence of 5 mg/ml of native or glycated Lp(a). BHT treatment completely prevented native Lp(a)-induced changes in PAI-1 and t-PA generation. The same concentration of BHT inhibited 80% of PAI-1 overproduction and 49% of the decrease in t-PA generation induced by glycated Lp(a) (Table 1). Our previous studies demonstrated that the presence of 25 mM aminoguanidine during the glycation prevented glycated LDL-induced alterations in the generation of fibrinolytic regulators from HU-VEC [28]. In the present study, Lp(a) was glycated by 50 mM glucose in the presence of 25 mM aminogu-nidine for 2 weeks at 37°C. No detectable glucitollysine was found in aminoguanidine-treated glycated Lp(a) as it was found in glycated Lp(a). The levels of PAI-1 and t-PA released from EC incubated with aminoguandine-treated glycated Lp(a) for 48 h were significantly differ-ent from glycated Lp(a)-treated cells (PB0.05 or 0.01), and similar to that induced by native Lp(a) (Table 1).
4. Discussion
Peripheral levels of Lp(a) in diabetes have been ex-amined by a number of studies. Increased Lp(a) levels were found in some studies in Type 1 diabetes [35 – 40] but not in most others [41 – 50]. In comparison, the majority of studies in Type 2 diabetes found increased
levels of Lp(a) in plasma [36 – 38,40,51 – 58] with a few exceptions [44,59 – 63]. Correlation between Lp(a) levels and macrovascular diseases was found in many studies in Type 2 diabetes [41,45,55 – 59] but only in a few in Type 1 diabetes [39,40]. In diabetic patients, the glyca-tion of plasma proteins, including Lp(a), is expected to be increased. Elevated levels of glycated Lp(a) were detected in diabetic subjects and the proportion of glycated Lp(a) correlated to glucose control [6]. The results of the present study demonstrated that glycation amplified Lp(a)-induced production of PAI-1 and fur-ther reduced t-PA generation from vascular EC. This suggests that increased levels of glycated Lp(a) poten-tially attenuate EC-derived fibrinolytic activity. The effects of Lp(a) isolated from diabetic patients on EC-derived fibrinolytic regulators will be determined in a future study.
Oxidized LDL stimulates PAI-1 secretion and re-duced t-PA release from coronary artery EC [64]. The present study demonstrates that Lp(a) and its glycated form altered the generation of PAI-1 and t-PA from HCAEC. HCAEC produced 2- to 3-fold more of PAI-1 and moderately less amounts of t-PA compared to HUVEC at the basal condition. The variations in PAI-1 generation between HCAEC and HUVEC may also result from differences in the types of media and/ or passage numbers. The responses of HCAEC and HUVEC to native or glycated Lp(a) in the gener-ation of PAI-1 and t-PA were comparable. Increased levels in Lp(a) or its glycated form in blood may attenuate EC-derived fibrinolytic activity in arterial as well as venous systems.
Our results demonstrated that LDL in either native or glycated form was substantially weaker than Lp(a) for the alteration in PAI-1 and t-PA generation. The presence of apo(a) may amplify the susceptibility of Lp(a) to cell-dependent and -independent oxidation. Glycation may further increase the oxidative stress of Lp(a) as it found in LDL [27]. Native Lp(a)-induced changes in PAI-1 and t-PA generation likely resulted from cell-mediated oxidative modification, since treat-ment of EC with BHT almost completely inhibited the effects of native Lp(a). Antioxidant treatment partially inhibited glycated Lp(a)-induced changes in EC-derived fibrinolytic regulators, which suggests that cell-medi-ated oxidative modification also plays an important role in glycated Lp(a)-induced PAI-1 and t-PA genera-tion. TBARS assay may not be sensitive enough to reveal lipid peroxidation in glycated lipoproteins. Our previous study demonstrated that the formation of conjugated dienes but not TBARS was detected in glycated LDL [28]. We speculated that glycated Lp(a) has a similar pattern of lipid peroxidation as that in glycated LDL. The detection of conjugated dienes in Lp(a) was limited by the amounts of Lp(a) (milligrams) required for the assay.
Table 1
Effects of aminoguanidine (AG) and butylated hydroxytoluene (BHT) on glycated Lp(a)-induced generation from PAI-1 and t-PA in HUVECa
Treatments PAI-1 antigen (%) t-PA antigen (%)
100.098.1 AG-gly-Lp(a) 133.793.5***,xx
101.499.4
BHT 99.496.3
Lp(a)+BHT 107.694.1+++ 99.096.9+++ gly-Lp(a)+BHT 111.392.5***,xxx 72.995.2**,x
Extended exposure of Lp(a) to high levels of glucose promotes the formation of conjugated dienes. The cross-link between AGEs and proteins in the vascular wall may promote atherogenesis. Increased levels of AGEs were detected in the tissues of diabetes, Alzheimer’s disease, end stage kidney diseases and nor-mal ageing [65]. In addition, AGEs increase the oxida-tive stress of glycated products [66]. The present study demonstrates that treatment of Lp(a) with aminoguanidine, an inhibitor of AGEs formation, dur-ing glycation prevented glycated Lp(a)-induced over-production of PAI-1 and reduced t-PA generation from EC. The finding suggests that AGEs formation may also play an important role in glycated Lp(a)-induced generation of fibrinolytic regulators in EC.
In summary, glycation enhances the production of PAI-1 and attenuates the synthesis of t-PA induced by Lp(a) in arterial and venous EC. The formation of AGEs and EC-mediated oxidative modification may contribute to the alterations of the generation of PAI-1 and t-PA induced by glycated Lp(a). The combination of hyperglycaemia and hyperlipoprotein(a) may reduce EC-derived fibrinolytic activity, which may promote the development of thrombosis and atherosclerosis in dia-betes. Management of hyperglycaemia and hyperbetal-ipoproteinemia, including hyperlipoprotein(a), potentially improves fibrinolytic activity and reduces the incidence of cardiovascular complications in diabetes.
Acknowledgements
The authors thank Dr Paul E. DiCorleto (Cleveland Clinic Foundation, Cleveland, OH) for providing cDNA probes and Dr Angelo M. Scanu (University of Chicago, Chicago, IL) for the advice on Lp(a) purifica-tion. This study is supported by the Canadian Diabetes Association in the memory of late Archibald Mitchell to G.X.S.
References
[1] Berg K. Lp(a) lipoprotein: a review. Chem Phys Lipids 1994;67-68:9 – 16.
[2] Lenzi S, Scanu A, DeCaterina R. Lipoprotein(a) as an athero-thrombotic risk factor: epidemiological evidence and possible pathologenic mechanism. G Ital Cardiol 1996;126:1203 – 25. [3] Rath MS, Niendorf A, Reblin T, Dietel M, Krebber HJ,
Beisiegel U. Detection and qualification of lipoprotein(a) in the arterial wall of 107 coronary bypass patients. Arteriosclerosis 1989;9:579 – 92.
[4] Cushing GL, Gaubatz JW, Nava ML, Burdick BJ, Bocan TM, Guyton JR, Weibacecher D, DeBakey ME, Lawrie GM, Morri-sett JD. Quantitation and localization of apolipoproteins[a] and B in coronary artery bypass vein grafts resected at re-operation. Arteriosclerosis 1989;9:593 – 603.
[5] Steiner G. Dyslipoproteinemia in diabetes. Clin Invest Med 1995;18:282 – 7.
[6] Doucet C, Huby T, Ruiz J, Chapman MJ, Thillet J. Non-enzy-matic glycation of lipoprotein(a) in vitro and in vivo. Atheroscle-rosis 1995;118:135 – 43.
[7] Miles LA, Fless GM, Levin EG, Scanu AM, Plow EF. A potential basis for the thrombotic risks associated with lipo-protein(a). Nature 1989;339:301 – 3.
[8] Hajjar KA, Gavish D, Breslow JL, Nachinann RL. Lipo-protein(a) modulation of endothelial cell surface fibrinolysis and its potential role in atherosclerosis. Nature 1989;339:303 – 5. [9] Fearnly GR, Chakrabartl R, Avis PR. Blood fibrinolytic activity
in diabetes mellitus and its bearing on ischaemic heart disease and obesity. Br Med J 1963;1:921 – 3.
[10] Auwerx J, Bouillon R, Collen D, Geboers J. Tissue-type plasmi-nogen activator inhibitor in diabetes mellitus. Arteriosclerosis 1988;8:68 – 72.
[11] Juhan-Vague I, Roul C, Alessi MC, Ardissone JP, Heim M, Vague P. Increased plasminogen activator inhibitor activity in non insulin dependent diabetic patients. Relationship with plasma insulin. Thromb Haemost 1989;61:370 – 3.
[12] Carmassi F, Morale M, Puccetti R, DeNegri F, Monzani F, Navalesi R, Mariani G. Coagulation and fibrinolytic system impairment in insulin dependent diabetes mellitus. Thromb Res 1992;67:643 – 54.
[13] Schneider DJ, Nordt TK, Sobel BE. Stimulation by proinsulin of expression of plasminogen activator inhibitor type-1 in endothe-lial cells. Diabetes 1992;41:890 – 5.
[14] Meiellon M, Boeri D, Podesta F, Cagliero E, Vichi M, Odetti P, Adezati L. Increased expression of tissue plasminogen activator and its inhibitor and reduced fibrinolytic potential of human endothelial cells cultured in elevated glucose. Diabetes 1992;41:1009 – 15.
[15] Kollros PR, Konkle BA, Ambarian AP, Henrikson P. Plasmino-gen activator inhibitor-1 expression by brain microvessel en-dothelial cells is inhibited by elevated glucose. J Neurochem 1994;63:903 – 9.
[16] Stiko-Rahm A, Wiman B, Hamsten A, Nilsson J. Secretion of plasminogen activator inhibitor-1 from cultured human umbili-cal vein endothelial cells is induced by very low density lipo-protein. Arteriosclerosis 1990;10:1067 – 73.
[17] Tremoli E, Camera M, Maderna P, Sironi L, Prati L, Colli S, Piovella F, Bernini F, Corsini A, Mussoni L. Increased synthesis of plasminogen activator inhibitor-1 by cultured human endothe-lial cells exposed to native and modified LDLs: An LDL recep-tor-independent phenomenon. Arterioscler Thromb 1993;13: 338 – 46.
[18] Latron Y, Chautan M, Anfosso F, Alessi MC, Lafont H, Juhan-Vague I. Stimulating effect of oxidized low density lipo-protein on plasminogen activator inhibitor-1 synthesis by en-dothelial cells. Arterioscler Thromb 1991;11:182 – 9.
[19] Chauton M, Latron Y, Anfosso F, Alessi MC, Lafont H, Juhan-Vague I, Nalbone G. Phosphatidylinositol turnover dur-ing stimulation of plasminogen activator inhibitor-1 secretion induced by oxidized low density lipoproteins in human endothe-lial cells. J Lipid Res 1993;34:101 – 10.
[20] Kugiyama K, Sakamoto T, Ohgushi M, Ogawa H, Horiguchi M, Yasue H. Transferable lipids in oxidized low density lipoprotein stimulate plasminogen activator inhibitor-1 and inhibit tissue plasminogen activator release from endothelial cells. Circ Res 1993;73:335 – 43.
[22] Schneider DJ, Sobel BE. Synergistic augmentation of expression of plasminogen activator inhibitor type-1 induced by insulin, very low density lipoproteins and fatty acids. Coronary Artery Dis 1996;7:813 – 7.
[23] Sironi L, Mussoni L, Prati L, Baldassarre D, Camera M, Banfi C, Tremoli E. Plasminogen activator inhibitor type-1 synthesis and mRNA expression in HepG2 cells are regulated by VLDL. Arterioscler Thromb Vasc Biol 1996;16:89 – 96.
[24] Levin EG, Miles LA, Fless GM, Scanu AM, Baynham P, Curtiss LK, Curtiss LK, Plow EF. Lipoproteins inhibit the secretion of tissue plasminogen activator from human endothelial cells. Arte-rioscler Thromb 1994;14:438 – 41.
[25] Etingin OR, Hajjar DP, Hajjar KA, Harpel PC, Nachinann RL. Lipoprotein(a) regulates Plasminogen Activator Inhibitor-1 Ex-pression in Endothelial Cells. J Biol Chem 1991;266:2459 – 65. [26] Ren S, Man RYK, Angel A, Shen GX. Oxidative modification
enhances lipoprotein(a)-induced overproduction of plasminogen activator inhibitor-1 in cultured vascular endothelial cells. Atherosclerosis 1997;128:1 – 10.
[27] Kobayashi K, Watabnabe J, Umeda F, Nawata H. Glycation accelerates the oxidation of low density lipoprotein by copper ions. Endocrinol J 1995;42:461 – 5.
[28] Zhang JY, Ren S, Sun D, Shen GX. Influence of glycation on LDL-induced generation of fibrinolytic regulators from vascular endothelial cells. Arterioscler Thromb Vasc Biol 1998;18:1140 – 8. [29] Schumaker VN, Puppione DL. Sequential floatation
ultracen-trifugation. Methods Enzymol 1986;128:155 – 69.
[30] Snyder ML, Polacek D, Scanu AM, Fless GM. Comparative binding and degradation of lipoprotein(a) and low density lipo-protein by human monocyte-derived macrophages. J Biol Chem 1992;267:339 – 46.
[31] Shen GX, Mymin D, Dembinski T, Krahn A, Angel A. Poly-morphism and peripheral levels of apolipoprotein(a) in polygenic hypercholesterolemia and combined hyperlipidemia. Clin Invest Med 1995;18:33 – 41.
[32] Ren S, Cockell KA, Fenton JWII, Angel A, Shen GX. G proteins and phospholipase C mediate thrombin-induced genera-tion of plasminogen activator inhibitor-1 from vascular smooth muscle cells. J Vasc Res 1997;34:82 – 9.
[33] Chirgwin JM, Pryzbyla AE, MacDonald RJ, Rutter WJ. Isola-tion of biological active ribonucleic acid from sources enriched in ribonuclease. Biochemistry 1979;18:5294 – 9.
[34] George R, Barbar DL, Schneider WJ. Characterization of the chicken oocyte receptor for low and very low density lipo-proteins. J Biol Chem 1987;262:16838 – 47.
[35] Krawczuk-Rybak M, Wojtowicz J, Urban M. State of lipid metabolism in children and adolescents with insulin-dependent diabetes. I. Evaluation of lipoprotein (A) behaviour in children and adolescents with insulin-dependent diabetes. Endokrynol-Pol 1991;42:437 – 45.
[36] Irish AB, Simons LS, Simons J. Lipoprotein(a) concentration in diabetes: relationship to proteinuria and diabetes control. Aust NZ J Med 1992;22:329 – 33.
[37] Heller FR, Jamart J, Honore P, Derue G, Novik V, Galanti L. Serum lipoprotein(a) in patients with diabetes mellitus. Diabetes Care 1993;16:819 – 23.
[38] Murakami J, Kumasaka K, Kawano K, Murakami T, Hayashi Y, Arakawa Y. Lp(a) serum concentrations in diabetes mellitus. Rinsho-Byori 1992;42:1273 – 8.
[39] Groop PH, Viberti GC, Elliott TG, Firedman R, Mackie A, Ehnholm C, Jauhiainen M, Taskinen MR. Lipoprotein(a) in type 1 diabetic patients with renal disease. Diabet Med 1994;11:961 – 7.
[40] James RW, Boemi M, Sirolla C, Amadio L, Fumelli P, Pometta P. Lipoprotein(a) and vascular disease in diabetic patients. Dia-betologia 1995;38:711 – 4.
[41] Gall MA, Rossing P, Hommel E, Voldsgaard AI, Andersen P, Nielsen FS, Dyerberg J, Parving HH. Apolipoprotein(a) in in-sulin-dependent diabetic patients with and without diabetic nephropathy. Scand J Clin Lab Invest 1992;52:513 – 21. [42] Klausen IC, Schmidt EB, Lervang HH, Gerdes LU, Ditzel J,
Faergeman O. Normal lipoprotein(a) concentrations and apolipoprotein(a) isoforms in patients with insulin-dependent diabetes mellitus. Eur J Clin Invest 1992;22:538 – 41.
[43] Csaszar A, Dieplinger H, Sandholzer C, Karadi I, Juhasz E, Drexel H, Halmos T, Romics L, Patsch JR, Utermann G. Plasma lipoprotein(a) concentration and phenotypes in diabetes mellitus. Diabetologia 1993;36:47 – 51.
[44] Ritter MM, Loscar M, Richter WO, Schwandt P. Lipoprotein(a) in diabetes mellitus. Clin Chim Acta 1993;214:45 – 54.
[45] Maser RE, Usher D, Becker DJ, Drash AL, Kuller LH, Orchard TJ. Lipoprotein(a) concentration shows little relationship to IDDM complications in the Pittsburgh epidemiology of diabetes complications study cohort. Diabetes Care 1993;16:755 – 8. [46] Taupin JM, Durlach V, Hassaim M, Gillery P, Jolly D, Boirie Y,
Grulet H, Leutenegger M. Lipoprotein(a) and diabetes: relation-ship based on 224 cases. Diabet Metab 1993;19:250 – 6. [47] Martinez MT, Ramos O, Carretero N, Calvillan M,
Gutierrez-Lopez MD, Cuesta P, Serrano-Rios M. Lipoprotein(a) and other risk factors in children with insulin-dependent diabetes mellitus and children without diabetes. Diabete Metab 1994;20:522 – 5. [48] Guerci B, Igau B, Ziegler O, Crea T, Fruchart JC, Drouin P,
Fievet C. Lack of relationship between Lp(a) particle levels and albumin excretion rate in type 1 diabetic patients. Diabete Metab 1994;20:526 – 31.
[49] Ferrer I, Llopart R, Moyano D, Pavia C, Farre C, Ordonez J. Lipoprotein(a): its concentrations in children with insulin-depen-dent diabetes mellitus. Med Clin Barc 1995;104:565 – 7. [50] Haffner SM, Framgps M, Williamson J, Santiago J, Valdez R,
Aldrete G, Mykkanen L, Gruber KK, Rainwater DL. Lp(a) concentrations and phenotypes in children with insulin-depen-dent diabetes mellitus. Chem Phys Lipids 1994;67-68:223 – 31. [51] Wolffenbuttel BH, Leurs PB, Sels JP, Rondas-Colbers GJ,
Men-heere PP, Nieuwenhuijzen-Kruseman AC. Improved blood glu-cose control by insulin therapy in type 2 diabetic patients has no effect on lipoprotein(a) levels. Diabet Med 1993;10:427 – 30. [52] Nakata H, Horita K, Eto M. Alteration of lipoprotein(a)
con-centration with glycemic control in non-insulin-dependent dia-betic subjects without diadia-betic complications. Metabolism 1993;42:1323 – 6.
[53] Heesen BJ, Wolffenbuttel BH, Leurs PB, Sels JP, Menheere PP, Jackle-Beckers SE, Niewenhuijzen-Kruseman AC. Lipo-protein(a) levels in relation to diabetic complications in patients with non-insulin-dependent diabetes. Eur J Clin Invest 1993;23:580 – 4.
[54] O’Brien T, Nguyen TT, Harrison JM, Bailey KR, Dyck PJ, Kottke BA. Lipids and Lp(a) lipoprotein (a) levels and coronary artery disease in subjects with non-inuslin-dependent diabetes mellitus. Mayo Clin Proc 1994;69:430 – 5.
[55] Morisaki N, Yokote K, Tashiro J, Inadera H, Kobayashi J, Kanzaki T, Saito Y, Yoshida S. Lipoprotein (a) is a risk factor for diabetic retinopathy in the elderly. J Am Geriatr Soc 1994;42:965 – 7.
[56] Ruiz J, Thillet J, Huby T, James RW, Erlich D, Flandre P, Froguel P, Chapman J, Passa P. Association of elevated lipo-protein(a) levels and coronary heart disease in NIDDM patients. Relationship with apolipoprotein(a) phenotypes. Diabetologia 1994;37:585 – 91.
[57] Hiraga T, Shimada M, Okubo M, Nakanishi K, Kobayashi T, Murase T. Lipoprotein(a) is an independent risk factor for multiple cerebral infarctions. Atherosclerosis 1996;26:29 – 32. [58] Miyao M, Araki A, Hattori A, Miyachi T, Inoue J, Horiuchi T,
Lipo-protein(a) as a risk factor for cardiovascular disease in elderly patients with diabetes. Nippon Ronen Igakkai Zasshi 1997;34:185 – 91.
[59] Haffner SM, Morales PA, Stern MP, Gruber MK. Lp(a) concen-trations in NIDDM. Diabetes 1992;41:1267 – 72.
[60] Velho G, Erlich D, Trupin E, Neel D, Cohen D, Froguel P, Passa P. Lipoprotein(a) in diabetic patients and normo-glycemic relatives in familial NIDDM. Diabetes Care 1993;16:742 – 7.
[61] Kuusi T, Yki-Jarvinen H, Kauppinen-Makelin R, Jauhiainen M, Ehnholm C, Kauppila M, Seppala P, Viikari J, Kujansuu E, Rajala S, Lahti J, Niskanen L, Marjanen T, Salo S, Ryysy L, Tulokas T, Taskinen MR. Effect of insulin treatment on serum lipoprotein(a) in non-insulin-dependent diabetes. Eur J Clin In-vest 1995;25:194 – 200.
[62] Rainwater DL, MacCluer JW, Stern MP, Van de Berg JF,
Haffner SM. Effects of NIDDM on lipoprotein(a) size. Diabetes 1994;43:942 – 6.
[63] Chang CJ, Kao JT, Wu TJ, Lu FH, Tai TY. Serum lipids and lipoprotein(a) concentrations in Chinese NIDDM patients. Rela-tion to metabolic control. Diabetes Care 1995;18:1191 – 4. [64] Grafe M, Auch-Schwelk W, Hertel H, Terbeek D, Steinheider G,
Loebe M, Fleck E. Human cardiac microvascular and macrovas-cular endothelial cells respond differently to oxidatively modified LDL. Atherosclerosis 1998;137:87 – 95.
[65] Valssara H. Advanced glycation end products and atherosclero-sis. Ann Med 1996;28:419 – 26.
[66] Schmidt AM, Hori O, Brett J, Yan SD, Wautier J-L, Stern D. Cellular Receptors for advanced glycation end products: implica-tions for induction of oxidant stress and cellular dysfunction in the pathogenesis of vascular lesions. Arterioscler Thromb 1994;14:1521 – 8.
.