GEOSPATIAL DATA QUALITY OF THE SERVIR CORS NETWORK
J. Santos a,R. Teodoro c, N. Mira c, V.B. Mendes a,b
a
Faculdade de Ciências, Universidade de Lisboa, b Instituto Dom Luiz, Campo Grande, 1749-016 Lisboa –[email protected], [email protected]
c
Army Geographic Institute, Av. Dr. Alfredo Bensaúde, 1849-014 Lisboa –[email protected], [email protected]
Commission IV, WG IV/4
KEY WORDS: Data Quality, GNSS, RTK, Accuracy, Precision, Repeatability, CORS
ABSTRACT:
The SERVIR Continuous Operation Reference Stations (CORS) network was implemented in 2006 to facilitate land surveying with Global Navigation Satellite Systems (GNSS) positioning techniques. Nowadays, the network covers all Portuguese mainland. The SERVIR data is provided to many users, such as surveyors, universities (for education and research purposes) and companies that deal with geographic information. By middle 2012, there was a significant change in the network accessing paradigm, the most important of all being the increase in the responsibility of managing the network to guarantee a permanent availability and the highest quality of the geospatial data. In addition, the software that is used to manage the network and to compute the differential corrections was replaced by a new software package. These facts were decisive to perform the quality control of the SERVIR network and evaluate positional accuracy. In order to perform such quality control, a significant number of geodetic monuments spread throughout the country were chosen. Some of these monuments are located in the worst location regarding the network geometry in order to evaluate the accuracy of positions for the worst case scenarios. Data collection was carried out using different GNSS positioning modes and were compared against the benchmark positions that were determined using data acquired in static mode in 3-hour sessions. We conclude the geospatial data calculated and provided to the users community by the network is, within the surveying purposes, accurate, precise and fits the needs of those users.
1. INTRODUCTION
1.1 SERVIR GNSS CORS overview
The production of geographic information by the Portuguese Army Geographic Institute (IGeoE) starts with the surveying of photogrammetric points. These points must fulfil some conditions, but the most important one is the quality of their three-dimensional (3D) coordinates. Traditionally these coordinates were calculated using observations from classical surveying techniques. Since the introduction of the Global Positioning System (GPS) a significant improvement in position determination was achieved. Techniques like Real Time Kinematic (RTK) facilitate enormously the positioning, despite the technical limitations of this way of work. By 2005, taking advantage of the improvements in the digital communications networks, in the algorithms of GNSS signal processing and also in the GNSS infrastructure, IGeoE started to design a network of permanent reference stations that could improve in all aspects the surveying procedures used until that time. The goal was to improve the efficiency of the surveying teams while measuring 3D coordinates of points and increase the precision and consistency of those coordinates. In the beginning of 2006 the SERVIR network was set up, initially only in the Lisbon region. Since then there was a continuous improvement, not only in the number of reference stations, increasing the covered area, but also in the number of users. The coordinates determined using the differential corrections calculated by the network became more precise and accurate with the stabilization of the network, as time elapsed.
1.2 Motivation
Due to the enormous costs in the maintenance of the network, the access to the differential corrections started to have a cost by
middle 2012. This fact represented a significant change in the paradigm and brought an increased responsibility in the management of the infrastructure, in order to ensure the permanent quality of the data and the availability throughout the country and to provide as well good accuracy and repeatability of the determined positions. These statistical parameters were assessed only in a small limited region (Teodoro et al., 2014), never globally. Furthermore, by the end of 2014, IGeoE acquired Trimble® PIVOT™, a new software to manage the network, replacing GPSNet™. It was necessary to assess if this new program would maintain or increase the quality of the data. Finally, as IGeoE is a producer of geographic information, it was critical to evaluate how the network could affect the acquisition of this information as a decisive contribution to the global quality of the geographic information produced by IGeoE, justifying therefore the need of making the quality control that is described in this paper.
1.3 Network architecture
The first stations were implemented in the Lisbon region in 2006. Nowadays the network has 27 stations spread throughout Portugal mainland, as can be seen in Figure 1. The average distance between stations is 87 km, the shortest distance is 27 km and the longest distance is 326 km. Most of the stations are located inside Army, Navy and Air Force facilities, ensuring the necessary security. Only 2 stations are outside those facilities. The average availability of the network is greater than 93%, but 95% of the reference stations have availability greater than 99%. The data collected by each station is sent to the computing center using the private network of each branch of the Portuguese Armed Forces. These intranets are very robust,
with redundancy and very small latency times (an average value of ~253 ms) representing, once again, an extraordinary advantage to ensure the operating conditions that are expected in this kind of infrastructure. The computing center has 5 servers, also with redundancy. The software used was GPSNet™. During 2015, it was assembled a new management infrastructure, with three servers, that are installed on virtual machines, using Trimble® PIVOT™ software. Once the evaluation of this new working environment is performed, the next step is to provide the users with the differential corrections generated by this software. The users can connect to the network using one of the following services:
- Real Time Kinematic (RTK) using a Virtual Reference Station (VRS), available through the following message formats: Compact Measurement Record (CMR), CMR+, CMRx, Radio Technical Commission for Maritime Services (RTCM) 2.3 and RTCM 3.1 messages;
- Differential GPS;
- Download data for post-processing, both as raw and RINEX (Receiver Independent Exchange Format) format, either from CORS or from a VRS created by the user.
Figure 1. Network map with a kernel density of the CORS
2. ASSESSMENT METHODOLOGY
The proposed assessment methodology has mainly three steps: - Selection of one point inside each triangle formed by the
baselines between SERVIR stations and points with the worst observing conditions, as far as network geometry is concerned;
- Collection of field data using different positioning methods;
- Processing of the data.
2.1 Point selection methodology
One of the first issues that were discussed was the methodology to select the points to be observed. A set of 49 points (geodetic monuments) spread across Portugal mainland was chosen taking in account some initial conditions:
- One point inside every triangle formed by the baselines between the reference stations;
- Points along the two longest baselines;
- Points outside the baselines, located at 5 km, 10 km and 15 km from those baselines.
With this distribution it was intended to cover not only the normal surveying areas, but also the worst positioning scenario using SERVIR, in order to fully evaluate the network performance.
The Figure 2 map shows the distribution and density of the points used in this study.
Figure 2. Location of the points observed along with the kernel density
2.2 Positioning methods
Next step was to choose how the points should be observed. In order to evaluate accuracy, we used a 3-hour session in static mode to establish a set of coordinates as benchmark values. It was also necessary to observe the points using methods that are used in a daily basis by the
surveyors, as the network is mostly used for surveying purposes. Thus, it was decided to determine the position of each point using the following methodologies:
- A 180-epoch observation session with an observation rate of 1 Hz, resulting in one set of (X,Y,Z) coordinates, obtained by a least squares adjustment computed by GPSNet™, hereafter designated as Control Measured Point (CMP– GPSNet™);
- A set of 180 (X,Y,Z) coordinates, corresponding approximately a 3-minute session, computed by GPSNet™, hereafter designated as Continuous Topographic Point (CTP–GPSNet™);
- A 180-epoch observation session, resulting in one set of (X,Y,Z) coordinates, obtained by a least squares adjustment computed by Trimble® PIVOT™, hereafter designated as Control Measured Point (CMP–PIVOT™);
- A 180-epoch observation session resulting in a set of 180 (X,Y,Z) coordinates computed by Trimble® PIVOT™, hereafter designated as Continuous Topographic Point (CTP–PIVOT™);
- A 12-minute observation session in Fast Static mode for post-processing purposes.
2.3 Static mode data processing
Data from the 3-hour observation sessions for the 49 points were then processed using precise ephemerides, as follows:
- By using Trimble® Business Center™ (TBC™) with raw data from four SERVIR stations, three of which were constrained and the fourth one free to validate the results from the processing.
- By using the following online GPS data positioning services: AUSPOS, provided by Geoscience Australia (AUSPOS,
2015);
OPUS, provided by the National Oceanic and Atmospheric Administration (NOAA) (OPUS, 2015);
Trimble® CenterPoint™ RTX™ Post Processing, provided by Trimble® (TRIMBLE, 2015);
CSRS-PPP, provided by the Natural Resources Canada’s Canadian Geodetic Survey (NRCan) (NRcan, 2015); PPP, provided by the Jet Propulsion Laboratory (JPL) (JPL,
2015).
In the end of all these processing steps, we obtained six sets of (X,Y,Z) coordinates and these solutions were subsequently analyzed.
In order to establish which of the solutions obtained would represent our reference for further analysis, we processed data from 5 stations of the SERVIR network using the different strategies and we compared the solutions obtained against the official coordinates of SERVIR for those stations. The 24-hour RINEX files were split into two observation files, one with two hours and another one with three hours. For each station, data was processed using the TBC™ software and the online services abovementioned.
Table 1 represents the 3D differences between each solution and the benchmark values (solution minus benchmark), as measure of the accuracy of the different processing strategies, for the
Table 1. Statistics for the 3D coordinate difference (all values expressed in m)
Table 2 represent the uncertainties associated to the estimated coordinates. We can observe that the solutions TRIMBLE® TBC™, TRIMBLE® RTX™ and JPL have the lowest mean uncertainties with a very low dispersion as well.
As the Trimble® CenterPoint™ RTX™ solutions provide the best agreement with our “true” values, combined with a low uncertainty associated to the estimates of the coordinates, we used this solution, hereafter designated simply as RTX, as reference for the subsequent analysis.
TBC RTX AUSPOS OPUS JPL NRCan Mean 0.014 0.013 0.027 0.022 0.006 0.039
σ 0.005 0.004 0.011 0.003 0.002 0.020 Min 0.007 0.008 0.012 0.018 0.003 0.014 Max 0.020 0.017 0.039 0.024 0.063 0.063
Table 2. Statistics for the uncertainty of the estimated coordinates (all values expressed in m)
3. DATA ANALYSIS
3.1 GPSNet™
All the data collect with the rover linked to SERVIR network GPSNet™ are referred to ITRF2005 (Altamimi et al., 2007), epoch 2008.5, so it was necessary to perform a coordinate transformation, in order to have a set of homogeneous coordinates. The set of (X,Y,Z) coordinates were transformed to ITRF2008 (Altamimi et al., 2011), at observation epoch. Only this way was possible to compare consistently the coordinates of all the points observed with different positioning methods. Thetransformation between these reference frames was performed according to Boucher and Altamini (2011).
3.1.1 RTK processing – CMP
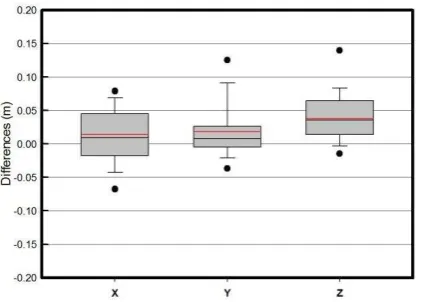
From the two RTK techniques explained in section 2.2, the CMP–GPSNet™ method was the easiest to process, because the rover gives only a set of (X,Y,Z) coordinates. The coordinates were compared with the RTX solution, in order to evaluate the accuracy. The “internal” uncertainty associated to the coordinates is provided by the rover software at the end of the measurement or by consulting the reports generated by TBC™. The differences in X, Y, and Z between CMP–GPSNet™ and RTX are represented in Figure 3. The box plot represents the mean (red line) and the median (black line), the 25% and 75% percentiles (limits of the boxes), the 10% and 90% percentiles (whiskers) and the 5% and 95% percentiles (dots). We can conclude that the Z-coordinate is the most biased, with a mean value of 0.038 cm. The majority of the solutions
have differences lying within the –0.100 m to 0.100 m range.
Figure 3. Differences between CMP-GPSNet™ and RTX
3.1.2 RTK processing – CTP
For the CTP–GPSNet™, we have 180 sets of (X,Y,Z) coordinates. To evaluate the accuracy, we performed:
- Computation of the mean values for the coordinate and subsequent accuracy evaluation;
- Computation of the deviation of each measurements with respect to the mean values;
Figure 4 represent the box plot for the differences between the mean value of the (X,Y,Z) coordinates and RTX. Comparing Figure 3 and Figure 4 we can see that the results are quite similar, but CTP–GPSNet™, shows a slight improvement in the dispersion of the solutions.
Figure 4. Differences of the CTP-GPSNet™
3.2 Fast Static processing
This technique was considered because is a valid alternative to RTK positioning, for surveying purposes, when the CORS network or any other component of the system (e.g. internet access) is not available. Taking advantage of the VRS technology, it is possible to collect only 12 minutes of data with a minimum of six visible satellites. To perform the post-processing, GPSNet™ generates a VRS RINEX file, near to the observation position, that is used for post-processing. Figure 5 represents the differences between the Fast Static solution and RTX. We can observe that the X component of position shows the largest scatter, and that all components are essentially unbiased.
Figure 5. Differences between the Fast Static and RTX, for the three components of position
Figure 6 represents the 3D differences between the fast static, and the two RTK solutions with respect to RTX. We can conclude Fast Static shows an overall better performance, and is therefore a good alternative to RTK, in situations this method is not available, as mentioned before. One of the disadvantages of Fast Static is, of course, the need to observe more time than needed for the two RTK methods, but if this is, sometimes, the only choice.
Figure 6. 3D Differences between CMP-GPSNet, CTP-GPSNet and Fast Static with respect to RTX
3.3 Trimble® PIVOT™
The IGeoE updated recently his server software to Trimble® PIVOT™, replacing GPSNet™. There some differences between the two software packages, the most important of which is the fact that when the users connect to the new server, the coordinates that are obtained are referred to ITRF2008, epoch 2005.0. For that reason, in order to compare the solutions given by the different methods, an update of the coordinates to the observation epoch was necessary. This epoch update was performed with the mean velocity of all the 27 SERVIR stations, which were estimated with six years observation data
3.3.1 RTK processing – CMP
Figure 7 represents the differences in (X, Y, Z) between CMP–Trimble® PIVOT™ and RTX. We can conclude
that the biases in all components are quite small, and the Y component is the less biased, with a mean value close to zero. The majority of the solutions have differences lying within the – 0.050 m to 0.050 m range. The mean values X, Y, and Z components are 0.019 m, 0.002 m, and 0.024 m, respectively, a significant improvement in the reduction of the biases when compared with those obtained with GPSNet™.
Figure 7. Differences between CMP-Trimble® PIVOT™ and RTX solutions, for the components of position
3.3.2 RTK processing – CTP
Figure 8 represents the differences in (X, Y, Z) between CTP– Trimble® PIVOT™ and RTX. The mean values are slightly better than those obtained with CMP-Trimble® PIVOT™ : 0.018 m, -0.001 m, and 0.019 m for X, Y, and Z components, respectively, but the standard deviation increased.
Figure 8. Differences between CTP-Trimble® PIVOT™ and RTX solutions, for the components of position
3.4 GPSNet™ VS Trimble® PIVOT™
Since we are examining data from two different server software packages, and we already realized that there was an improvement in the quality of the provided coordinates, it seemed interesting to do a spatial analysis of the accuracy of each of the 49 points, in comparison with the density of CORS from SERVIR network. Figure 9 shows that, concerning the CMP, we have less accuracy on the North of Portugal mainland, and near the longest baselines, when connected to the GPSNet. This lack of accuracy disappears when we use the Trimble® PIVOT™. These cases are displayed on the figure 9 by the big blue dots without red dots or with smaller red dots overlaid. Red dots alone mean that accuracy did not improved on that point.
Concerning CTP-GPSNet™ and CMP-GPSNet™, we expected that both methods would yield similar results. This is true in general, but in some cases we found differences in solutions of up to 0.1 m, a fact that needs to be further investigated.
Figure 9. Spatial analysis of CMP-GPSNet™ and CTP- Trimble® PIVOT™ accuracy
Analyzing the accuracy obtained with the CTP method (Figure 10), is possible to see that the results are quite similar to the ones that were presented before for the CMP method.
Figure 10. Spatial analysis of CMP-GPSNet™ and CTP- Trimble® PIVOT™ accuracy
In both cases the results show that points outside the network are as accurate as those inside the network and
that solutions from Trimble® PIVOT™ software are more consistent and stable throughout the territory. However there are some points that have significant less accuracy on the CMP method compared to CTP methods and vice versa, with the same software.
Nevertheless the biases for the new server software are significantly lower than those obtained with GPSNet™.
4. CONCLUSIONS
We have completed an assessment of post-processing commercial software and some online data processing services, available free of charge. This assessment allowed us to choose a solution to be used as benchmark, in order to perform an evaluation of the accuracy of different positioning methods, and to evaluate the quality of the free online services solutions. We concluded that all services and software are very similar, as regards the requirements for surveying applications. With this results you can also sort the services and software as follows: RTX ™, TBC ™, AUSPOS, JPL, OPUS and NR Can, being the RTX ™ the one with the best overall performance.
To the users of SERVIR network, it is very important to know how much accurate and precise are the coordinates they obtain in the field. Based on our tests, we can state that with either CTP–GPSNet™ or CMP–GPSNet™, accuracy better than 5 cm is expect for most of the situations.
Regarding the Fast Static post processing method, which is also important where it is not possible to use the RTK positioning methods, the results show that this method is a valid option, providing similar results.
A similar study was carried out with the new Trimble® PIVOT™ software, which will soon be available to replace the GPSNet™, in order to evaluate if this update would improve or not the quality of the positioning service provided to the users. The results show that a significant improvement of the quality of the service is expected, both in terms of accuracy and precision, as the 3D coordinates differences with respect to our reference solution are lower than those obtained with GPSNet™ and also more homogeneous throughout mainland territory. Most of the SERVIR users access the network services for land surveying purposes. The accuracy and precision values shown in this paper are mostly below 5 cm, allowing concluding that the SERVIR Network is precise and accurate for those purposes.
5. FURTHER WORK
There are some follow-up studies to be carried out in the future. One important issue is the evaluation of how the accuracy and precision of the Cartesian coordinates is reflected in the geodetic and cartographic coordinates, as IGeoE collect, produce and supply cartographic information.
Other concern is the evaluation of the time elapsed since the rover establishes the connection with the servers and the time elapsed to have a position fix by the same receiver (meaning that the phase solution is achieved). Some preliminary studies carried out using GPSNet™ yield to an average value of 2 min. We also want to study the effect of adding CORS from other neighbor Spanish network in the quality of the data, mainly for the worst points, outside the network.
Finally, we plan to study the quality of the results provided simultaneously by free online processing services (partial made) and open source software and conclude if the results are suited for each user requirements.
REFERENCES
Altamimi, Z., Collilieux, X., Legrand, J., Garayt, B., Boucher, C., 2007. ITRF2005: A new release of the International Terrestrial Reference Frame based on time series of station positions and Earth Orientation Parameters. J. Geophys. Res., 112, B09401, doi:10.1029/2007JB004949.
Altamimi, Z., Collilieux, X., Métivier, L., 2011. ITRF2008: an improved solution of the International Terrestrial Reference Frame, J. Geodesy, 85(8), 457-473, doi:10.1007/s00190-011-0444-4.
AUSPOS, Australian Positioning Online GPS Processing Service, 2015.
http://www.ga.gov.au/scientific-topics/positioning-navigation/geodesy/auspos (accessedMarch 2015).
Boucher C., Altamimi Z., 2011. Memo: Specifications for reference frame fixing in the analysis of a EUREF GPS campaign. Available at http://etrs89.ensg.ign.fr/memo-V8.pdf (accessed January 2015).
JPL, Jet Propulsion Laboratory, 2015. http://apps.gdgps.net/apps_file_upload.php (accessed March 2015).
NRCan, Canadian Spatial Reference System – Precise Point Positioning. (CSRS-PPP), 2015.
http://webapp.geod.nrcan.gc.ca/geod/tools-outils/ppp.php?locale=en (accessed March 2015).
OPUS, Online Positioning User Service, 2015.
http://www.ngs.noaa.gov/OPUS/index.jsp (accessed April 2015).
Teodoro, R., Mira, N., Paulo, F., 2014. Controlo de Qualidade da Rede SERVIR. In: Boletim do Instituto
Geográfico do Exército. available at
http://www.igeoe.pt/downloads/file163_pt.pdf, pp. 22-29 (accessed March 2015).
Trimble, Trimble® CenterPoint RTX™ - Post-Processing. (2015) http://www.trimblertx.com/UploadForm.aspx (accessed March 2015).