CENTENARY OF THE BATTLE OF VIMY (FRANCE, 1917): PRESERVING THE
MEMORY OF THE GREAT WAR THROUGH 3D RECORDING OF THE MAISON
BLANCHE SOUTERRAINE
A. Murtiyoso a, *, P. Grussenmeyer a, S. Guillemin a, G. Prilaux b
a Photogrammetry and Geomatics Group, ICube Laboratory UMR 7357, INSA Strasbourg, France –
(arnadi.murtiyoso, pierre.grussenmeyer, samuel.guillemin)@insa-strasbourg.fr b National Research Institute for Preventive Archaeology, France – [email protected]
Commission II
KEY WORDS: 3D Recording, TLS, Photogrammetry, Great War, Battle of Vimy Ridge, 48th Highlanders of Canada
ABSTRACT:
The Battle of Vimy Ridge was a military engagement between the Canadian Corps and the German Empire during the Great War (1914-1918). In this battle, Canadian troops fought as a single unit and won the day. It marked an important point in Canadian history as a nation. The year 2017 marks the centenary of this battle. In commemoration of this event, the Pas-de-Calais Departmental Council financed a 3D recording mission for one of the underground tunnels (souterraines) used as refuge by the Canadian soldiers several weeks prior to the battle. A combination of Terrestrial Laser Scanner (TLS) and close-range photogrammetry techniques was employed in order to document not only the souterraine, but also the various carvings and graffitis created by the soldiers on its walls. The resulting point clouds were registered to the French national geodetic system, and then meshed and textured in order to create a precise 3D model of the souterraine. In this paper, the workflow taken during the project as well as several results will be discussed. In the end, the resulting 3D model was used to create derivative products such as maps, section profiles, and also virtual visit videos. The latter helps the dissemination of the 3D information and thus aids in the preservation of the memory of the Great War for Canada.
* Corresponding author
1. INTRODUCTION
During the Great War, also known as the First World War (1914-1918), the Canadian Corps was sent to Northern France as part of the British Empire’s forces. Among their various participations in the Western Front, the Canadians gained considerable prestige during the Battle of Vimy Ridge on 9 April 1917 (Hayes and Iarocci, 2007). During this period of the war, the Maison Blanche was one of the five underground souterraines (underground tunnels) used by the Canadian Expeditionary Force to shelter their men. Previously a chalk quarry which dated to the second half of the 18th century, the Maison Blanche contains up to a thousand graffitis and carvings, almost all of them made by Canadian soldiers. The presence of Canada’s 48th
Highlanders is very evident amongst these works. The 800 m2 quarry was accessible to public between the two World Wars, and briefly served as a shelter for refugees during the German invasion of France in May 1940. From 1945 to 2001, the site was used as a dumping ground for farm garbage. The souterraine and its significance were only rediscovered in 2001 by Dominique Faivre. Since 2006, the site has seen several works to improve its access and lighting, particularly by the British Durand Group (Faivre et al., 2017).
Several remarkable carvings can be found in this site, mostly related to Canada and the 48th Highlanders. This includes coat-of-arms, carvings of maple leaves, and various graffitis made by the hundreds of soldiers who stayed there during the spring of 1917. For the centenary of the Battle of Vimy Ridge, a 3D documentation mission was financed by the Pas-de-Calais Departmental Council and undertaken by the Photogrammetry
and Geomatics Group of INSA Strasbourg in December 2016. This mission includes a thorough digitalization of the quarries using a Terrestrial Laser Scanner (TLS) and also the use of close range photogrammetry to record the various carvings and graffitis in a high level of detail. A topographic mission was also conducted in parallel with the laser scanning and photogrammetry data acquisition in order to attach the resulting point clouds to the French geodetic reference system. The 3D models provide precious data for archaeologists studying the site, while a virtual visit video was also made to be shown in a special exhibition during the centenary.
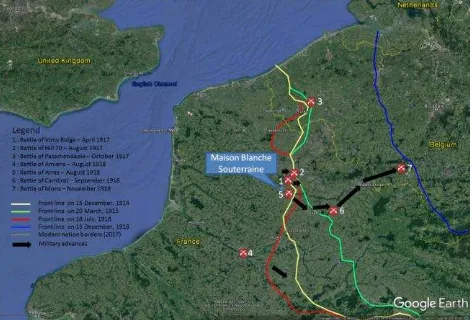
Figure 1. The western front in 1914-1918 with Canadian battles and the position of the Maison Blanche souterraine relative to
these battle sites, adapted from Hayes and Iarocci (2007). ISPRS Annals of the Photogrammetry, Remote Sensing and Spatial Information Sciences, Volume IV-2/W2, 2017
2. RELATED WORKS
The 3D documentation of archaeological and historical sites is an important task. Indeed, a detailed 3D reconstruction of heritage objects is necessary for further analysis and interpretations, and eventually physical reconstruction (Barsanti et al., 2014). In this regard, the 3D laser scanner and the photogrammetric method are examples of the techniques often employed to perform this task (Grenzdörffer et al., 2015; Lerma et al., 2010; Remondino, 2011), even though other alternatives such as 3D cameras also exist (Lachat et al., 2016).
Photogrammetry, in particular close-range photogrammetry, has been used extensively by the archaeological community to perform 3D documentation. This low-cost, image-based technique is a suitable approach to digitize artefacts and even entire monuments. Coupled with advances in photographic sensors, computing power, and computer vision-derived techniques such as SfM (Structure from Motion) (Pierrot-Deseilligny and Clery, 2012; Snavely et al., 2008) and dense matching (Furukawa and Ponce, 2009; Hirschmüller, 2005; Pierrot-Deseilligny and Paparoditis, 2006), photogrammetry has emerged as a viable method for a high quality 3D modelling. A high quality of textures is also possible, depending on the quality of the sensor. Nowadays photogrammetry does not concern only terrestrial photos, but also aerial ones with the aid of UAVs (Unmanned Aerial Vehicles) (Achille et al., 2015; Murtiyoso et al., 2017).
Laser scanning is a range-based method which uses pulses, phase-shift, triangulation, or stripe projection systems to directly record ranges (Remondino and Rizzi, 2010). It is easy to use and provides a lot of data in a single scan. This technique has also seen many uses in the heritage and archaeology domains (Grenzdörffer et al., 2015; Grussenmeyer et al., 2012a; Lachat et al., 2017; Landes et al., 2015).
In the case of underground surveying, both techniques present advantages when compared to classical surveying, mainly due to the possibility to record the environment and objects with much better details. Both techniques are often used together (Grussenmeyer et al., 2012b; Rodríguez-Gonzálvez et al., 2015) as they can complement each other. Underground 3D survey can be conducted for various reasons, including archaeological (Arles et al., 2013; Burens et al., 2014; Grussenmeyer et al., 2015), geomorphological (Fabbri et al., 2017), geological (Cosso et al., 2014), etc. Furthermore, Rodríguez-Gonzálvez et al. (2015) have also used this method to document underground First World War sites. Moreover, it should be noted that a
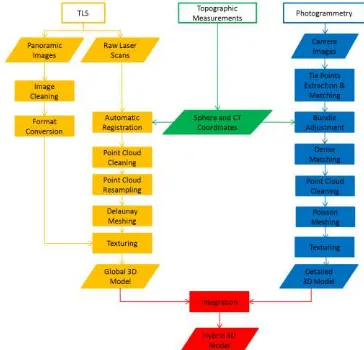
The methodology used in this project can be summarized by the workflow presented in Figure 2. Starting with raw laser scan and photogrammetric data, the final product is a hybrid 3D meshed and textured model of the quarries. This is the result of the integration of the overall, global, and less detailed 3D model obtained from the laser scanner with the much more detailed photogrammetric 3D models of the points of interest.
The overall site was scanned using the phase-based Faro Focus 3D X330 TLS. Spheres were scattered throughout the site to
help the automatic registration process of the generated point clouds. The spheres’ coordinates were also measured using a total station, following a polygonal network which was attached to GNSS-measured points on the surface. The altitude was however attached to a national levelling benchmark located near the site. In total, 45 laser scanning stations were placed which generated over 1.4 billion points.
The laser scan data coming from the different stations were then registered on the software Faro Scene. The registration was performed automatically with the help of the spheres, bearing in mind that at least three common spheres are necessary between each pair of scans in order to resolve the 3D transformation parameters. After this automatic registration process, Faro Scene offers a finer cloud-to-cloud registration. The algorithm behind this fine registration is not known, but may well be a variant of the ICP (Iterative Closest Point) method.
Figure 2. Data processing workflow used in the project, up to the integration of laser scanning and photogrammetric data.
At the aftermath of the registration process, the point cloud was cleaned from various artefacts which remained from the scans. This includes, for example, lighting cables, registration spheres, etc. The cleaned point cloud was then resampled in order to reduce its size.
The cleaned and resampled point cloud was then meshed using the Delaunay method available in the software 3DReshaper. The choice for this meshing method was taken due to the presence of many occlusions in the point cloud, which resulted in extrapolated surfaces when using the Poisson meshing method. The mesh was then textured using the panoramic images obtained by the TLS at the same time as the scans. These panoramic images also underwent some pre-processing, including cleaning and format conversion before being projected to the mesh’s surface. The resulting meshed and textured 3D model presents a global volumetric representation of the souterraine. However, since more than a few of the carvings inside the souterraine are also of great interest, a finer, more detailed 3D models of these carvings must be obtained from the close range photogrammetry method.
For this purpose, twelve photogrammetric acquisitions were also performed on several points of interest (prominent carvings, graffitis, and objects). Coded targets (CTs) were placed on the twelve points of interest. In this case, depending on the scale of the object, the number of CTs can go from 3 (minimum requirement) up to a maximum of 8. The CTs were ISPRS Annals of the Photogrammetry, Remote Sensing and Spatial Information Sciences, Volume IV-2/W2, 2017
also measured and thus their coordinates are known. This facilitates the absolute orientation phase for the photogrammetric data. A Canon EOS 5DSR Digital Single Lens Reflex with a 28 mm lens camera was used for this purpose, generating images at a 50 megapixels (MP) resolution. With an average camera-to-object distance of between 2 and 2.5 metres, this configuration gives a theoretical ground sampling distance (GSD) value of 0.3 mm. Over 2,300 images were taken for the photogrammetric acquisition. The data was acquired in two and half days while the entire project was processed in around 10 working days.
Photogrammetric processing was performed using the software Photoscan (PS) from Agisoft. The workflow in this software largely follows the typical photogrammetric one, with help from SfM in the tie point extraction phase and the automatic CT recognition function for the absolute orientation phase. The bundle adjustment, which calculates the orientation of each image, was then followed by the dense matching phase in order to generate dense point clouds. The result was then cleaned in order to delete some noise and remaining artefacts (i.e. CTs).
The resulting point clouds were meshed using the Poisson-based algorithm of PS, and subsequently textured. Twelve 3D models were thus acquired which represent the twelve points of interest. These individuals 3D models were georeferenced thanks to the CTs and can therefore be directly integrated with the global 3D model. Both were georeferenced in the same coordinate system. Nevertheless, a post-cleaning of the resulting hybrid model was still necessary.
4. RESULTS 4.1 Laser Scanning
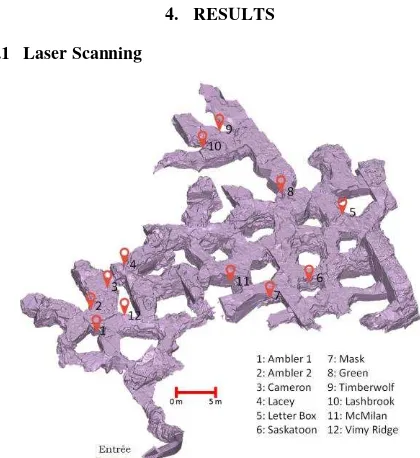
Figure 3. The overall 3D model of the site acquired using TLS and the 12 points of interest modelled using photogrammetry.
The laser scanner point clouds were registered with an average error of 1.2 mm between the stations. The resulting registered and merged point cloud was then spatially subsampled to a 2 cm resolution point cloud in order to reduce its size. After the cleaning of various artefacts in the point cloud (cables, poles, lamps, etc.) it was subsequently meshed using a Delaunay-based meshing algorithm with 8 cm of maximal distance between the vertices. The meshed model was then smoothed before being textured using the TLS-generated panoramic images. The result is a low-resolution (centimetric) 3D model which is
nevertheless sufficient to represent the globality of the quarries (Figure 3). This global volumetric model can be used to perform various larger scale analyses, such as the creation of profiles, maps, volume and surface calculations, etc. In addition, Figure 3 also shows the twelve points of interest (carvings, graffitis,
Table 1. Resulting errors for the 12 photogrammetric datasets and their average effective GSD calculated by PS.
Figure 4. Graphical representation of the errors of the photogrammetric datasets as described in Table 1.
Parallel with the laser scan processing, the photographic images were processed using PS to generate high resolution, millimetric 3D models. These models were georeferenced with the help of coded targets whose coordinates were either measured directly using the total station or obtained from the georeferenced laser scanning point cloud. Overall, an average error of 2 mm was obtained for the georeferencing of the photogrammetric model (Table 1). The maximum error obtained amounted to 6 mm (Lacey dataset). Meanwhile, the obtained average GSD for all datasets was 0.2 mm. A graphical representation of these errors can be seen in Figure 4. The errors obtained may be due to the quality of the traverse network coordinates, bearing in mind that the network was not a closed one. No adjustment to the coordinates was therefore performed. Furthermore, each dataset (except Timberwolf) was georeferenced using a minimal amount of CT (from 3 up to 5).
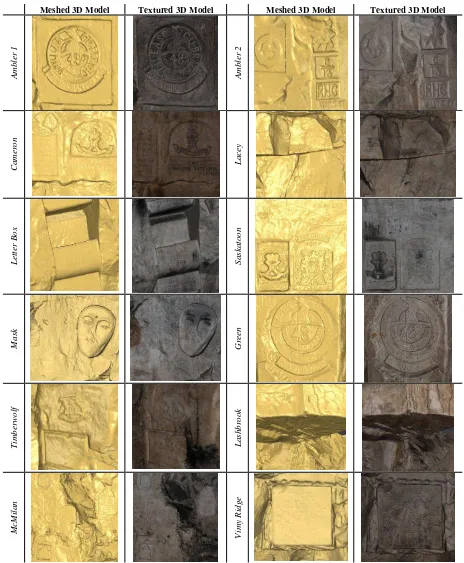
The dense matching was performed using the “Medium” quality in PS; however in some datasets with higher details the “High” quality was chosen. The meshing was performed in PS (Poisson meshing). The resulting 3D models can be seen in Table 2. ISPRS Annals of the Photogrammetry, Remote Sensing and Spatial Information Sciences, Volume IV-2/W2, 2017
Meshed 3D Model Textured 3D Model Meshed 3D Model Textured 3D Model
Amb
ler
1
Amb
ler
2
Ca
me
ro
n
L
a
ce
y
L
ett
er B
o
x
S
a
sk
a
to
o
n
M
a
sk
Gr
ee
n
T
imb
erwo
lf
L
a
sh
b
ro
o
k
M
cM
il
a
n
Vi
my
Ri
d
g
e
Table 2. Screenshots of the results of the photogrammetric processing.
Note that the quality of dense matching in PS relates to the level of image downsampling employed during the dense matching process. The CTs were cleaned from the dense point cloud, and masked on the images in order to hide them from the final product.
After the mesh is created, textures were generated from the images and projected to the mesh surfaces, enabling the generation of photo realistic 3D models. The OBJ file exchange format was chosen to export these models. Afterwards, the
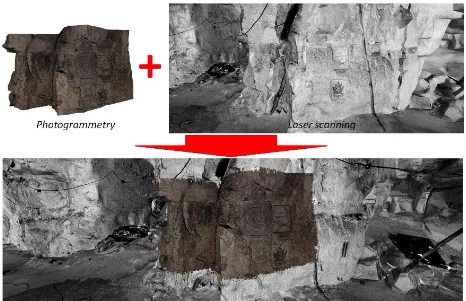
global laser scanner model and the detailed photogrammetric models were integrated to create a hybrid model using the 3DReshaper software (Figure 5).
Being georeferenced to the same coordinate system as the laser scanner 3D model, these photogrammetric 3D models can be directly integrated. Some post-processing was nevertheless required in order to clean the resulting hybrid model from remaining artefacts and incoherencies. These might occur due to slight errors in terms of georeferencing in each method. ISPRS Annals of the Photogrammetry, Remote Sensing and Spatial Information Sciences, Volume IV-2/W2, 2017
Figure 5. The integration of the detailed photogrammetric 3D model into the global laser scanner 3D model to create a hybrid model.
4.3 Derived Products
From this final model, various other products can be derived. For example, a calculation of the total surface and volume of the (surveyed) galleries can be obtained. Furthermore, an orthophoto map (Figure 6) was generated from the 3D model, which enables the updating of the existing map of the souterraine. The last map was drawn by G. Robinson in April 2011 using only compass, tape, distance meter, and clinometer. The generated orthophoto shows that this map had some inaccuracies regarding the general form of the souterraine. The orthophoto map was attached to the national French coordinate system (RGF93 CC50).
Figure 6. Orthophoto map of the souterraine created from the generated 3D model, in the French national coordinate system
(RGF93 CC50).
Another product created during the project was a virtual tour video which was played for the centenary of the Battle of Vimy Ridge on April 9th 2017. The short 5-minutes video gives a preview of the souterraine to the viewers, who otherwise may need special permissions to visit the souterraine in person. The global 3D laser model with its panoramic image texture gives a feeling of immersion within the caves, while the detailed photogrammetric models enable viewers to appreciate the fine details of the carvings and graffitis created by these Canadian soldiers.
Further research was performed in order to identify several soldiers who marked their presence inside the Maison Blanche souterraine, either by graffitis or engravings. This is done from various sources (old newspapers, Canadian War Memorial databases, expert testimonials, etc.). This information was integrated within the virtual tour video (Figure 7) in order to give the viewer a short glimpse on the story of their lives, what happened to them during the Battle of Vimy Ridge, as well as its aftermath.
5. CONCLUSIONS
In conclusion, the combination of TLS and photogrammetry has been proven to be a very reliable method to record heritage sites in general and subterranean environment in particular. The whole acquisition and processing took just a little over 2 weeks of field acquisition and laboratory processing, while keeping an overall centimetric precision for the resulting model. Various lessons were noted during this project, including the optimal acquisition and processing protocols. The resulting 3D model may also be used to derive various analytic products. In this regard, the project managed to generate profiles, the calculation of volumes, orthophoto maps, as well as a virtual visit video for the souterraine.
(a) (b) (c)
(d) (e) (f)
(g) (h) (i)
Figure 7. The nine soldiers identified in the virtual tour video: (a) A. Ambler, (b) J. Cameron, (c) E. L. Lacey, (d) G. M. Phelps, (e) R. E. Shuel, (f) W. S. McNicol, (g) W. P. Beckett, (h) T. Mason, and (i) O. Green.
The maps, profiles, and various geometrical analyses provide very valuable data for archaeologists. These products can be used in order to help them not only to document the site, but also to eventually conserve it. The virtual tour video became part of a temporary exhibition (April to October 2017) on the Canadian underground warfare held in Souchez (France) in commemoration of the centenary of the Battle of Vimy Ridge. It has become thus a very useful tool for the dissemination of information regarding the souterraine.
Several challenges were encountered during the data acquisition which involved underground surveying. Common technical problems include the general lack of light and some difficulties in obtaining enough lighting (the photographic acquisition was, however, performed using flashes). Furthermore, the general form of the site limits our capability to create a proper closed traverse network. This might in turn create additional errors in the topographic measurement. In order to reduce the error in GNSS altitude for such underground case, the measurements were attached to a levelling benchmark located outside the site. However, planimetrically it is nonetheless attached to three GNSS measurements due to lack of planimetric references.
Further exploitation of these 3D data can be envisaged. For example, an interactive database of soldiers and their respective graffitis/engravings within the souterraine can be developed. A similar system has been developed by the INSA Strasbourg for the Naours underground city, also located near the Western Front (Balland, 2016). Other possible applications of the data include the creation of an immersive Virtual Reality (VR) and/or Augmented Reality (AR) system.
ACKNOWLEDGEMENTS
This project was financed by the Pas-de-Calais Departmental Council and conducted in collaboration with the First World
War Centenary Partnership Program. The authors also wish to express their thanks to the following individuals for their indispensable help during the course of the project: Maxime Balland, Maurice Delabre, Arnaud Durier, Dominique Faivre, Lionel Gallois, Marina Hermant, Alain Jacques, Yves le Maner, and Jean-Pierre Puchois.
REFERENCES
Achille, C., Adami, A., Chiarini, S., Cremonesi, S., Fassi, F., Fregonese, L., Taffurelli, L., 2015. UAV-based photogrammetry and integrated technologies for architectural applications - methodological strategies for the after-quake survey of vertical structures in Mantua (Italy). Sensors (Switzerland) 15, 15520– 15539.
Arles, A., Clerc, P., Sarah, G., Bonnamour, G., Heckes, J., Klein, A., 2013. 3D reconstruction and modeling of subterranean landscapes in collaborative mining archeology projects: techniques, applications and experiences. ISPRS - International Archives of Photogrammetry, Remote Sensing and Spatial Information SciencesInternational Archives of the Photogrammetry, Remote Sensing and Spatial Information Sciences XL, 61–66.
Balland, M., 2016. Numérisation 3D dans les souterrains de Naours et intégration des données de la base de données Graffiti. Master's thesis from INSA Strasbourg.
Barsanti, S.G., Remondino, F., Fenández-Palacios, B.J., Visintini, D., 2014. Critical factors and guidelines for 3D surveying and modelling in Cultural Heritage. International Journal of Heritage in the Digital Era 3, 141–158.
Burens, A., Grussenmeyer, P., Carozza, L., Guillemin, S., 2014. Benefits of an accurate 3D Documentation in Understanding the Status of the Bronze Age Heritage Cave “Les Fraux” (France). International Journal of Heritage in the Digital Era 3, 179–195. ISPRS Annals of the Photogrammetry, Remote Sensing and Spatial Information Sciences, Volume IV-2/W2, 2017
Canadigm, 2014. Souterrain Impressions Project [WWW the Photogrammetry, Remote Sensing and Spatial Information Sciences - ISPRS Archives 40, 181–186.
Fabbri, S., Sauro, F., Santagata, T., Rossi, G., De Waele, J., 2017. High-resolution 3-D mapping using terrestrial laser scanning as a tool for geomorphological and speleogenetical studies in caves: An example from the Lessini mountains (North Italy). Geomorphology 280, 16–29. multi-view stereopsis. IEEE Transactions on Pattern Analysis and Machine Intelligence 32, 1362–1376.
Grenzdörffer, G.J., Naumann, M., Niemeyer, F., Frank, A., 2015. Symbiosis of UAS Photogrammetry and TLS for Surveying and 3D Modeling of Cultural Heritage Monuments - a Case Study About the Cathedral of St. Nicholas in the City of Greifswald. ISPRS - International Archives of the Photogrammetry, Remote Sensing and Spatial Information Sciences XL-1/W4, 91–96.
Grussenmeyer, P., Alby, E., Landes, T., Koehl, M., Guillemin, S., Hullo, J.F., Assali, P., Smigiel, E., 2012a. Recording approach of heritage sites based on merging point clouds from high resolution photogrammetry and Terrestrial Laser Scanning. International Archives of the Photogrammetry, Remote Sensing and Spatial Information Sciences - ISPRS Archives 39, 553– 558.
Grussenmeyer, P., Burens, A., Guillemin, S., Alby, E., Allegrini Simonetti, F., Marchetti, M.L., 2015. 3D recording methodology applied to the grotta scritta prehistoric rock-shelter in olmeta-di-capocorso (Corsica, France). ISPRS - International Archives of Photogrammetry, Remote Sensing and Spatial Information SciencesInternational Archives of the Photogrammetry, Remote Sensing and Spatial Information Sciences 40, 179–185.
Grussenmeyer, P., Burens, A., Moisan, E., Guillemin, S., Carozza, L., Bourrillon, R., Petrognani, S., 2012b. 3D multi-scale scanning of the archaeological cave les Fraux in Dordogne (France). Lecture Notes in Computer Science (including subseries Lecture Notes in Artificial Intelligence and Lecture Notes in Bioinformatics) 7616 LNCS, 388–395.
Hayes, G., Iarocci, A., 2007. Vimy Ridge: A Canadian Reassessment. Wilfrid Laurier University Press.
Hirschmüller, H., 2005. Accurate and efficient stereo processing by semi-global matching and mutual information. IEEE International Conference on Computer Vision and Pattern Recognition 2, 807–814.
Lachat, E., Landes, T., Grussenmeyer, P., 2017. First Experiences with the Trimble SX10 Scanning Total Station for Building Facade Survey. ISPRS - International Archives of the Photogrammetry, Remote Sensing and Spatial Information Sciences.
Lachat, E., Landes, T., Grussenmeyer, P., 2016. Combination of TLS Point Clouds and 3D Data From Kinect V2 Sensor To Complete Indoor Models. ISPRS - International Archives of the Photogrammetry, Remote Sensing and Spatial Information Sciences XLI-B5, 12–19.
Landes, T., Kuhnle, G., Bruna, R., 2015. 3D modeling of the strasbourg’s cathedral basements for interdisciplinary research and virtual visits. ISPRS - International Archives of Photogrammetry, Remote Sensing and Spatial Information Sciences 40, 263–270.
Lerma, J.L., Navarro, S., Cabrelles, M., Villaverde, V., 2010. Terrestrial laser scanning and close range photogrammetry for 3D archaeological documentation: the Upper Palaeolithic Cave of Parpallo as a case study. Journal of Archaeological Science 37, 499–507.
Murtiyoso, A., Grussenmeyer, P., Freville, T., 2017. Close Range UAV Accurate Recording and Modeling of St-Pierre-le-Jeune Neo-Romanesque Church in Strasbourg (France). ISPRS - International Archives of Photogrammetry, Remote Sensing and Spatial Information Sciences XLII-2/W3, 519–526.
Pierrot-Deseilligny, M., Clery, I., 2012. Apero, an Open Source Bundle Adjusment Software for Automatic Calibration and Orientation of Set of Images. ISPRS - International Archives of the Photogrammetry, Remote Sensing and Spatial Information Sciences XXXVIII, 269–276.
Pierrot-Deseilligny, M., Paparoditis, N., 2006. A multiresolution and optimization-based image matching approach: An application to surface reconstruction from SPOT5-HRS stereo imagery. ISPRS - International Archives of the Photogrammetry, Remote Sensing and Spatial Information Sciences XXXVI.
Remondino, F., 2011. Heritage recording and 3D modeling with photogrammetry and 3D scanning. Remote Sensing 3, 1104– 1138.
Remondino, F., Rizzi, A., 2010. Reality-based 3D documentation of natural and cultural heritage sites-techniques, problems, and examples. Applied Geomatics 2, 85–100.
Rodríguez-Gonzálvez, P., Nocerino, E., Menna, F., Minto, S., Remondino, F., 2015. 3D Surveying and modeling of underground passages in wwi fortifications. ISPRS - International Archives of Photogrammetry, Remote Sensing and Spatial Information SciencesInternational Archives of the Photogrammetry, Remote Sensing and Spatial Information Sciences 40, 17–24.
Snavely, N., Seitz, S.M., Szeliski, R., 2008. Modeling the world from internet photo collections. International Journal of Computer Vision 80, 189–210.