IMAGE-BASED AND RANGE-BASED 3D MODELLING
OF ARCHAEOLOGICAL CULTURAL HERITAGE:
THE TELAMON OF THE TEMPLE OF OLYMPIAN ZEUS IN AGRIGENTO (ITALY)
M. Lo Brutto, M. G. Spera
Department of Civil, Environmental and Aerospace Engineering
University of Palermo, Viale delle Scienze, 90128 Palermo, Italy
[email protected], [email protected]
Commission V
KEY WORDS: Cultural Heritage, 3D Modelling, Image Matching, Laser scanning, Close Range.
ABSTRACT:
The Temple of Olympian Zeus in Agrigento (Italy) was one of the largest temple and at the same time one of the most original of all the Greek architecture. We don’t know exactly how it was because the temple is now almost completely destroyed but it is very well-known for the presence of the Telamons. The Telamons were giant statues (about 8 meters high) probably located outside the temple to fill the interval between the columns. In accordance with the theory most accredited by archaeologists the Telamons were a decorative element and also a support for the structure. However, this hypothesis has never been scientifically proven. One Telamon has been reassembled and is shown at the Archaeological Museum of Agrigento.
In 2009 a group of researchers at the University of Palermo has begun a study to test the hypothesis that the Telamons support the weight of the upper part of the temple. The study consists of a 3D survey of the Telamon, to reconstruct a detailed 3D digital model, and of a structural analysis with the Finite Element Method (FEM) to test the possibility that the Telamon could to support the weight of the upper portion of the temple. In this work the authors describe the 3D survey of Telamon carry out with Range-Based Modelling (RBM) and Image-Based Modeling (IBM). The RBM was performed with a TOF laser scanner while the IBM with the ZScan system of Menci Software and Image Master of Topcon. Several tests were conducted to analyze the accuracy of the different 3D models and to evaluate the difference between laser scanning and photogrammetric data. Moreover, an appropriate data reduction to generate a 3D model suitable for FEM analysis was tested.
1. INTRODUCTION
In the last years the development of research in survey and documentation of Cultural Heritage have changed traditional topographic and photogrammetric survey with digital photogrammetric and laser scanner techniques. The result of this change is evident in survey data. In particular, 3D models become one of the main objectives of Cultural Heritage survey. 3D models are required in many applications but they have become a very important and fundamental step in particular for cultural heritage digital archiving.
3D modelling can be achieved mainly through the use of two different techniques based on active and passive sensors. In particular, as described in Remondino and El-Hakim (2006) it is possible to distinguish four different approaches: Image-Based Rendering, Image-Based Modelling, Range-Based Modelling and a combination of Image and Range-Based Modelling. The most used techniques for cultural heritage survey are especially the Image-Based Modelling and the Range-Based Modelling. Image-Based Modelling (IBM) is based on the use of digital imagery and images matching techniques. Range-based modelling (RBM) is the technique that involves the direct measurement of three-dimensional geometric information of the object through the use of active sensors. Within this technique the approaches may differ, but generally are based on the use of laser scanner devices.
The choice of the method depends on various factors and affects in a strong way the survey and the data processing. The RBM is better as regards the metric and qualitative aspect but it
is also more expensive and it takes a long time. For this reason, in recent years, IBM technique has been revalued. The development of this technique allows to obtain the reconstruction of surfaces and 3D models with accuracy and a level of detail similar to that achieved by laser scanner device (Remondino and Menna, 2008). In this technique particular attention is placed on camera calibration and on the orientation of the images; furthermore the image-matching techniques have been optimized thanks to the use of algorithms derived from computer vision (Barazzetti et al., 2010). Many close-range photogrammetric packages have improved several features to be more ease to use and more automatic to create 3D data. The work presented in this article has been carried out to achieve a precise and complete 3D metric documentation of the Telamon of the Temple of Olympian Zeus in Agrigento (Italy). The Temple was the largest Doric temple ever constructed, although it was never completed and now lies in ruins. It stands in the “Valle dei Templi” with a number of other major Greek temples. In the “intercolumni” (spaces between the columns) stood giant statues (about 8 metres high) called Telamons or Atlantes. One of these was reconstructed and was preserved at the Archaeological Museum of Agrigento.
Today there are several hypotheses about the position and function of the Telamons based on historical interpretations by archaeologists but the various hypotheses have never been scientifically verified. Some archaeologists assert that the Telamons were a decorative element, while others say they were also a support for the structure. In 2009 a group of researchers from the University of Palermo started a study to International Archives of the Photogrammetry, Remote Sensing and Spatial Information Sciences, Volume XXXVIII-5/W16, 2011
check the hypotheses that the Telamons really were a structural element to support the weight of the upper portion of the temple. The study consists in the 3D survey of the Telamon reassembled at the Archaeological Museum of Agrigento to reconstruct a detailed 3D model and in a structural analysis with a Finite Element Method (FEM) of the 3D model.
In this work the authors describe the 3D survey of the Telamon aimed at the realization of a detailed 3D model for digital documentation and a 3D model with low level of detail (smallest possible data volume) suitable for structural analysis. The 3D survey has been carried out using RBM and IBM techniques. The RBM has been carried out with a Time-Of-Flight (TOF) laser scanner during a first survey in February 2009. A second survey with IBM techniques took placed in April 2009. The IBM has been carried out with ZScan system by Menci Software and Image Master Photo by Topcon. A topographic survey has been also performed to measure the coordinates of some laser targets and of some photogrammetric control points. In this way we referred laser scanning and photogrammetric data to the same reference system. Several tests have been performed to analyse the geometric precision of the different 3D models and to evaluate the differences between laser and photogrammetric data. Moreover, an appropriate data reduction to generate a 3D model suitable for FEM analysis has been tested.
2. THE TELAMON OF THE TEMPLE OF OLYMPIAN ZEUS
The Temple of Olympian Zeus is one of the largest buildings of all the Greek architecture. The temple was built around 480 B.C. by Acragantini for the victory of the Greeks over the Carthaginians in Himera (Sicily). The temple is now completely destroyed (Figure 1) so there are many uncertainties about how it was really.
Figure 1. Ruins of the Temple of Olympian Zeus
Many hypotheses were made about this construction and today the temple is described as a structure in the Doric style, erected on a base of 56.30 m x 113, 45 m (ratio of sides 1:2), with a crepidoma of five steps and with a peristyle (false colonnade) of 7 x 14 semi-columns engaged into a continuous wall. The height can not be calculated, but should be about 30 meters. A problem is the location of the entrance doors because there were not gaps between the semi-columns. Seems to exclude access to the centre of the short side given the odd number of
semi-columns, so it is assumed in the corners or in the centre of the south side.
Anyway the most important architectural characteristic was the arrangement of the series of figures of Telamons, giant male figures (about 8 m high) representing Atlas, the son of Iapetus and Asia. The mythology tells us that he was condemned by Jupiter to carry the world on his shoulders because he helped the tyrants.
The best hypothesis on the position of the Telamons is that they were located outside, placed from a height of 13 m from stylobate to fill the interval between each semi-column (Figure 2). In this hypothesis the Telamons are ornaments but also a structural element; in fact, cooperate with the semi-columns to support the weight of the entablature. However, the hypothesis described has never been scientifically proven.
Figure 2. Ideal reconstruction of the Temple of OlympianZeus
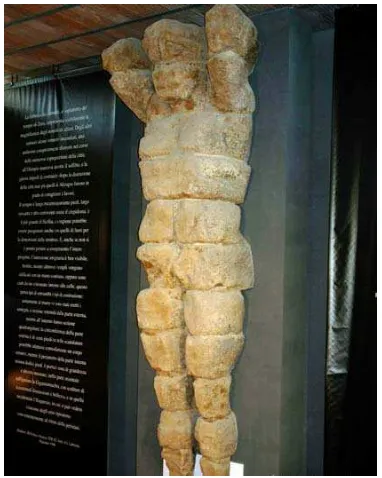
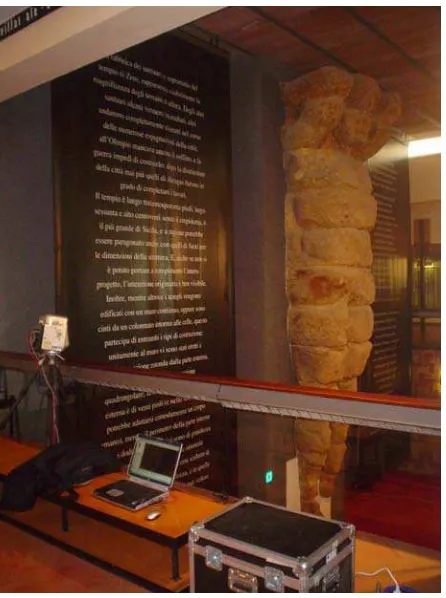
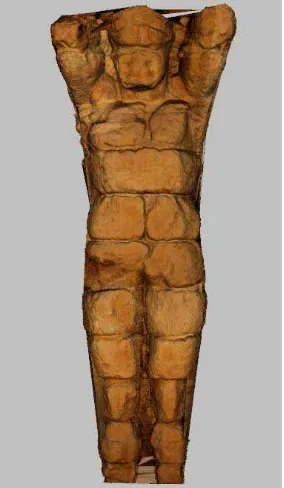
In 1825 a Telamon has been reconstructed with some few fragments found near the Temple of Zeus (D’Angelo and Moretti, 2004). The statue has been composed of 26 pieces and has been placed in the supine position where there was the Temple of Olympian Zeus. The Telamon was here until 1965, when it was moved inside the Archaeological Museum of Agrigento where it was placed on armoured concrete pillar (Figure 3). However, in situ it is possible to see a copy of the original Telamon.
Figure 3. The Telamon in the Archaeological Museum International Archives of the Photogrammetry, Remote Sensing and Spatial Information Sciences, Volume XXXVIII-5/W16, 2011
3. DATA COLLECTION
The 3D survey of the Telamon has been conducted through a laser scanner and a photogrammetric survey. A topographic survey has been also carried out to measure the 3D coordinates of some reflective target laser and some photogrammetric control points. The topographic survey has allowed to have all data in the same reference system. The topographic survey was carried out by a single station located in front of the Telamon using the total station without prism Leica TCR 307.
3.1 Laser scanning data acquisition
The laser scanning data acquisition has been performed with a Trimble (Mensi) GS200. This device is a TOF laser scanner with a Field of View of 360° in horizontal and 60° in vertical. It has a low beam divergence (<3 mm @ 50 m) and a typical accuracy of 1.4 mm at 50 m (1 σ with 99% albedo). On board video technology provides real-time true-colour acquisition. The Telamon is about 7.90 m height and about 2.40 m width; besides its surface has high curvature. So to cover adequately the entire statue it was necessary to do ten scan stations from a distance of about 10 m (Figure 5). Three scan stations were placed frontally, three on the right and four on the left of the Telamon (Figure 6).
Figure 4. Laser scanning data acquisition
The ten point clouds obtained with laser scanner have a very high spatial resolutions ranging from 3 mm to 5 mm and a high percentage of overlap. To merge in a single reference system all the scans twelve reflective targets were used. The targets were placed around the Telamon at different heights and depths (Figure 7). Moreover, it was made sure that all point clouds had at least three targets. The coordinates of the twelve reflective targets were measured with the total station.
Figure 6. Positions of the scan stations
Figure 7. Positions of the reflective targets
3.2 Photogrammetric data acquisition
The photogrammetric data acquisition was carried out using the ZScan system by Menci Software. ZScan system is a 3D scanning instrument for point cloud acquisition through a digital camera placed on a calibrated bar and a software for image matching. The images acquisition is performed translating the camera along a calibrated bar in three different positions with a known baseline. The maximum baseline between adjacent images is 45 cm. The ZScan system was planned for inexperienced users to easily generate point clouds from image triplets especially in architectural and cultural heritage surveys (Nex and Rinaudo, 2008).
In our works the system was equipped with a Nikon D80 digital reflex camera. This is a 10.2 Mega pixels CCD with a sensor size of 23.6 mm x 15.8 mm (3872 pixels x 2592 pixels) and a pixel size of 6.1 µm; the camera was equipped with a fixed focal length lenses of 28 mm. The camera was submitted to a calibration process in Menci Software labs.
The images were recorded from about 7 metres with a baseline of 60 cm (distance between the first and third image); the Ground Sample Distance (GSD) was equal to about 1.5 mm. Owing to the Telamon height a mobile iron structure with two elevations has been arranged to take photos of the whole Telamon (Figure 8). In all nine triplets from different heights and positions were taken for a total of 27 images; three triplets were taken frontally the Telamon, three on the left and three on the right.
During the photogrammetric data acquisition twenty-nine control points were measured with the total station. It was not possible to use artificial photogrammetric targets, only natural points on the front part of the Telamon were measured.
Figure 8. Photogrammetric data acquisition
4. DATA PROCESSING
The 3D data were processed in three different stages: in the first a 3D Model of the Telamon was obtained from laser scanning data. This model was used also for the structural analysis with FEM. In the second stage a 3D model was obtained from photogrammetric data using two different commercial packages. In the third stage the two photogrammetric 3D models were compared with the laser scanner 3D model to evaluate their differences.
4.1 3D Model from laser point clouds
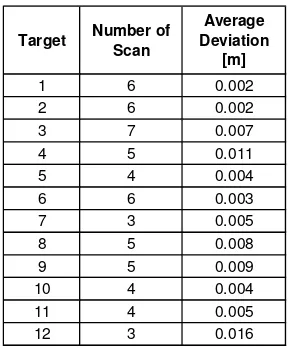
The first step to generate a 3D model from laser scanning data is the registration and the merge of all point clouds. The registration and the merge was performed automatically with Trimble software RealWorks Survey using the twelve reflective targets. Target-Based registration was done selecting one of the central scans (scan 5) as reference because it was the scan with more targets (12). The average deviation of the target position computed with Target-Based registration is shown in table 1. Some targets have residuals closeness or higher than 1 cm. To improve the Target-Based registration a Cloud-Based registration was performed registering two selected scan stationsat a time. Also in this case all the scans were registered as regards the scan 5 (reference scan); the registration process was executed only in refine mode by using the common parts of
the point clouds. The average residual of this process was 3 mm and the visually check have not showed any problems in registration. After registration the scans were geo-referenced to the topographical coordinate system assigning the topographical coordinates to the corresponding targets. The standard deviation of geo-referencing using only 8 targets was of about 2 mm.
Target Number of
Table 1. Average deviation of the target in Target-Based registration
The scans were merged all together and all unnecessary points were eliminated to obtain an unordered point cloud of about 3,500,000 points with a point density of about 2 ÷ 3 mm. The point cloud was exported to be processed with Geomagic Studio.
To reduce the number of points the point cloud was sampled with a uniform point density of 4 mm; in this way we have obtained a point cloud of about 1,400,000 points. This approach has two advantages: reduces the model size in terms of number of points, resulting in a small file size, and removes overlapping points lead to redundant information that is only useful for the alignment step (Guarnieri et al., 2004).
Before triangle meshing some different filter functions were tested in order to eliminate still further outliers and scanning noise from sampled point cloud. Then the point cloud was converted in a mesh of about 2,800,000 triangles.
The mesh had a very high level of detail but had also some holes in the upper areas due to the shape and the position of the arms near the head of Telamon. This part was hard to detect as regards the scan station. With the fill hole functions, it was possible to reconstruct the missing parts of the mesh (Figure 9).
Figure 9. Fill holefunctions for the upper part of the Telamon
To check the accuracy of the 3D model a comparison between the 29 photogrammetric control points, detected with the topographical survey on the surface of the Telamon, was carried out. The comparison was done only for Y coordinates that corresponding with the direction perpendicular to the front of the Telamon (Figure 10). The standard deviation between the coordinate Y of the control points and the corresponding value calculating on the 3D model was of 3.5 mm.
Figure 10. Laser scanner point cloud
The 3D model was closed with vertical plane for the back and was used as reference for comparison with the photogrammetric data and as 3D model for structural analysis.
The many uncertainties about what were the real position and real structural role of Telamon could be investigated using the laser scanner 3D model. But to perform a FEM analysis the laser scanner 3D model should be significantly reduce with a polygonal decimation of the mesh. This data reduction was a necessary step because FEM packages currently available on the market are not optimized to manage large amounts of polygons (Camarda et al., 2010).
Several tests were made to evaluate the right percentage of polygonal decimation to have an optimal compromise between a model geometrically correct and a model with few polygons. Some studies performed to integrate in 3D city model laser scanner 3D model show that a 3D model of a monument with 800,000 polygons can be reduced by 10% (80,000 polygons) without a significant loss of accuracy (Kersten, 2010). In our work the laser scanner 3D model was more detailed (about 2,800,000 polygons) so we tested a curvature-based polygonal decimation with Geomagic of 5%, 3% and 1% (Table 2).
Mesh Number of
Triangles
File Size (MB)
3D Model 100% 2,854,382 115
3D Model 5% 142,719 5
3D Model 3% 85,631 3
3D Model 1% 28,543 1
Table 2. Polygonal decimation of the 3D Model
To check the variation of accuracy as regards the decimation rate, the original 3D model was compared to the resampled models. While the file size was reduced proportionately, the geometrical accuracy has changed just a little. The standard deviation and the maximum deviation were calculated in a 3D comparison between original model and resampled models. The results for 5% and 3% resampled models was almost the same; in 3D comparison between original and 1% versions the standard deviations were already higher by a factor of 3 (Table 3). The maximum deviations vary from 1.7 cm for 5% version to 27.6 cm for 1% version. So only polygon decimation until 3% could be achieved for the Telamon without significantly losing geometrical and visual quality.
St. Dev. [m]
Maximum deviation
[m]
3D Model 100% 3D Model 5% 0.001 0.017
3D Model 100% 3D Model 3% 0.001 0.039
3D Model 100% 3D Model 1% 0.003 0.276
Comparison
Table 3. Statistical values of the comparison between original 3D Model and resampled Models
4.2 3D Model from photogrammetric data
The 3D model from photogrammetric data was obtained using the ZScan software and Image Master Photo software.
The ZScan system besides the digital reflex camera, the high accuracy slide bar and professional tripod is based on software for very dense image matching. The computational times are usually moderate (a standard pc can elaborate about 800 3D points per second) per image triplet with a matching step of 3 pixels (Nex and Rinaudo, 2008). More than one triplet can be processed in the same project. The ZScan software workflow is almost fully automatic and is divided into the following steps: import of the triplet, resampling of the images to produce images undistorted (images without radial and tangential distortion), entry of the value of the baseline, images rectify to correct shot alignment imperfections due to bar or tripod micro movements, definition of “area of interest” and of 3D model resolution, 3D model generation (Figure 11).
Every point cloud is produced in an independent reference system; to relate several models in the same reference system and to increase the geometric 3D model quality is possible to use some photogrammetric control points.
Z
Y
X
Figure 11. Screen-shot of ZScan software
The theoretical accuracy of ZScan software is calculated by the following formula (Kraus, 1993):
pi y
B
c
Y
σ
σ
⋅
=
2
where c = focal length Y = taking distance B = baseline
σy= RMS in depth
σpi= RMS in image point position
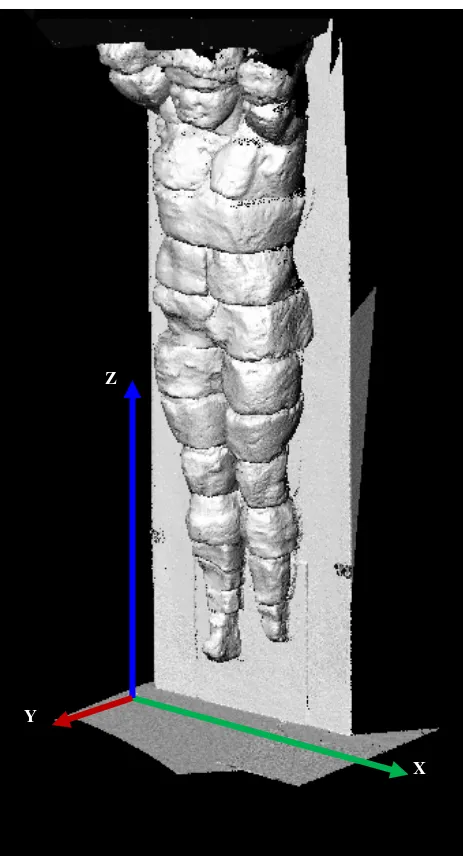
For our work we used all nine triplets available and the photogrammetric control points measured with total station. The theoretical accuracy, considering σpi= 0.5 pixel, was ±8.7 mm. The 3D model resolution has been set equal to 3 pixels (about 4.5 mm) and the generation has taken about 8÷10 minutes for each point cloud. The final point cloud has about 2,300,000 points (Figure 12).
Figure 12. ZScan 3D Model
The same images used with ZScan software were processed with Image Master Photo. This software perform 3D measurement from stereo images, generate 3D models and orthoimages.
From the 27 available images we have obtained 18 stereo-pairs. The images orientation has been carried out by a bundle adjustment using the photogrammetric control points. On the whole seventeen points were used; nine how control points and eight how check point. The bundle adjustment standard deviation was 1.5 mm for control points and 6.5 mm for check points. Some tests made possible the generation of a 3D model with a resolution of 0.5 mm, similar to ZScan software, but the computation time was too long. So the 3D model has been generated with a resolution of 1 cm. Due to the size of the object and to the high density of the points, it was necessary to generate 3 clouds: one for the front part, one for the right side and one for the left side. Nine stereo-pairs for the front part and six for the right left side were used. Moreover some breaklines, measured stereoscopically in the lower part of the statue, were included in 3D model generation. The 3D model obtained from Image Master Photo has about 185,000 points (Figure 13).
Figure 13. Image Master 3D Model
4.3 Comparison
The aim of the 3D comparison is to show how the two techniques (laser scanning and photogrammetry) provide similar qualitative and metrics results. The comparison between meshes has been done with the software Geomagic Qualify. The reference model was the laser scanner 3D model.
Therefore, for a more equal comparison in terms of the number of points and level of detail the laser scanner point cloud and the ZScan point cloud were resampled with a constant step of 1 cm.
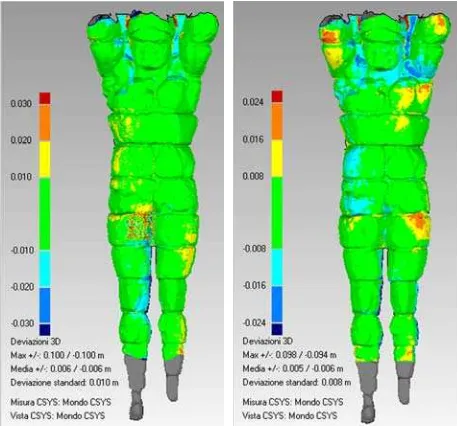
The most significant statistical values were calculated (mean distance, standard deviation and maximum deviation). As shown in the table 4 the mean differences between laser scanner data and photogrammetric data are null, confirming the lack of systematics errors and the goodness of geo-referenced process to the topographical coordinate system. The standard deviation is around 1 cm for both 3D models (ZScan and Image Master Photo). For ZScan the value is very similar to the theoretical accuracy. The maximum deviations are quite high and point out the presence of problematic areas for the image matching International Archives of the Photogrammetry, Remote Sensing and Spatial Information Sciences, Volume XXXVIII-5/W16, 2011
(Table 4). In particular, the figure 14 shows a 3D colour-coded mapping of the differences.
Mean
3D Model -0.001 0.010 0.100
Laser Scanner 3D Model
Image Master
3D Model 0.000 0.008 0.098
Table 4. Statistical values of the comparison between Laser Scanner 3D Model and Photogrammetric 3D Models
Figure 14. Colour-coded mapping of the comparison between Laser Scanner 3D Model and ZScan 3D Model (on the left), Image Master 3D Model (on the left)
5. CONCLUSIONS
The paper presents the results of the 3D survey of the Telamon of the Temple of Olympian Zeus in Agrigento (Italy). The survey has been carried out to obtain a 3D model with a very high level of detail for digital documentation and a 3D model with low level of detail (smallest possible data volume) to use for a structural analysis with a FEM.
The 3D survey was performed using RBM and IBM. The RBM has been carried out with a TOF laser scanner. The 3D model, achieved with RBM, has a point density of 4 mm and a very high accuracy, about 3.5 mm, very close to the typical accuracy of the laser device used. This model was used as a reference model to generate the model with a low level of detail and to evaluate the accuracy of the IBM 3D model.
The model with a low level of detail was generated by polygon decimation. By tests performed only polygon decimation until 3% could be achieved for the Telamon without significantly losing geometrical and visual quality.
The IBM has been carried out using ZScan system for data acquisition and ZScan software and Image Master software for data processing. Two different 3D models were computed. The comparison with the laser data shows that metric precision achieved in the calculation of the 3D model is very close to that obtained by 3D laser scanner.
The accuracy achieved (in the order of 1 cm) represents a good result and are acceptable for many applications in the preservation and documentation of cultural heritage.
Some problems still remain in limited areas where the image matching does not provide reliable results.
ACKNOWLEDGEMENT
The research team of University of Palermo that is carrying out the study on the Telamon of the Temple of Olympian Zeus in Agrigento (ITALY) is composed by S. Piazza for historical issues, S. Benfratello for structural analysis, F. Agnello and M. Lo Brutto for 3D survey.
Laser and photogrammetric data acquisition was carried out in collaboration with F. Agnello and M. Cannella.
The work presented in this paper was developed within the research project “Advanced methodologies for survey, documentation and visualization of Cultural Heritage”, supported by MURST (Italian Ministry of University and Research), as a Project of Relevant National Interest (PRIN2008). Local coordinator: Prof. Mauro Lo Brutto (University of Palermo). National Coordinator: Prof. Raffaella Brumana (Politecnico di Milano).
REFERENCES
References from Journals:
Remondino, F., El-Hakim, S., 2006. Image-based 3D modelling: a review. Photogrammetria, 21(115), pp. 269-291.
References from Books:
D’Angelo, D., Moretti, S., 2004. Storia del restauro archeologico appunti. Alinea, Firenze, pp. 106.
Kraus, K., 1993. Photogrammetry. Volume I, Fundamentals and Standard Process. Ferd dummler Verlag. Bonn, Germany.
References from Other Literature:
Barazzetti, L., Remondino, F., Scaioni, M., 2010. Automation in 3D reconstruction: results on different kinds of close range blocks. In: The International Archives of the Photogrammetry, Remote Sensing and Spatial Information Sciences, Commission V Symposium, Newcastle upon Tyne, UK, Vol. XXXVIII, Part 5, pp. 56-61.
Camarda, M., Guarnieri, A., Milan, N., Vettore, A., 2010. Health monitoring of complex structure using TLS and photogrammetry. In: The International Archives of the Photogrammetry, Remote Sensing and Spatial Information Sciences, Commission V Symposium, Newcastle upon Tyne, UK. Vol. XXXVIII, Part 5, pp. 125-130.
Guarnieri, A., Remondino, F., Vettore A., 2004. Photogrammetry and Ground-based Laser Scanning: assessment of metric accuracy of the 3D Model of Pozzoveggiani Church. In Proc. of FIG Working Week 2004, “The Olympic Spirit in Surveying”, Athens, Greece, 22-27 May 2004.
Kersten, T.P., 2010. 3D Scanning and Modelling of the Bismarck Monument by Terrestrial Laser Scanning for Integration into a 3D City Model of Hamburg. In: Digital Heritage, Third International Conference, EuroMed 2010, International Archives of the Photogrammetry, Remote Sensing and Spatial Information Sciences, Volume XXXVIII-5/W16, 2011
Lemessos, Cyprus, November 8-13, 2010, M. Ioannides, D. Fellner, A. Georgopoulos and D.G. Hadjimitsis (Eds.), Springer Link, Lecture Notes in Computer Science, Volume 6436, pp. 179-192.
Nex, F., Rinaudo, F., 2008. Multi-image matching: an “old and new” photogrammetric answer to lidar techniques. In: The International Archives of Photogrammetry, Remote Sensing and Spatial Information Sciences, Beijing, Vol. XXXVII part B5, pp. 621-626.
Remondino, F., Menna, F., 2008. Image-Based surface measurement for close-range heritage documentation. In: The International Archives of the Photogrammetry, Remote Sensing and Spatial Information Sciences, Beijing, Vol. XXXVII, Part B5, pp. 199-206.