SCALABLE MULTI-PLATFORM DISTRIBUTION OF SPATIAL 3D CONTENTS
J. Klimkea
, B. Hagedorna
, J. D¨ollnera
a
Hasso-Plattner-Institut at the University of Potsdam, Prof.-Dr.-Helmert-Straße 2-3, 14482, Potsdam, Germany {jan.klimke, benjamin.hagedorn, doellner}@hpi.uni-potsdam.de
KEY WORDS:Virtual 3D City Model, Mobile 3D Visualization, Web-Based 3D Portrayal, Image-Based Rendering, Tile-Based Provisioning
ABSTRACT:
Virtual 3D city models provide powerful user interfaces for communication of 2D and 3D geoinformation. Providing high quality visualization of massive 3D geoinformation in a scalable, fast, and cost efficient manner is still a challenging task. Especially for mobile and web-based system environments, software and hardware configurations of target systems differ significantly. This makes it hard to provide fast, visually appealing renderings of 3D data throughout a variety of platforms and devices. Current mobile or web-based solutions for 3D visualization usually require raw 3D scene data such as triangle meshes together with textures delivered from server to client, what makes them strongly limited in terms of size and complexity of the models they can handle.
In this paper, we introduce a new approach for provisioning of massive, virtual 3D city models on different platforms namely web browsers, smartphones or tablets, by means of an interactive map assembled from artificial oblique image tiles. The key concept is to synthesize such images of a virtual 3D city model by a 3D rendering service in a preprocessing step. This service encapsulates model handling and 3D rendering techniques for high quality visualization of massive 3D models. By generating image tiles using this service, the 3D rendering process is shifted from the client side, which provides major advantages: (a) The complexity of the 3D city model data is decoupled from data transfer complexity (b) the implementation of client applications is simplified significantly as 3D rendering is encapsulated on server side (c) 3D city models can be easily deployed for and used by a large number of concurrent users, leading to a high degree of scalability of the overall approach. All core 3D rendering techniques are performed on a dedicated 3D rendering server, and thin-client applications can be compactly implemented for various devices and platforms.
1 INTRODUCTION
Virtual 3D city models provide powerful user interfaces for com-munication of 2D and 3D geoinformation. Through “the contin-uing desire for more detail and realism, the model complexity of common scenes has not reached its peak by far” (Jeschke et al., 2005), which makes providing high quality visualization of massive 3D geoinformation in a scalable, fast, and cost efficient manner still a challenging task.
Today’s systems for mobile or web-based visualization of virtual 3D city models, e.g., Google Earth, Apple Maps, or here.com, mostly rely on streaming 3D geometry and corresponding tex-tures to client devices. In this way, the applications running on those devices need to implement the whole rendering part of the visualization pipeline (Haber and McNapp, 1990), i.e., tion of images from computer graphic primitives. The rasteriza-tion process is a resource intensive task, which requires special-ized rendering hardware and software components. Rendering performance and their requirements regarding CPU, GPU, main memory, and disk space, strongly depend on the complexity of the model to be rendered. Further, high-quality rendering tech-niques, e.g., for realistic illumination, shadowing, or water ren-dering, increase the resource consumption that is necessary to provide users with interactive frame rates (more than 10 frames per second). This makes it very hard to develop applications that adapt to different hardware and software platforms while still pro-viding a high-quality rendering and an acceptable frame rate also for large 3D datasets. Building a fast, stable application that ren-ders large 3D models in high quality on a variety of heteroge-neous platforms and devices, incorporates a huge effort in soft-ware development and maintenance as well as data processing, which usually raises with the number of different platforms to be
supported.
Approaches for image-based 3D portrayal introduced recently (Doellner et al., 2012) tackle these problems by shifting the more complex and resource intensive task of image synthesis to the server side, which allows for interactive thin client applications on various end user devices. Such clients canreconstruct light-weight representations of the server side 3D model from server-generated G-Buffer images (i.e., multi layer raster images that not only encode color values, but also other information like depth, etc.). Image-based portrayal provides two major advantages com-pared to geometry-based approaches: a) They decouple the ren-dering complexity on client side from the model complexity on server-side and b) they allow to deliver a homogeneously high rendering quality to all end user platforms and devices, regard-less of the 3D capabilities of these devices. Nevertheregard-less, the operation of such visualization applications needs a 3D rendering service to generate these image-based representations of the un-derlying 3D model. This makes scaling the applications for many simultaneously used clients a complex and relatively expensive task, since each service instance can only effectively serve a lim-ited number of clients.
In this paper we introduce a novel approach for provisioning of massive, virtual 3D city models on different platforms (web brow-sers, smartphones, tablets) by means of an interactive map show-ing synthetic, tiled images of the 3D city model (oblique map). The key concept is to synthesize these oblique views in a prepro-cessing step by a 3D rendering service, to store the corresponding tiles, e.g., on a web server, to be easily accessible and usable by client applications (Figure 1). Different stylizations, combina-tions of thematic layers, map layers, and viewing direccombina-tions can be specified and applied for the tile generation process, leading
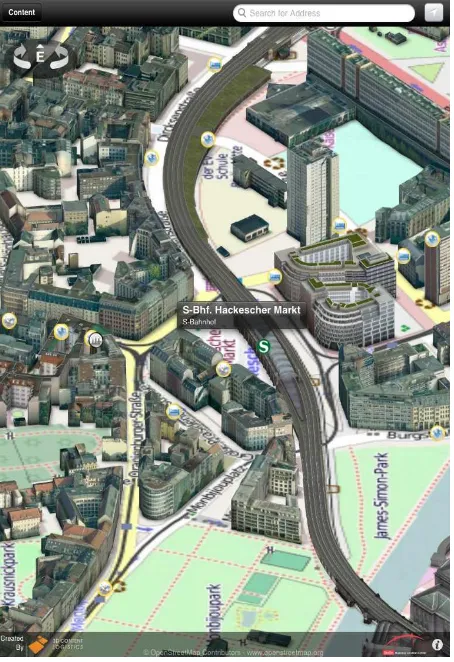
Figure 1: Screenshot of the iOS-AppsmartMap Berlinfrom our case study. The App’s user interface is kept simple: Users can use zooming and moving gestures known from 2D map interfaces. Further an interaction item on the upper left provides stepwise rotation.
to multiple tile sets, each storing not only a RGB images but also additional information such as world coordinates, depth informa-tion, surface normals, object identities or thematic information (G-Buffer). Client applications can use the additional informa-tion, e.g., for object-based interaction or additional client-side rendering effects such as object highlighting. In particular ob-ject identity information allows client applications to set up to application specific functionality, e.g., to retrieve object-based in-formation from a remote server.
Compared to existing mobile 3D geovisualization solutions, the presented approach scales far better for large numbers of simulta-neously active users as the computationally expensive task of 3D rendering of large-scale datasets is shifted from application run-time to a preprocessing step, generating the oblique views of the 3D scene as image tile sets. These image tiles can be deployed, stored, and accessed easily using, e.g., conventional web servers or cloud storage services, which are able to easily scale with the number of concurrent users. This approach, however, restricts the way users can interact with the 3D scene; It is generally knows that map-based access its the most efficient wa to explore and analyze spatial information. Our oblique map approach supports map-based interactions, but is restricted in terms of 3D camera control.
The remainder of this paper is organized as follows. Section 2 provides an overview of fundamentals and related work in service-based and image-service-based 3D portrayal. Section 3 presents the
over-all concept and architecture of our approach and solution. Sec-tion 4 briefly outlines the automated generaSec-tion of applicaSec-tion datasets. Section 5 gives a short overview of map styling an con-figuration functionality. Section 6 introduces “smartMap Berlin“ – a case study in the field of real-estate marketing and city infor-mation systems. Section 7 discusses and evaluates our approach and implementation of a tile-based 3D map for massive, virtual 3D city models. Finally, Section 8 highlights possible next steps.
2 FOUNDATIONS AND RELATED WORK
A set of web standards and formats (e.g., WebGL, X3D, X3DOM) tackle the demand for plugin-free 3D rendering in web browsers and form the basis of several approaches and solutions in this field (Prieto and Izkara, 2012, Gesquire, 2012, Christen et al., 2012). These approaches utilize transferred 3D geometry and textures for rendering. This makes rendering large models a re-source intensive task for client devices. While the camera inter-action is relatively unrestricted (free exploration of 3D model), these approaches are limited in terms of the implementation of high-end rendering techniques. In order to maintain compatibil-ity to a large range of client hardware (different desktop graph-ics, different mobile devices) and software (WebGL capabilities of different web browsers) the ability to stylize the underlying model is limited. Also the size and complexity of 3D data that can be rendered in interactive frame rates is restricted by the client’s hardware. In contrast, our approach of a tile-based oblique 3D map, performs styling in a preprocessing step and by a dedicated high-performance 3D rendering service. As the computational and memory capabilities required on client side do neither de-pend on the model size nor on the complexity of the rendering technique applied, this approach provides a solution for the dis-tribution of massive 3D models in the same graphical quality and expressiveness on all devices.
In recent years, several approaches for visualization of massive virtual 3D city models on mobile devices or web browsers have been published. D¨ollner et al. (Doellner et al., 2012) provide an approach using an image-based portrayal service to generate sev-eral image layers (e.g., color, depth information, and object iden-tity) of a complex virtual 3D city model, that are transferred to a client application running on mobile devices. A corresponding client uses the images generated for a specific point of camera to create a lightweight reconstruction of the server-side model using either a cube map or geometry derived from the depth im-age delivered by the server. The client application in connection with the 3D rendering service allows users to configure the visu-alization of the server-side 3D model data to match their needs in terms of data selection and styling. Generally, this approach does not apply very well for a large number of concurrent users be-cause service responses can hardly be cached due to the manifold combinations of styling options and due to the fact, that the vir-tual camera is not restricted but can be positioned at anytime and anywhere in the 3D environment. The approach presented in this paper combines the possibility to create preconfigured visualiza-tions (in terms of data selection and styling) with an near optimal cacheability for single image tiles on server and client side.
Examples of tile-based 3D oblique maps for web browsers are created, e.g., by the Chinese companies edushi.com1and Dushi-quan2, which provide access to very detailed virtual 3D city
mod-els of Chinese cities. Besides high-quality (and comic-like) visu-alization, these maps provide client-side highlighting of objects
1
http://sh.edushi.com
2
http://bj.o.cn
(e.g., buildings or areas) as well as information retrieval for se-lected objects. Nevertheless (as reported in Internet articles and forums) these virtual cities are mainly crafted manually based on existing maps and satellite imagery. This means a rather low de-gree of automation in the creation and update process of these maps and implies a rather high effort for keeping the model up-to-date. Also, this provides only limited possibilities for creating custom-styled maps, e.g., for specific use cases or users, and for the creation of different variants of the maps, e.g., maps from a different viewing direction and viewing angle or maps with dif-ferent building variants. Possibly due to this, users cannot ad-just the map orientation of these maps, which also limits the 3D impression of the overall application. In contrast, the project osm2world3 uses a much more automated approach for gener-ating tiled image views from publicly available OpenStreetMap data. From this (still rather 2D data), 3D building geometry is automatically derived; then, oblique map tiles are rendered based on OpenGL or a POVray raytracing backend. The correspond-ing viewer client allows users to rotate the view in four steps, but currently does not provide object-based interaction and data re-trieval. Both of the solutions presented do not offer a solution for a native user experience on mobile devices, while we target those devices explicitly to consider the increasing importance of such devices. Compared to the systems presented above, our ap-proach focuses on automation of processes as well as providing a high graphical quality for image tiles through implementing state of the art rendering techniques in the rendering service. Also, we focus on supporting complex and “real-world” 3D geodata by handling huge 2D and real 3D geodata (including geometries, textures, thematic information, object attributes) and combining the virtual 3D city model with additional information sources.
Service-oriented architectures(SOA) (Papazoglou et al., 2007), as a paradigm for design and development of distributed informa-tion systems, represent a common approach to address these chal-lenges. 3D geovisualization systems, based on the SOA paradigm, encapsulate resource intensive tasks, such as management, pro-cessing, transmission, and rendering of massive 2D and 3D geo-data as services that can be reused by various client applications (Basanow et al., 2008). Thus, client applications do not need to implement such functionality, but can reuse this functionality im-plemented through services. While 2D geovisualization systems can rely on standardized and robust services such as the Web Map Service (WMS), specified by the Open Geospatial Consortium (OGC), only first approaches and implementations for service-based 3D geovisualization have been suggested. The Web 3D Service (W3DS) (Schilling and Kolbe, 2010) supports streaming of 3D scenes (i.e., 3D geometry and corresponding textures) to client applications, which implement the rendering processes on client-side. The Web View Service (WVS) (Hagedorn, 2010) in-stance implements the complete 3D rendering process on server side, encapsulating the complexity of 3D geodata management, processing, and rendering. The two alternative approaches for 3D portrayal services are currently undergoing an effort within the OGC to harmonize them and to provide a common base for ser-vice interfaces. A WVS compliant rendering serser-vice is the core part of our preprocessing pipeline for generating orthographic views out of 3D city model data. Due to the standards-based (WVS is currently a discussion paper within the OGC) service interface, we are able to exchange service implementations and utilize third party remote services for tile generation.
3
http://osm2world.org
3 CONCEPT
The key concept of our approach is to synthesize tileable, oblique views on a given virtual 3D city model by a 3D rendering service in a preprocessing step. This 3D rendering service encapsulates all aspects related to 3D rendering of massive, complex struc-tured, heterogeneous 2D (e.g., terrain map layers) and 3D (terrain data, textured building geometry) geodata. This way, we decou-ple all the comdecou-plexity related to processing, management, and rendering of 3D geodata from client applications and addition-ally from the capabilities of servers, that provide data for client applications at runtime. A major advantage of this is the ability to select the contents of an oblique view as well as its stylization to match the purpose of a specific application. In our approach, the geographical spaces is separated into numbered tiles in dif-ferent zoom levels, in analogy to existing tiling schemes such as Time Map Service or WMS-T. Each tile of an oblique dataset (a map layer of the oblique map in a certain direction) has a unique key that consists of three components: the tile zoom level, the tile number in horizontal axis, and the tile number in vertical axis of the geographical coordinate system. Each image tile is cover-ing a spatial extent that is defined by these components. Servcover-ing image tiles to client applications only needs a conventional web server or a cloud storage services implementing a key value store. This allows the approach to scale to a large number of concurrent users fetching tiles in parallel, since scaling the network-based delivery provisioning of files to client applications can easily be achieved. Oblique views (Figure 3) are generated for different viewing directions (currently the four principal directions) allow-ing a stepwise rotation of the view by clients through exchangallow-ing the underlying image dataset (map layer). Minimal implemen-tations of client applications do only need capabilities to fetch image tiles via HTTP and display them, therefore they can be can be very lightweight. Such client applications can easily be imple-mented on mobile platforms (i.e., smartphones or tablets) or plu-gin free (based on JavaScript) on web browsers. They provide a map-like user interface (also calledSlippy Map) for exploring the city model visualization allowing users to shift the map center, to change zoom levels and to rotate the overall view into one of the directions that were pregenerated by the 3D rendering backend beforehand.
The map-based approach implies a simple and intuitive interac-tion, focusing on navigation the 3D and avoiding the difficulties of a completely free 3D user interaction, in which a user gen-erally has to manage six degrees of freedom. Most tasks, such as exploring a certain area, do not require this full 3D camera control. Up to a certain degree of necessary detail, the provided interaction is regarded sufficient. This way, users are able to ex-plore the virtual 3D city model and connected data sets using a well established interaction paradigm.
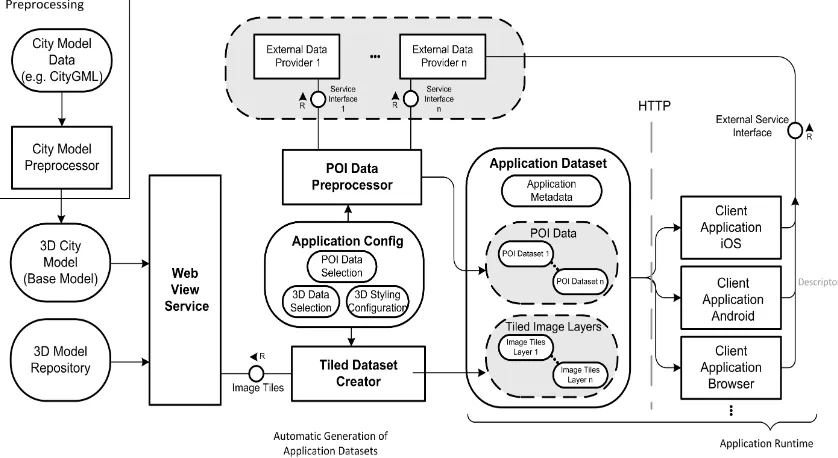
In order to provide use-case specific thematic information, an ap-plication configuration, that is consumed by more generic client applications allows to define a set of information items that are included in each generated map application. Several kinds of thematic data can be integrated into one application. Beside con-ventional items, such as point of interest (POI) information and 2D shapes (e.g., roads or public transport lines), applications are able to connect server-side information belonging to specific fea-tures in a model to pixels displayed in the front-end application (see 3.2 for details). An overview over the whole architecture for generating the necessary application datasets (oblique map lay-ers, harmonized POI data, and configurations for generic client applications) is provided in Figure 2
Figure 2: An overview of the system for automated generation of application datasets from different data sources as FMC block diagram5. 3D city models where imported in a render optimized form into the rendering service. Application datasets, that define contents (oblique map tiles, POI data, and external service URLs to be used) and behavior (e.g., which url to load on tap for POI items) are generated for being consumed by client applications.
3.1 Generating Tile Datasets from 3D City Model Data
Image tiles are generated using a 3D rendering service that imple-ments the complete 3D rendering process for massive, heteroge-neous 3D models. In particular we focus on CityGML (Gr¨oger et al., 2012) as standard format for city model, since “CityGML is a common information model for the representation of 3D urban objects“ (Mao, 2011). The thigh integration of 3D geometry, ap-pearance (materials and textures), and detailed models for object semantics make CityGML a promising base data source for appli-cations. Further, the rendering service is able to integrate a broad range of other 3D formats for 3D data, e.g., KML/Collada, 3DS, OBJ, or the ShapeFile format. Since usual 3D geodata formats are designed for effective data exchange and not for efficient 3D rendering, the source data has to be converted into a rendering optimized form. The data import is implemented in a prepro-cessing tool that merges the geometry from the source model that usually has a very fine grained structure, into geometry batches each containing approximately 150,000 triangles, which can be efficiently processed by modern 3D graphics hardware. Render-ing geometry with large amounts of individual textures is usu-ally a very inefficient procedure, since the rendering state needs to be changed every time a different texture needs to be used. We address this issue by merging all model textures into a single texture atlas in order to optimize the rendering performance and minimize necessary texture switches. Modern graphics hardware only supports textures with a maximum of 16384 x 16384 pix-els. The texture atlas created during preprocessing of large, fully textured virtual 3D city models, like the one generated from the Berlin 3D city model, are usually far bigger than this value. To address this problem, we implement aVirtual Texturing (Lefeb-vre et al., 2004) technique that enables the rendering system to manage nearly arbitrary sized texture atlases and render those models efficiently. The 3D rendering service implements a Web View Service interface (WVS) for querying images of 3D model data. As all core 3D rendering techniques are implemented and performed on a dedicated 3D rendering server, there are no
multi-platform issues regarding the stability and implementation of the 3D rendering techniques for specific client hardware.
3.2 Access of 3D City Model Data
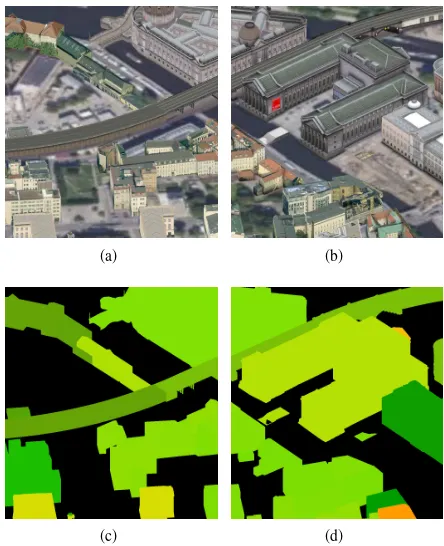
A client application integrates application specific spatial and geo-referenced datasets. Connecting application data with the virtual 3D city model and its visualization is essential for building use-ful applications based on virtual 3D city models as it opens up the CityGML-based virtual 3D city model as integration platform for feature-based 2D and 3D geodata. The rendering backend used for generating color image tiles is also used to render object ID images (see Figure 3 (c) and (d) for example tiles). Here it fol-lows the G-Buffer concept (Saito and Takahashi, 1990, Akenine-M¨oller T. and N., 2008), well known in the 3D rendering do-main, that allows to create several rasterized information layers per pixel. In this way, additional attributes can be encoded in images on a per pixel basis. Object ID images, as one type of such information, assign an identification color per object that is unique for this server and 3D city model. The components of the color of a pixel encode an integer number that can be used to ac-cess data connected to the feature at a pixel position. A mapping between object id and feature id (the database identifier of the underlying feature dataset) is stored on server side. The object id number is assigned by the rendering service during the im-port of the model elements for rendering (i.e., CityGML datasets or planning models). Using this simple mapping, a connection can be made between pixels of image tiles and feature data in the database. An application server holding the feature data in a database is able to generate a response for given object IDs (values extracted from object ID images for specific positions) or feature IDs (feature identifiers within the database) that contain generically structured data, containing named attribute groups and corresponding attributes for request. The requested attribute groups can be configured via an URL parameter. By using such
5
Seehttp://www.fmc-modeling.org/quick-intro
(a) (b)
(c) (d)
Figure 3: Examples for corresponding image tiles generated by the tileable color (subfigure a) and b) ) and corresponding ob-ject map images (subfigure c) and d). The obob-ject id images al-lows client applications to connect each pixel position of the color image to an underlying backend data object in order to connect client side visualization with backend data.
a generic approach as default behavior, we are able to implement the presentation code in client applications also in a generic way of providing feature attribute lists or server-generated HTML to users. More specific applications can be implemented using ex-ternal reference attributes leading to connected data sources de-livering more specific data in specialized formats.
3.3 Application Contents
We distinguish two kinds of data to be integrated, regarding their update frequency: (a) data that changes frequently or has to be up-to-date in order to keep the application useful (e.g., vehicle positions, sensor values, etc.) and (b) data that changes mostly infrequent or whose update date is not very relevant (e.g., in-frastructural data, POIs, or landmarks). Data that changes infre-quently is harmonized to a common internal data format that is optimized for data size and adjusted to the capabilities and needs of client applications. Further, the geo locations of geometries are translated into a common geographical coordinate system in order to keep client applications as simple as possible. In this way, data formats that are consumed directly by client applica-tions can be reduced to a minimum while keeping the size of the data that has to be transferred minimal. This means, e.g., to avoid transmission of unused attributes or to aggregate data into one document which would otherwise need several client requests to a remote server per item that would imply additional overhead for data transmission and decoding on client side. The necessary ser-vice and format adaptors are implemented as configurable scripts that are executed regularly in order to keep the server-side appli-cation data as up-to-date as it is desired.
Client-side service adaptors are used for frequently changing data or other data that should be updated at runtime, such as real time traffic data, object locations, or sensor values. The services that
provide this kind of data are queried directly by client applica-tions in order to fetch the most up-to-date data that is available. Client-side caching is the only way of optimizing the amount of data that is transferred for this type of data, which allows users to control how often the services are queried. Since we cannot influence the format and complexity of the information delivered by 3rd party services, there can be a significant data overhead between the data needed for immediate visualization on the map and the data that is provided by a service. Further, the service response time for 3rd party data, which contributes significant parts to a user’s subjective impression of the overall application performance, may vary significantly.
Another type of application specific data is additional 3D data that can be displayed in client applications, e.g., alternative plan-ning models or visualization of specific areas in the curse of time. This is implemented using pregenerated map overlays for the af-fected areas that can be activated or deactivated in client applica-tions. The image tiles of the base model are exchanged against the alternative ones covering the same area as transparent or opaque overlay. The same client-side mechanism applies for changing the styling of the map that is described in more detail in Sec-tion 5.
4 AUTOMATED GENERATION OF APPLICATION DATASETS
For a cost efficient provisioning of customized mobile and web-based applications web-based on massive, information rich virtual 3D city models, we implemented a configurable process, that gener-ates application datasets and configuration files for generic client applications. These files are encoded in JavaScript object nota-tion (JSON6), which is easy to use an implemented for different target platforms (we developed a browser-based variant, as well as native applications for Android and iOS). They contain all the information that is specific for the area of interest and the appli-cation use case (e.g., POI-Data, custom map overlays, etc.). The overall process is running automatically in large parts, including the import of 3D city model data into the rendering service, gen-eration of oblique map tiles, and creation of according templates for application configuration files. In this way, application data can be regenerated, respectively updated efficiently.
The overall application configuration that is used for generating application specific datasets is decided into two parts: The def-inition of tile sets and the defdef-inition of POI datasets to prepare per application. The generation process for tile datasets can be parameterized in several ways. First, a list of tile sets is defined, each defining the 3D model data and its style.
The application metadata is consumed by client applications to configure their map contents and their interactive behavior (e.g., URL to fetch upon touch/click a map icon). Map content defi-nition primarily contains the URL for tiles of map layers. Since map layers may either be base layers, covering the whole area of interest, or additional overlay layers that can optionally be added or removed on top of base layers.
5 MAP STYLING AND CONFIGURATION
Custom application-specific styling of a 3D view is one of the core advantages of our approach. In contrast to other solutions
6
http://json.org/
for mobile and web-based visualization of large scale geodata, our solution is based on synthesized views on 3D city model data instead of providing the 3D geodata (respectively textured geom-etry) itself to client applications. Here, the data displayed on a map can be selected fine grained way. There is a wide range of options ranging from including or omitting single features to the replacement of complete area by planning variants in order to vi-sualize planned scenarios, e.g., in a public participation applica-tion. Using our rendering system specific stylings can be applied to complete views as well as for selected model elements (e.g. for drawing a user’s attention to certain regions of interest in specific zoom levels).
One of the most influencing parts of the visualization for oblique map tiles is the underlying terrain map. Depending on the pur-pose of an application, the terrain map can communicate different kind of information. Therefore, selection of rendered terrain map layers is on of the key decisions when defining a styling for an oblique map layer. The rendering service is able to integrate ter-rain map layers from accessible WMS instances over the network or local maps that have been deployed to the rendering server ma-chine previously.
Further, maps with different representations of the 3D data de-pending on the current zoom level could be generated. Examples for promising approaches for view dependent stylization of vir-tual 3D city models were provided, e.g., by Semmo et al. (Semmo et al., 2012) or Pan et al. (Pan et al., 2013). By emphasizing fea-tures that are important for orientations on larger scales (also by partially moving from 3D to 2D representations) and providing a detailed 3D visualization on smaller scales, such techniques can help to improve a users perception and orientation in virtual 3D city models. This stylization is currently not implemented within the rendering service, but provides a promising option for provid-ing a new type of high quality 3D visualization to broader user basis.
6 CASE STUDY - REAL-ESTATE MARKETING
I our case study we have built the application “smartMap Berlin“ (Figure 1) targeting a use case in the area of business real-estate marketing. Our cooperation partner “Berlin Partner GmbH“ ducts the city marketing for the city of Berlin and y provides con-sulting services for companies interested in settling in the Berlin metropolitan region. Since finding a real-estate property that fits a company’s needs is one of the major challenges, their real-estate portal offering numerous real-estate properties in different cate-gories is a major part of their services.
The virtual 3D city model of the of Berlin is one of the largest and most complete city models in the world. It covers the whole urban area of Berlin that consists of about 890 square kilome-ters and roughly 600,000 building models, far most of them mod-eled in in CityGML LOD2 and textured with real-world textures. About 350 building models are included as LOD3 or LOD4 with a highly detailed outer shell or even modeled interiors. All in all the model comprises about 5 millions single textures for building models. Additionally a high resolution aerial photography and several other map layers for terrain texturing are available from standards-based Web Map Services (de La Beaujardiere, 2004). The target of the project is to apply city models with a high us-ability. A very strong argument for using our approach was that transmitting the original 3D data of the city model to the clients would hardly possible due to legal restrictions and security - 3D geodata is stored and managed only by the dedicated 3D server.
We configured the process to generate three different combina-tions of underlying map (an aerial photo, an OpenStreetmap-based map, and an official map of berlin using a 1:5000 scale) as base layers. Each layer was generated for all four principal directions in eight zoom levels, leading to 412885 JPEG-encoded image tiles per direction and base layer resulting in an overall data size for all base-layers and all map orientations of about 40 GB (leads to average tile size of about 8 kB). The overall area covered by the map is around 1700 km, which is far more than the area of the city alone, but necessary to include all of the cities’ area in one rectangular area.
The core functionality of the system is to explore the available real-estate offers and provide information about the social, eco-nomic, and infrastructural context of the city of berlin. For our partner, it was essential not to show out-date real estate of-fers, since Berlin Partner consultants use the application in in-situ counseling sessions together with customers. This is why we im-plemented a special type of client-side data adaptor to query the real-estate service, which is also the basis for the real-estate por-tal website. The service provides a list of available real estates as well as details per offer encoded in JSON. The overview list is fetched on start of the application. Any additional detail data for single real-estate properties, i.e., images, detailed descriptions, and pricing information, is requested on demand from the real-estate service.
The POI information for infrastructure, economy, and social in-formation is considered to change very infrequently. Therefore, they are integrated into the application through a unified JSON format that is held on a server together with the tile data. Pre-caching and format homogenization assures, that the data origi-nating from different sources can be accessed with the same sim-ple format and the same (low) server-side latency.
7 DISCUSSION
The amount of image data that has to be transferred when us-ing the application can be reduced efficiently through cachus-ing. Image tiles for map layers are quite static, which makes them ef-ficiently cacheable on server and also on client side. This way, it is possible to serve large numbers of simultaneous users by a single server. As worst case, filling a high definition display with no previously build cache, in our test case the display of an iPad 3 measuring 2048 x 1536 pixels, needs therefore 48 image tiles (sized 256 x 256 pixel each, file size of average 8 kB) summing to about 192 kB of downloaded data. These tiles cover a minimum of square kilometer in the highest available zoom level.
Typically, average commercially available data-center servers pro-vide a network connection of 100 MBit/s, which could theoreti-cally serve 65 full iPad 3 displays per second. The throughput can still be improved by mirroring servers and improved network (e.g. a gigabit uplink) and IO devices (additional configured raid, solid state disks, or memory disks). High-performance, optimized web server software (e.g., nginx) is able to serve up to 500,000 re-quests per second. Cloud-based storage, e.g., amazon S3, was not evaluated in practice up to now. The usual performance char-acteristics of such cloud based storage solutions provide an even better on elastic scaling. Since there are little to no running costs when no client application is running, this solution is actually better in terms of operational costs, since no permanent operating costs for unused server machines apply while still being able to scale up for peak use times.
Figure 4: Examples for different styling methods available in the rendering backend. Stylization allows to tailor the look of an application, e.g., to have a more realistic, abstract, or a more focused appearance on client side. 4 different stylizations are depicted for comparison: (a) textured facades, (b) an image abstraction filter was applied to remove details from the image, (c) an OpenStreetmap was applied on the terrain, and (d) the buildings are rendered using a simple shaded style to focus on the building geometry.
7.1 Usage Scenarios and Areas of Application
For most purposes, such as user orientation within or exploration of urban areas, the very simple mode of presentation and user interaction used in our oblique view applications turns out to be very effective in use and efficient in deployment. The complex-ity that comes with applications allowing a free 3D camera nav-igation in virtual 3D environments is often not needed by users to perform typical tasks using a virtual 3D city model. While a free 3D camera navigation in conventional applications enables users to perform tasks such as evaluation of lines of sights or in-detail inspection of objects in 3D, the map-like interaction and presentation used in our approach is reducing the mental effort for navigating a 3D environment. Nevertheless, since there are only a limited number of camera orientations that can be used to explore the virtual 3D city model, object occlusion cannot be avoided. The degree of the occlusion is dependent on the current map zoom levels (closer camera distances to objects cause larger numbers of potentially interesting objects to be occluded) and the shape of the underlying model (e.g., height of buildings and the general building density). For application cases, where occlu-sion caused by buildings is a problem, special rendering styles, such as semi transparent buildings or geometry cuts at a given height, could be applied to buildings occluding objects of inter-est for for a particular application. Further, client applications could be extended to include a in detail inspection mode provid-ing detail views for specific areas of interest. Currently we did not implement such additional interaction and presentation tech-niques, since these are very application specific. Since our current application focusses on a viewing scale that allows to judge the context of an real estate offered, the implemented presentation and interaction techniques where seen sufficient by users of the application to navigate through the virtual 3D city model.
Model data access play a viable role when using 3D city model applications. Since the functionality to be implemented in client applications is kept simple (map presentation, web-based infor-mation retrieval for model features via URLs), concrete appli-cation logic can be implemented in appliappli-cation servers. This also enables the integration of existing web-based application into browser-based apps as well as into mobile applications run-ning on smartphones or tablet. This way, functionality and system components that have been created before to support work pro-cesses can be reused also for 3D city model applications with no or little adjustments regarding the layout and compatibility with touch enabled devices. Nevertheless, the approach of generating configurable client applications is still limited in terms the way existing web-based solutions integrate into such an application. It is not possible to provide a native user interface for client web
services that do not implement a specific standard, e.g., a trans-actional WFS for viewing or editing feature data. Custom service endpoints need to be implemented as a plugin for client applica-tion, as it was done for the real-estate service used for our demon-stration case. Therefore code changes are necessary to integrate new types of services into client mobile applications.
8 CONCLUSIONS AND FUTURE WORK
In this paper we presented a novel approach for provisioning ap-plications based on massive virtual 3D city models on heteroge-neous platforms, namely mobile devices, running Android or iOS operating systems, and web browsers. The process involves only a very limited amount of manual customization for applications dependent on the actual use case, which makes the provisioning and operation of high quality 3D visualization applications for a larger audience very cost effective and easy to handle.
The approach can be extended towards automatic derivation of applications for exploration for complex indoor models, which have not been addressed yet. Especially the exploration of com-plex modeled building structures, including stories, provides pro-mising possibilities for generating, e.g., a smartMap layer per story and allowing users to select the story to show on client side. Further, these applications provide possibilities to integrate 3D city model visualization into existing systems and workflows (e.g., for real-estate marketing) generating additional values for these systems.
The potential of additional G-Buffer layers for the interactivity and client-side rendering of map layers are not yet finally ex-ploited. Additionally to the object ID maps, which are currently used for identifying single objects within the map, maps encoding the object type or category can be used either to implement client side highlighting effects for specific types of objects as well as providing a type sensitive interaction within the map application.
Currently, the configuration for tile generation and POI-data inte-gration is created by hand. A user interface for the overall process for application data generation could speed up the overall process and would also allow non-expert users to configure and generate application datasets.
9 ACKNOWLEDGEMENTS
We would like to thank our Partners the Berlin Partner GmbH for their corporation and the ability to use the 3D city model of Berlin and 3D Content Logistics GmbH for their support and col-laboration.
REFERENCES
Akenine-M¨oller T., H. E. and N., H., 2008. Real-Time Rendering 3rd Edition. A. K. Peters, Ltd., Natick, MA, USA.
Basanow, J., Neis, P., Neubauer, S., Schilling, A. and Zipf, A., 2008. Towards 3D Spatial Data Infrastructures (3D-SDI) based on open standards experiences, results and future issues. In: Ad-vances in 3D Geoinformation Systems, Lecture Notes in Geoin-formation and Cartography, Springer Berlin Heidelberg, Berlin, Heidelberg, pp. 65–86.
Christen, M., Nebiker, S. and Loesch, B., 2012. Web-Based Large-Scale 3D-Geovisualisation Using WebGL. International Journal of 3-D Information Modeling 1(3), pp. 16–25.
de La Beaujardiere, J., 2004. OGC Web Map Service Interface.
Doellner, J., Hagedorn, B. and Klimke, J., 2012. Server-based rendering of large 3D scenes for mobile devices using G-buffer cube maps. In: Proceedings of the 17th International Conference on 3D Web Technology, Web3D ’12, ACM, New York, NY, USA, pp. 97–100.
Gesquire, G. Manin, A., 2012. 3d visualization of urban data based on citygml with webgl. International Journal of 3-D Infor-mation Modeling 1, pp. 1–15.
Gr¨oger, G., Kolbe, T. H., Nagel, C. and H¨afele, K.-H., 2012. OGC City Geography Markup Language (CityGML) Encoding Standard, Version 2.0.
Haber, R. B. and McNapp, D. A., 1990. Visualization Idioms: A Conceptual Model for Scientific Visualization Systems. In: Visualization in Scientific Computing, IEEE, pp. 74–93.
Hagedorn, B., 2010. Web view service discussion paper, Version 0.6. 0. Open Geospatial Consortium Inc.
Jeschke, S., Wimmer, M. and Purgathofer, W., 2005. Image-based representations for accelerated rendering of complex scenes. In: Y. Chrysanthou and M. Magnor (eds), EURO-GRAPHICS 2005 State of the Art Reports, pp. 1–20.
Lefebvre, S., Darbon, J. and Neyret, F., 2004. Unified texture management for arbitrary meshes. Rapport de recherche RR-5210, INRIA.
Mao, B., 2011. Visualization and Generalization of 3D City Mod-els. PhD thesis, Royal Institute of Technology.
Pan, B., Zhao, Y., Guo, X., Chen, X., Chen, W. and Peng, Q., 2013. Perception-motivated visualization for 3D city scenes. The Visual Computer 29(4), pp. 277–286.
Papazoglou, M. P., Traverso, P., Dustdar, S. and Leymann, F., 2007. Service-Oriented Computing: State of the Art and Re-search Challenges. Computer 40(11), pp. 38–45.
Prieto, I. n. and Izkara, J. L., 2012. Visualization of 3D city mod-els on mobile devices. In: Proceedings of the 17th International Conference on 3D Web Technology - Web3D ’12, Vol. 1number 212, ACM Press, New York, New York, USA, p. 101.
Saito, T. and Takahashi, T., 1990. Comprehensible rendering of 3-D shapes. SIGGRAPH Computer Graphics 24(4), pp. 197–206.
Schilling, A. and Kolbe, T. H., 2010. Draft for Candidate OpenGIS Web 3D Service Interface Standard.
Semmo, A., Trapp, M., Kyprianidis, J. E. and D¨ollner, J., 2012. Interactive visualization of generalized virtual 3d city models us-ing level-of-abstraction transitions. Computer Graphics Forum 31(3), pp. 885–894. Proceedings EuroVis 2012.